Documentation Revision Date: 2019-02-26
Dataset Version: 1
Summary
There is one file in comma separated (.csv) format in this dataset.
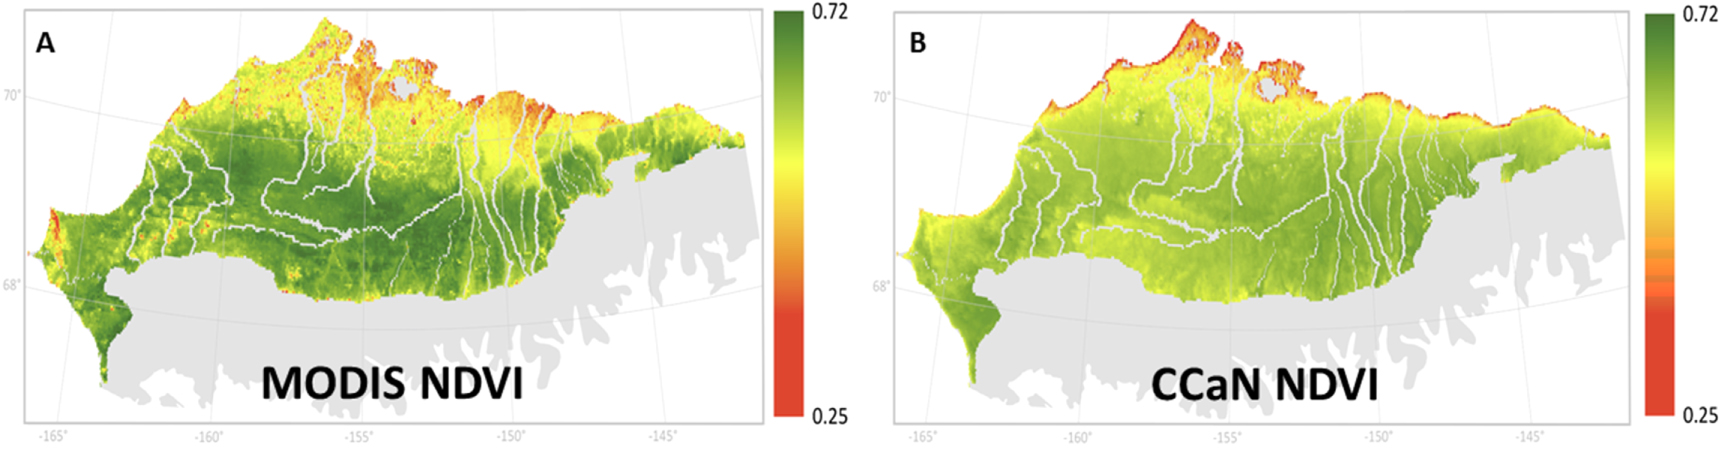
Figure 1. MODIS (A) and CCaN (B) average growing season NDVI. From Figure 2 of Rocha et al. (2018).
Citation
Rocha, A.V., and K.S. Wright. 2019. ABoVE: MODIS- and CCAN-Derived NDVI and Trends, North Slope of Alaska, 2000-2015. ORNL DAAC, Oak Ridge, Tennessee, USA. https://doi.org/10.3334/ORNLDAAC/1666
Table of Contents
- Dataset Overview
- Data Characteristics
- Application and Derivation
- Quality Assessment
- Data Acquisition, Materials, and Methods
- Data Access
- References
Dataset Overview
This dataset provides the average Normalized Difference Vegetation Index (NDVI) at 1-km resolution over the north slope of Alaska, USA, for the growing season (June-August) of each year from 2000-2015, and NDVI trends for the same period. The dataset presents growing-season averages and trends from two sources: 1) derived from 1-km, 8-day data from the Moderate Resolution Imaging Spectroradiometer (MODIS) NDVI (MOD13A2) product, and 2) predicted by the Coupled Carbon and Nitrogen model (CCaN). CCaN is a mass balance carbon and nitrogen model that was driven by 1-km MODIS surface temperature and climate data for the North Slope of Alaska and parameterized using model-data fusion, where model predictions were ecologically constrained with historical ecological ground and satellite-based data.
Project: Arctic-Boreal Vulnerability Experiment (ABoVE)
The Arctic-Boreal Vulnerability Experiment (ABoVE) is a NASA Terrestrial Ecology Program field campaign that will take place in Alaska and western Canada between 2016 and 2021. Research for ABoVE will link field-based, process-level studies with geospatial data products derived from airborne and satellite sensors, providing a foundation for improving the analysis, and modeling capabilities needed to understand and predict ecosystem responses and societal implications.
Related Publication:
Rocha, A.V., Blakely, B., Jiang, Y., Wright, K.S., Curasi, S.R. 2018. Is arctic greening consistent with the ecology of tundra? Lessons from an ecologically informed mass balance model. Environmental Research Letters 13: 125007. https://doi.org/10.1088/1748-9326/aaeb50
Related Datasets:
Verbyla, D. 2018. ABoVE: MODIS-derived Maximum NDVI, Northern Alaska and Yukon Territory for 2002-2017. ORNL DAAC, Oak Ridge, Tennessee, USA. https://doi.org/10.3334/ORNLDAAC/1614
Walker, D.A., and M.K. Raynolds. 2018. Maps of Vegetation, NDVI, Snow and Thaw Depths: North Slope, Alaska and NWT, Canada. ORNL DAAC, Oak Ridge, Tennessee, USA. https://doi.org/10.3334/ORNLDAAC/1386
Acknowledgements: This work was funded by NASA NESSF Grant NNX15AN89H.
Data Characteristics
Spatial Coverage: Northern Alaska and Yukon Territory, Canada
ABoVE Reference Locations:
Domain: Core ABoVE
State/territory: Alaska and Yukon Territory, Canada
Spatial Resolution: 1 km
Temporal Coverage: The data covers the period 2000-01-01 to 2015-12-31.
Temporal Resolution: annual
Study Areas (All latitude and longitude given in decimal degrees)
| Site | Westernmost Longitude | Easternmost Longitude | Northernmost Longitude | Southernmost Longitude |
|---|---|---|---|---|
| North Slope of Alaska | -166.85 | -140.98 | 71.376 | 66.988 |
Data File Information
This dataset includes one .csv file: MODIS_CCaN_ALL.csv
NDVI is unitless by definition.
NDVI trends are expressed as the change in NDVI per year.
Missing values = -9999
There are 296,349 rows of data with each row representing NDVI for a 1-km2 grid cell. Latitude and longitude represent the center point of each cell. The dataset is georeferenced and in geographic (lat/long) projection.
Table 1. Variables in the data file MODIS_CCaN_ALL.csv
| Variable | Description |
|---|---|
| latitude | Decimal degrees latitude for the grid point. |
| longitude | Decimal degrees longitude for the grid point. |
| modis_ndvi_2000 | Average growing-season NDVI for the year 2000 as measured by MODIS. |
| modis_ndvi_2001 | Average growing-season NDVI for the year 2001 as measured by MODIS. |
| modis_ndvi_2002 | Average growing-season NDVI for the year 2002 as measured by MODIS. |
| modis_ndvi_2003 | Average growing-season NDVI for the year 2003 as measured by MODIS. |
| modis_ndvi_2004 | Average growing-season NDVI for the year 2004 as measured by MODIS. |
| modis_ndvi_2005 | Average growing-season NDVI for the year 2005 as measured by MODIS. |
| modis_ndvi_2006 | Average growing-season NDVI for the year 2006 as measured by MODIS. |
| modis_ndvi_2007 | Average growing-season NDVI for the year 2007 as measured by MODIS. |
| modis_ndvi_2008 | Average growing-season NDVI for the year 2008 as measured by MODIS. |
| modis_ndvi_2009 | Average growing-season NDVI for the year 2009 as measured by MODIS. |
| modis_ndvi_2010 | Average growing-season NDVI for the year 2010 as measured by MODIS. |
| modis_ndvi_2011 | Average growing-season NDVI for the year 2011 as measured by MODIS. |
| modis_ndvi_2012 | Average growing-season NDVI for the year 2012 as measured by MODIS. |
| modis_ndvi_2013 | Average growing-season NDVI for the year 2013 as measured by MODIS. |
| modis_ndvi_2014 | Average growing-season NDVI for the year 2014 as measured by MODIS. |
| modis_ndvi_2015 | Average growing-season NDVI for the year 2015 as measured by MODIS. |
| average_modis_ndvi | Average growing-season NDVI for the years 2000-2015 as measured by MODIS. |
| modis_ndvi_trend | Growing-season NDVI trend for the years 2000-2015, based on MODIS observations. NDVI trends are expressed as the change in NDVI per year. |
| modis_ndvi_trend_p-value | p-value for the trend reported in “modis_ndvi_trend" |
| ccan_ndvi_2000 | Average growing-season NDVI for the year 2000 as predicted by CCaN |
| ccan_ndvi_2001 | Average growing-season NDVI for the year 2001 as predicted by CCaN |
| ccan_ndvi_2002 | Average growing-season NDVI for the year 2002 as predicted by CCaN |
| ccan_ndvi_2003 | Average growing-season NDVI for the year 2003 as predicted by CCaN |
| ccan_ndvi_2004 | Average growing-season NDVI for the year 2004 as predicted by CCaN |
| ccan_ndvi_2005 | Average growing-season NDVI for the year 2005 as predicted by CCaN |
| ccan_ndvi_2006 | Average growing-season NDVI for the year 2006 as predicted by CCaN |
| ccan_ndvi_2007 | Average growing-season NDVI for the year 2007 as predicted by CCaN |
| ccan_ndvi_2008 | Average growing-season NDVI for the year 2008 as predicted by CCaN |
| ccan_ndvi_2009 | Average growing-season NDVI for the year 2009 as predicted by CCaN |
| ccan_ndvi_2010 | Average growing-season NDVI for the year 2010 as predicted by CCaN |
| ccan_ndvi_2011 | Average growing-season NDVI for the year 2011 as predicted by CCaN |
| ccan_ndvi_2012 | Average growing-season NDVI for the year 2012 as predicted by CCaN |
| ccan_ndvi_2013 | Average growing-season NDVI for the year 2013 as predicted by CCaN |
| ccan_ndvi_2014 | Average growing-season NDVI for the year 2014 as predicted by CCaN |
| ccan_ndvi_2015 | Average growing-season NDVI for the year 2015 as predicted by CCaN |
| average_ccan_ndvi | Average growing-season NDVI for the years 2000-2015 as predicted by CCaN. |
| ccan_ndvi_trend | Growing-season NDVI trend for the years 2000-2015, based on CCaN predictions. NDVI trends are expressed as the change in NDVI per year. |
| ccan_ndvi_trend_p-value | p-value for the trend reported in, “ccan_ndvi_trend” |
Application and Derivation
Satellite based observations of NDVI have illustrated a “greening of the arctic”. NDVI is a proxy for leaf area. In order to better understand the observed greening response, it must be determined whether the greening signal observed by satellites is expected given a priori knowledge of the ecophysiology and biogeography of arctic vegetation.
Quality Assessment
An individual cost function was calculated as the total uncertainty-weighted squared data-model disagreement for each data type. This function was used to evaluate the parameters in CCaN by methods discussed in the associated paper.
For MODIS NDVI, fill-value (poor quality) pixels from cloud or snow cover were removed and gap filled with a modified Savitsky-Golay filter. To eliminate low NDVI values due to open water and exposed floodplain sediment, MODIS and CCaN pixels that were located on or near water bodies were removed, using data obtained from the National Hydrology Dataset (see associated paper for links).
For NDVI trends, non-parametric tests were chosen over traditional least squares regression methods to account for skewed or heteroscedastic data and outliers that may influence the estimation of trends. Further information regarding these methods is available in the associated paper.
Data Acquisition, Materials, and Methods
CCaN couples C and N cycles through the linear relationship between LAI and foliar N, a shared litter-fall rate for C and N, and plant N uptake limited by root biomass. The model is driven with daily light and temperature, and predicts daily net ecosystem exchange of CO2 (NEE), LAI, and NDVI using functional convergence models discussed in the associated paper. NDVI was obtained by inverting the exponential relationship between ground-based LAI and NDVI observations. CCaN was constrained with field measured C and N cycling processes and their uncertainties, and was parameterized with model-data fusion.
MODIS data were retrieved from the Land Processes Distributed Active Archive Center (LP-DAAC) using the R package “ModisDownload”. 1 km, 8-day MODIS NDVI (MOD13A2) was used to characterize vegetation greenness; 1 km, 8-day MODIS Land Surface Temperature and Emissivity (MOD11A2) was used to characterize land surface temperature; and 1 km, 8-day MODIS NDVI (MOD13A2) was used to characterize vegetation greenness across the North Slope of Alaska.
For CCaN parameterization and determination of MODIS NDVI uncertainty, a 15 year NDVI time series from 32 sites was extracted along a North-South transect extending from 65-70°N that ran along Alaska’s Dalton highway. MODIS NDVI was aggregated into growing season averages and then further aggregated to a 15 year average growing season NDVI map for the north slope, which was used to validate the CCAN NDVI map for the same period using the same growing season average.
NDVI trends were determined with a modified Mann Kendall and a Thiel Sen robust linear regression at the 95% confidence level. The regression slope (i.e., the greening trend) was determined with a Theil Sen robust linear regression. Details regarding the Mann Kendall and Thiel Sen regression are available in Rocha et al. (2018).
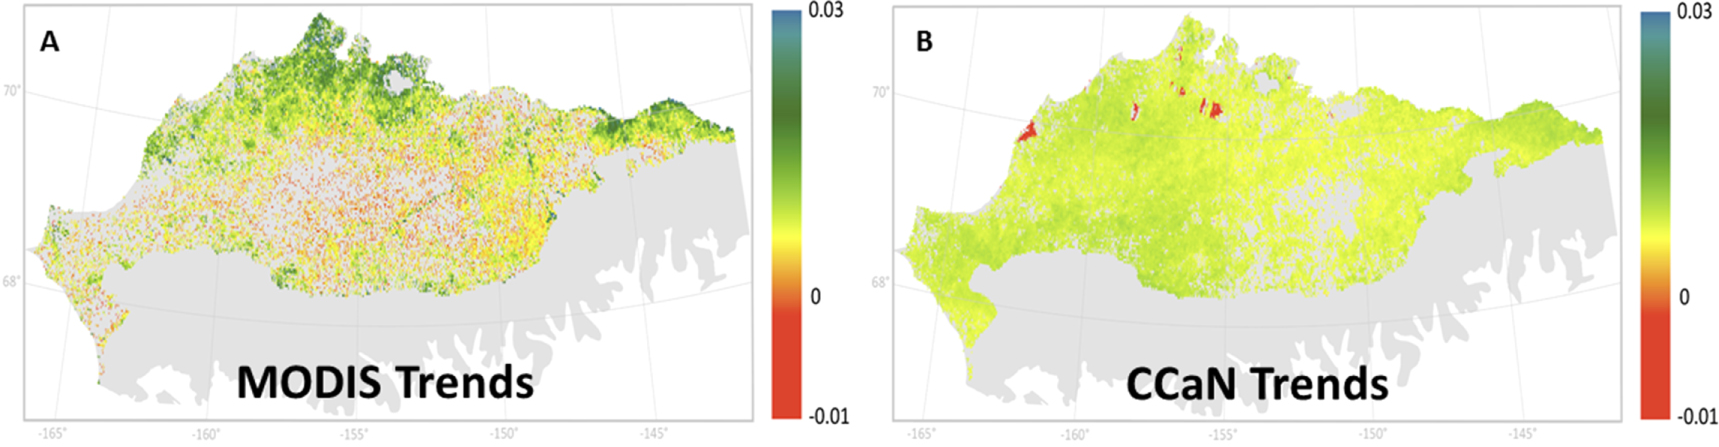
Figure 2. MODIS (A) and CCaN (B) NDVI trends from 2000-2015. From Figure 3 of Rocha et al. (2018).
Data Access
These data are available through the Oak Ridge National Laboratory (ORNL) Distributed Active Archive Center (DAAC).
ABoVE: MODIS- and CCAN-Derived NDVI and Trends, North Slope of Alaska, 2000-2015
Contact for Data Center Access Information:
- E-mail: uso@daac.ornl.gov
- Telephone: +1 (865) 241-3952
References
Rocha, A.V., Blakely, B., Jiang, Y., Wright, K.S., Curasi, S.R. 2018. Is arctic greening consistent with the ecology of tundra? Lessons from an ecologically informed mass balance model. Environmental Research Letters 13: 125007. https://doi.org/10.1088/1748-9326/aaeb50