Documentation Revision Date: 2020-09-18
Dataset Version: 1
Summary
There are 20 files in this dataset. Ten files are provided in comma-separated values (*.csv) format, and 10 identical files are provided in LASer (i.e, laser point cloud, *.las) format.
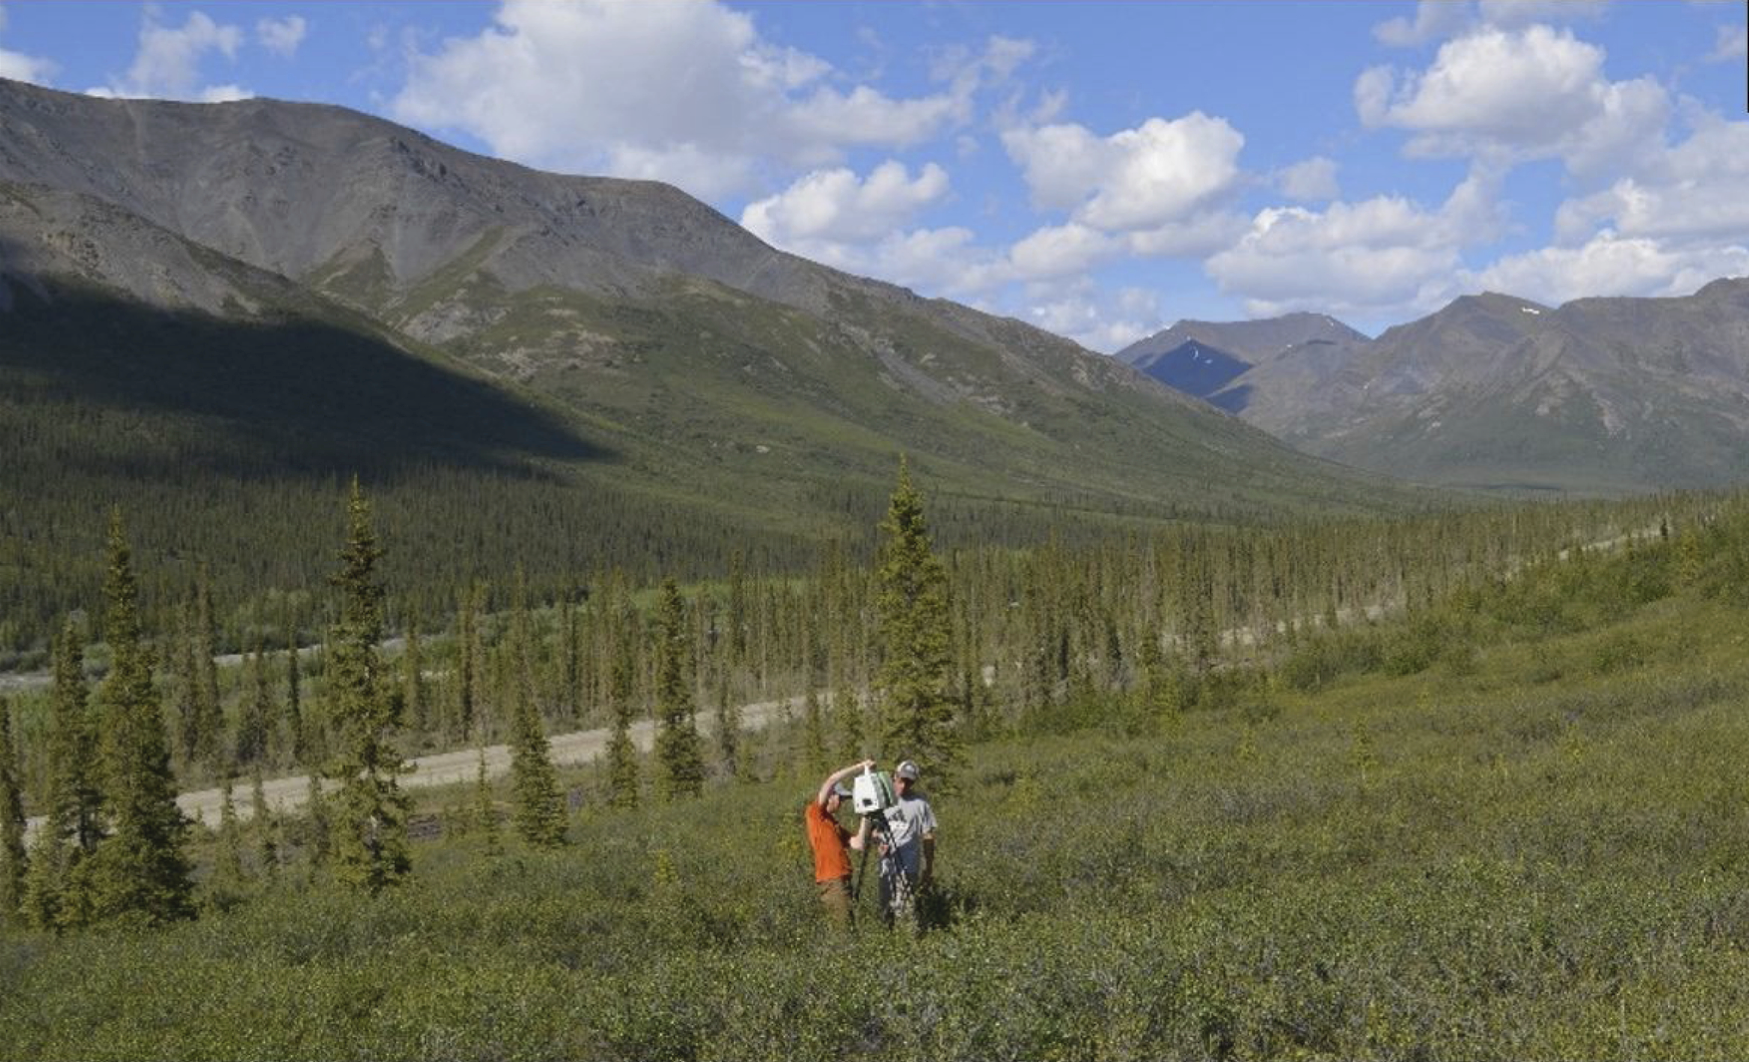
Figure 1. A perspective of one study plot at the forest-tundra ecotone with mature spruce trees transitioning into short-stature trees and low-stature deciduous shrubs. From Maguire et al. (2019). Photo credit: Kevin Krajick, Lamont-Doherty Earth Observatory.
Citation
Maguire, A.J., J. Eitel, L. Vierling, N. Boelman, K. Griffin, J.S. Jennewein, and J.E. Jensen. 2020. ABoVE: Terrestrial Lidar Scanning Forest-Tundra Ecotone, Brooks Range, Alaska, 2016. ORNL DAAC, Oak Ridge, Tennessee, USA. https://doi.org/10.3334/ORNLDAAC/1782
Table of Contents
- Dataset Overview
- Data Characteristics
- Application and Derivation
- Quality Assessment
- Data Acquisition, Materials, and Methods
- Data Access
- References
Dataset Overview
This dataset provides terrestrial lidar scanning (TLS) point cloud data collected at 10 research plots along the forest-tundra ecotone (FTE) in the Brooks Range of Alaska, south of Chandalar Shelf and Atigun Pass on the east side of the Dalton Highway. Data were collected in mid-June 2016. Data were acquired for each plot from multiple scan positions with a Leica ScanStation C10 green wavelength laser instrument. After processing the point spacing is < 1 cm. TLS enables resolution of 3-dimensional landscape features that can be used to derive ecologically important metrics of canopy structure and surface topography at high spatial resolution.
Project: Arctic-Boreal Vulnerability Experiment
The Arctic-Boreal Vulnerability Experiment (ABoVE) is a NASA Terrestrial Ecology Program field campaign being conducted in Alaska and western Canada, for 8 to 10 years, starting in 2015. Research for ABoVE links field-based, process-level studies with geospatial data products derived from airborne and satellite sensors, providing a foundation for improving the analysis, and modeling capabilities needed to understand and predict ecosystem responses to, and societal implications of, climate change in the Arctic and Boreal regions.
Related Publication:
Maguire, A.J., J.U. Eitel, L.A. Vierling, D.M. Johnson, K.L. Griffin, N.T. Boelman, J.E. Jensen, H.E. Greaves, and A.J. Meddens. 2019. Terrestrial lidar scanning reveals fine-scale linkages between microstructure and photosynthetic functioning of small-stature spruce trees at the forest-tundra ecotone. Agricultural and Forest Meteorology, 269:157-168. https://doi.org/10.1016/j.agrformet.2019.02.019
Acknowledgments:
This work was supported by NASA ABoVE grant NNX15AT86A.
Data Characteristics
Spatial Coverage: East side of Dalton Highway, south of Chandalar Shelf, Brooks Range, Alaska, USA
Spatial Resolution: Sub-cm spaced point cloud for each of 10 research plots
Temporal Coverage: 2016-06-14 to 2016-06-25
Temporal Resolution: One-time measurements
Study Area: Latitude and longitude are given in decimal degrees.
| Site | Northernmost Latitude | Southernmost Latitude | Easternmost Longitude | Westernmost Longitude |
|---|---|---|---|---|
| full extent | 68.020421 | 67.970382 | -149.715426 | -149.764580 |
| plot 01 | 68.020421 | 68.017826 | -149.715426 | -149.724897 |
| plot 02 | 68.006638 | 68.004177 | -149.737309 | -149.741428 |
| plot 03 | 67.997566 | 67.993362 | -149.748477 | -149.759201 |
| plot 04 | 67.996777 | 67.992930 | -149.749846 | -149.760306 |
| plot 05 | 67.986687 | 67.983299 | -149.755259 | -149.764580 |
| plot 06 | 67.972849 | 67.970382 | -149.756384 | -149.759552 |
| plot 07 | 68.019069 | 68.018670 | -149.718334 | -149.719330 |
| plot 08 | 68.003153 | 68.002755 | -149.742922 | -149.743911 |
| plot 09 | 67.995798 | 67.995395 | -149.752012 | -149.752999 |
| plot 10 | 67.994914 | 67.994505 | -149.752604 | -149.753578 |
Data File Information:
There are 20 files in this dataset. Ten files are provided in comma-separated values (*.csv) format, and 10 identical files are provided in LASer (i.e, laser point cloud, *.las) format.
The file naming convention is FTE_TLS_plotXX.csv and FTE_TLS_plotXX.las, where XX is a research plot number from 01 and 10.
FTE stands from forest-tundra ecotone, and TLS stands from terrestrial lidar scanning.
Data File Details
Table 1. File names and descriptions.
| File Name | Units | Description |
|---|---|---|
| FTE_TLS_plotXX.csv | meters | 3 variables: x = easting y = northing z = above sea level |
| FTW_TLS_plotXX.las | meters | 3 variables: x = easting y = northing z = above sea level |
Table 2. Plot names and number of records (i.e., measurements within a point cloud).
| Plot | Number of Records |
|---|---|
| plot 01 | 50,466,852 |
| plot 02 | 37,326,874 |
| plot 03 | 102,768,248 |
| plot 04 | 97,971,506 |
| plot 05 | 54,679,764 |
| plot 06 | 52,707,410 |
| plot 07 | 68,970,130 |
| plot 08 | 80,176,281 |
| plot 09 | 56,538,491 |
| plot 10 | 58,640,016 |
The Spatial Reference System is:
PROJCS["WGS 84 / UTM zone 6N",
GEOGCS["WGS 84",
DATUM["WGS_1984",
SPHEROID["WGS 84",6378137,298.257223563,
AUTHORITY["EPSG","7030"]],
AUTHORITY["EPSG","6326"]],
PRIMEM["Greenwich",0,
AUTHORITY["EPSG","8901"]],
UNIT["degree",0.0174532925199433,
AUTHORITY["EPSG","9122"]],
AUTHORITY["EPSG","4326"]],
PROJECTION["Transverse_Mercator"],
PARAMETER["latitude_of_origin",0],
PARAMETER["central_meridian",-147],
PARAMETER["scale_factor",0.9996],
PARAMETER["false_easting",500000],
PARAMETER["false_northing",0],
UNIT["metre",1,
AUTHORITY["EPSG","9001"]],
AXIS["Easting",EAST],
AXIS["Northing",NORTH],
AUTHORITY["EPSG","32606"]]
Data Center Notes
Opening Large CSV Files: The GB-sized *.csv files will not open with the typical text editors or spreadsheet tools. The data provider suggests using the R package "data.table", specifically the fread function, but it might take a few minutes for a file to load.
Transforming Point Cloud Data: The point cloud data were originally provided in CSV format and were converted to the LAS format with a custom script created by the ORNL DAAC.
Application and Derivation
The high resolution 3-D characterization of canopy structure and topography at the structurally complex forest-tundra ecotone complements and validates airborne lidar measurements.
Mounting evidence suggests that microstructure (i.e., vegetation canopy and topography at cm to m scales) may be important for modulating environmental conditions to which plant processes are sensitive (e.g., temporal variance in intensity and duration of solar radiation. Terrestrial lidar (light detection and ranging) scanning (TLS) enables resolution of 3- dimensional (i.e., x, y, z) structure at cm-level detail and has facilitated novel insights into ecological processes controlled by microstructure.
Based on the 3-dimensional structural information provided by TLS, a range of ecologically important structural metrics can be derived that have been demonstrated as ecologically important such as ground surface or vegetation canopy roughness, solar radiation, and wind shelter. See Maguire et al.(2019) for more details.
Quality Assessment
Point clouds were manually edited to remove spurious returns from incidental airborne particles and flying insects.
Data Acquisition, Materials, and Methods
Field data were collected at 10 research plots within the forest-tundra ecotone (FTE) of the Brooks Range, south of Chandalar Shelf and Atigun Pass on the east side of the Dalton Highway, Alaska, USA. This location is on the southern side of the Brooks Range, 100 miles north of the Arctic Circle.
Terrestrial lidar scanning (TLS) data were acquired on the ground with a Leica ScanStation C10 (Leica Geosystems Inc., Heerbrugg, Switzerland). This time-of-flight 532 nm (green wavelength) laser instrument has a scan rate of up to 50,000 returns s−1, a maximum sample density exceeding 1 mm−1, and a maximum range of 134 m at 18% albedo. The nominal distance accuracy is 4 mm and nominal position accuracy is 6 mm. The low beam divergence (0.14 mrad) of the green scanning TLS instrument ensures that the laser frequently penetrates the canopy to measure the ground surface, which is important for characterizing microtopography.
In mid-June 2016, study plots were scanned from three to five different positions to minimize occlusion by vegetation canopies and maximize the spatial extent of point clouds. Using common locations from reflectance targets, the point clouds from different scan positions were registered into a single point cloud using Cyclone 9.1 (Leica Geosystems Inc., Heerbrugg, Switzerland). The point cloud was then georegistered using GPS data collected from a Trimble R7 and an external Zephyr geodetic antenna with nominal vertical and horizontal accuracy of 5 mm (Trimble Inc., Dayton, OH, USA). Tree locations were marked in the field using cardboard signs for identification in scan images. UTM coordinates for each of the 85 trees were manually extracted from the georegistered TLS point cloud by identifying the coordinates of the laser return associated with the top of each tree crown. Point clouds were manually edited to remove spurious returns from incidental airborne particles and flying insects and were cropped to approximately 40 m x 40 m (Fig. 2).
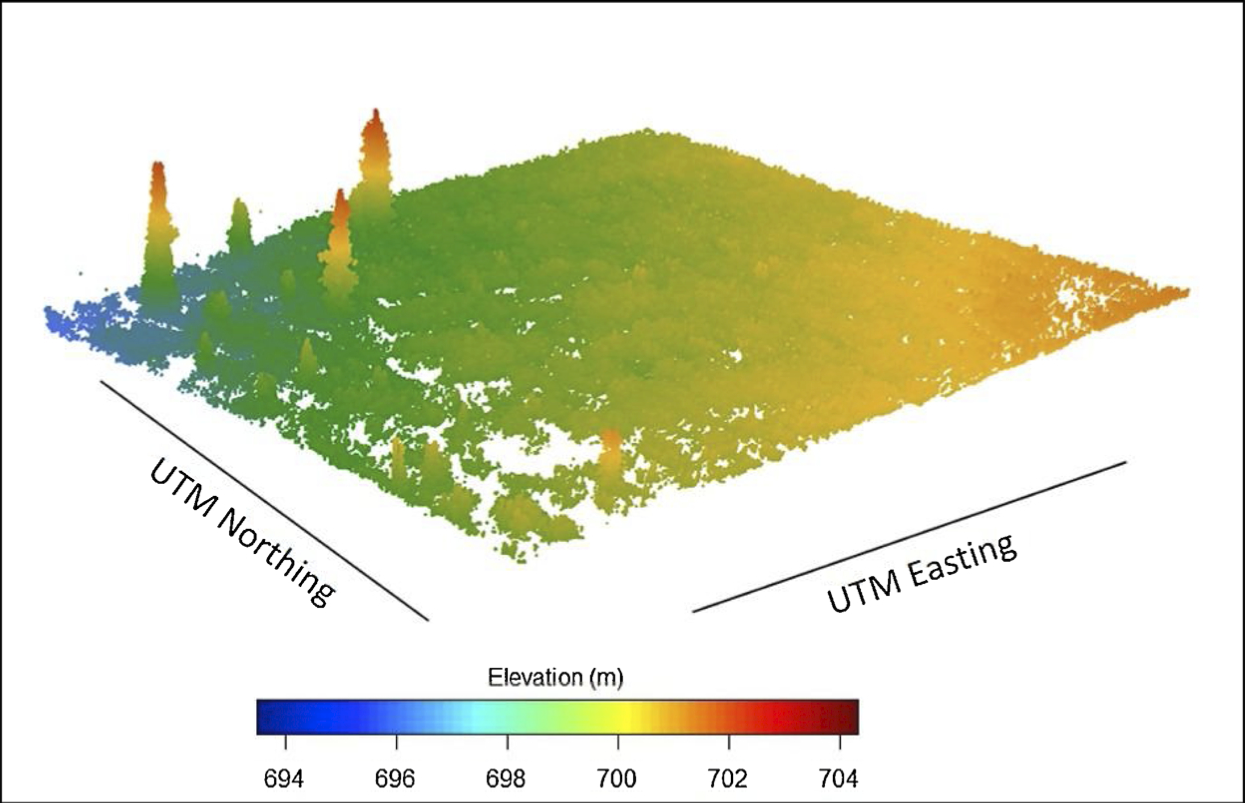
Figure 2. Visualization of one 40 m x 40 m georegistered point cloud illustrating the high-resolution biophysical structural information from terrestrial lidar scanning data acquisition. From Maguire et al. (2019).
Data Access
These data are available through the Oak Ridge National Laboratory (ORNL) Distributed Active Archive Center (DAAC).
ABoVE: Terrestrial Lidar Scanning Forest-Tundra Ecotone, Brooks Range, Alaska, 2016
Contact for Data Center Access Information:
- E-mail: uso@daac.ornl.gov
- Telephone: +1 (865) 241-3952
References
Maguire, A.J., J.U. Eitel, L.A. Vierling, D.M. Johnson, K.L. Griffin, N.T. Boelman, J.E. Jensen, H.E. Greaves, and A.J. Meddens. 2019. Terrestrial lidar scanning reveals fine-scale linkages between microstructure and photosynthetic functioning of small-stature spruce trees at the forest-tundra ecotone. Agricultural and Forest Meteorology, 269:157-168. https://doi.org/10.1016/j.agrformet.2019.02.019