Documentation Revision Date: 2021-12-21
Dataset Version: 1
Summary
There are 79 data files included in this dataset, 58 in GeoTIFF (*.tif) format and 21 compressed shapefiles (*.shp). Also included are 3 companion files, 2 in Keyhole Markup Language (*.kml) format and 1 in Portable Data Format (*.pdf).
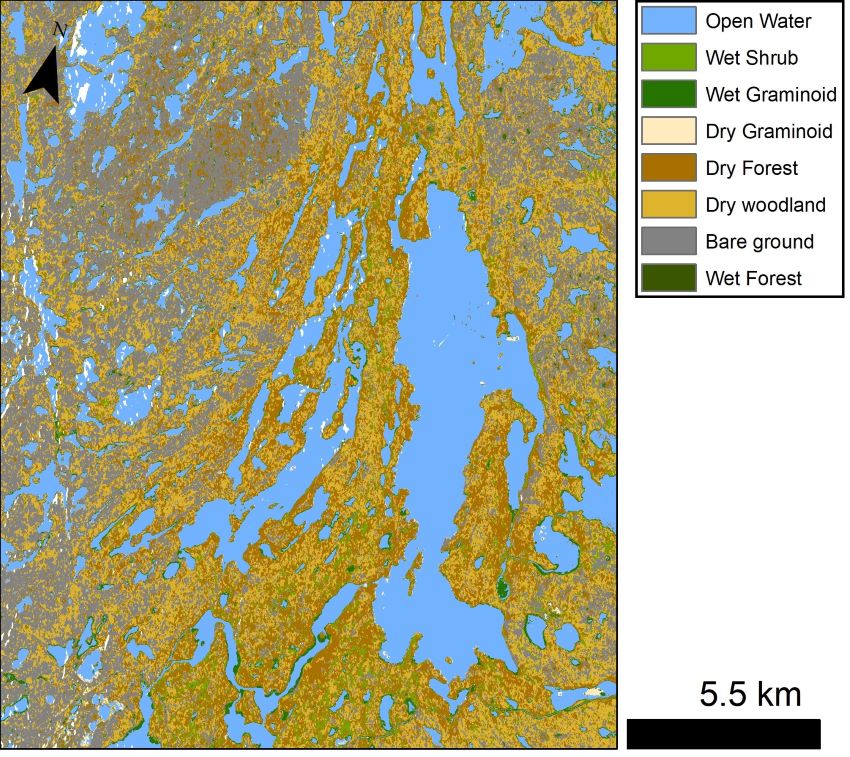
Figure 1. A preliminary wetland classification for Canadian Shield lakes north of Yellowknife, NWT, Canada. Missing data in some lakes appear as white spots. Source: bakerc_16008_19059_012_190904_L090_CX_01_Freeman-inc_cls.tif
Citation
Kyzivat, E.D., L.C. Smith, C. Huang, C. Wang, T. Langhorst, J.V. Fayne, M.E. Harlan, Y. Ishitsuka, D. Feng, L.H. Pitcher, and T.M. Pavelsky. 2021. ABoVE: Lake and Wetland Classification from L-band SAR, Alaska and Canada, 2017-2019. ORNL DAAC, Oak Ridge, Tennessee, USA. https://doi.org/10.3334/ORNLDAAC/1883
Table of Contents
- Dataset Overview
- Data Characteristics
- Application and Derivation
- Quality Assessment
- Data Acquisition, Materials, and Methods
- Data Access
- References
Dataset Overview
This dataset contains a high-resolution land cover classification focused on water and wetland vegetation classes over three NASA ABoVE Campaign regions: Yukon Flats, Alaska, USA; the Peace-Athabasca Delta, Alberta; and the Canadian Shield, Northwest Territories (NWT), Canada. The product was derived from L-band synthetic aperture radar (SAR) acquisitions from the airborne NASA UAVSAR instrument in 2017–2019. The classification was trained and validated from field visits, UAV images, satellite imagery as well as other ABoVE datasets. Classifications in all regions are provided as both preliminary 13-class versions and final, simplified 5-class versions. Training and test data used for the classifier are also included as well as characteristics of lakes in the study area. This land cover classification was developed to support a project focusing on potential methane emissions from the shallow near-shore, or littoral, regions of lakes. The emergent aquatic vegetation classes can be used as a proxy for these littoral zones. Wetland vegetation classifications are provided as gridded raster files with an approximately 5-meter spatial resolution and aligned with the original UAVSAR footprints. Composite mosaics that aggregate these UAVSAR scenes by region and day of acquisition, if applicable, are also provided. Classifications in all regions are provided as both preliminary 13-class versions and final 5-class versions.
Project: Arctic-Boreal Vulnerability Experiment
The Arctic-Boreal Vulnerability Experiment (ABoVE) is a NASA Terrestrial Ecology Program field campaign being conducted in Alaska and western Canada, for 8 to 10 years, starting in 2015. Research for ABoVE links field-based, process-level studies with geospatial data products derived from airborne and satellite sensors, providing a foundation for improving the analysis, and modeling capabilities needed to understand and predict ecosystem responses to, and societal implications of, climate change in the Arctic and Boreal regions.
Related Datasets
Kyzivat, E.D., L.C. Smith, L.H. Pitcher, J. Arvesen, T.M. Pavelsky, S.W. Cooley, and S. Topp. 2018. ABoVE: AirSWOT Color-Infrared Imagery Over Alaska and Canada, 2017. ORNL DAAC, Oak Ridge, Tennessee, USA. https://doi.org/10.3334/ORNLDAAC/1643
Pitcher, L.H., L.C. Smith, T.M. Pavelsky, J.V. Fayne, S.W. Cooley, E.H. Altenau, D.K. Moller, and J. Arvesen. 2019. ABoVE: AirSWOT Radar, Orthomosaic, and Water Masks, Yukon Flats Basin, Alaska, 2015. ORNL DAAC, Oak Ridge, Tennessee, USA. https://doi.org/10.3334/ORNLDAAC/1655
Acknowledgments
This project received support from NASA’s FINESST (grant 80NSSC19K1361), ABoVE (80NSSC19M0104), and Terrestrial Hydrology (NNX16AH83G) programs. In addition, NASA’s High-End Computing (HEC) Program and Center for Climate Simulation (NCCS) at Goddard Space Flight Center provided support via the ABoVE Science Cloud.
Data Characteristics
Spatial Coverage: Alaska, U.S.; Alberta and Northwest Territories, Canada
ABoVE Reference Locations
Domain: Core ABoVE
State/Territory: Alaska
Grid Cells (53): Ch043v030, Ch043v031, Ch044v029, Ch044v030, Ch044v031, Ch045v029, Ch045v030, Ch046v029, Ch046v030, Ch047v029, Ch047v030, Ch048v029, Ch048v030, Ch049v030, Ch050v030, Ch051v030, Ch082v065, Ch082v066, Ch082v067, Ch083v065, Ch083v066, Ch083v067, Ch083v081, Ch083v082, Ch083v083, Ch083v084, Ch083v085, Ch083v086, Ch084v079, Ch084v080, Ch084v081, Ch084v082, Ch084v083, Ch084v084, Ch084v085, Ch085v062, Ch085v063, Ch085v079, Ch085v080, Ch086v061, Ch086v062, Ch086v063, Ch087v060, Ch087v061, Ch087v062, Ch088v059, Ch088v060, Ch088v061, Ch089v058, Ch089v059, Ch089v060, Ch090v058, Ch090v059
Spatial Resolution: 6 meters
Temporal Coverage: 2017-01-01 to 2019-09-19
Temporal Resolution: Annual
Study Areas: Latitude and longitude are given in decimal degrees.
| Study Areas | Flight Line | Westernmost Longitude | Easternmost Longitude | Northernmost Latitude | Southernmost Latitude |
|---|---|---|---|---|---|
| Canadian Shield, Northwest Territories, Canada | bakerc, daring | -114.708 | -110.345 | 65.174 | 62.245 |
| Peace-Athabasca Delta, Alberta, Canada | padelt, padelE, padelW | -112.377 | -110.449 | 59.467 | 57.546 |
| Yukon Flats, Alaska, USA | ftyuko, yflats, yflatE, yflatW | -148.226 | -142.976 | 67.561 | 65.621 |
Data File Information
There are 79 data files included in this dataset, 58 in GeoTIFF (*.tif) format and 21 archived (*.zip) shapefiles (*.shp). Also included are 3 companion files, 2 in Keyhole Markup Language (KML; *.kml) format and 1 in Portable Data Format (*.pdf).
GeoTIFFs aligned with the UAVSAR footprints are named line_aaabb_ccccc_ddd_YYmmDD_eeee_ff_gg_model_class.tif and shapefiles containing lake characteristics are named line_aaabb_ccccc_ddd_YYmmDD_eeee_ff_gg_model_rcls_lakes.zip, where
line = flight line (see Study Area above),
aaa = aircraft heading,
bb = counter,
ccccc = UAVSAR flight designator,
ddd = flight line number,
YYmmDD is the year, month, and day,
eeee = frequency band + steering angle,
ff = cross-talk calibration,
gg = processing version number,
model = whether the “Freeman-inc” or “LUT-Freeman” derivative classification models were applied, and
class = whether the land cover classification is preliminary ("cls") or final ("rcls").
GeoTIFFs of the composite mosaics are named line_YYmmDD_mosaic_class.tif and use the naming elements provided above.
The land cover classification shapefiles are named line_training_YYYY_mmmm_x.zip, where line is the flight line and YYYY is the year. When present, mmmm is the abbreviated name of the month and x is a counter if there is more than one acquisition in the month. The month and counter information is missing if there was only one acquisition per year or month for a given line (see Table 3).
Names of GeoTIFFs align with the UAVSAR footprints follow the PolSAR naming convention for multi-look complex (MLC) files (NASA, 2015).
Table 1. File names and descriptions. Note: The *arcgis.lyr and *qgis.qml files are provided as-is. The user may need to modify those files to match local software and system settings.
| File Name | Description |
|---|---|
| Data Files | |
| line_YYmmDD_mosaic_class.tif | Preliminary ("cls") or final ("rcls") and cover classification aligning with composite mosaics for each study area combining all scenes acquired for a single date |
| line_aaabb_ccccc_ddd_YYmmDD_eeee_ff_gg_model_class.tif | Preliminary ("cls") or final ("rcls") land cover classification aligning with the UAVSAR scene footprints for each study area combining all scenes acquired for a single date |
| line_training_YYYY_mmmm_x.zip | Land cover classification: polygons of uniform land cover types used for training the classification procedure; see Tables 3–6 for attributes |
| line_aaabb_ccccc_ddd_YYmmDD_eeee_ff_gg_model_rcls_lakes.zip | Lake characteristics, including vegetative cover; see Table 7 for attributes |
| Study-areas.zip | Polygons that depict the study areas |
| UAVSAR_classification_footprints.zip | Footprints outlines of the UAVSAR imagery and the co-registered 13-class preliminary land cover for each footprint |
| Companion Files | |
| Lake_Wetland_Classes_UAVSAR.pdf | A PDF copy of this user guide |
| Study-areas.kml | A KML copy of Study-areas.zip for viewing in Google Earth |
| UAVSAR_classification_footprints.kml | A KML copy of UAVSAR_classification_footprints.zip for viewing in Google Earth |
| 5-classes-arcgis.lyr | Layer file for visualizing final ("rcls") land cover maps with ArcGIS |
| 5-classes-qgis.qml | Layer style file for 5-classes-arcgis.lyr |
| 13-classes-arcgis.lyr | Layer file for visualizing preliminary ("cls") land cover maps with ArcGIS |
| 13-classes-qgis.qml | Layer style file for 13-classes-arcgis.lyr |
Data File Details
All files are in the ABoVE Standard Projection, Canada Albers Equal Area Conic projection (ESRI:102001).
For GeoTIFFs, the cell sizes are 5.4–6.3 m.
Table 2. Classes in preliminary (13 classes) and final (5 classes) land cover. For the preliminary files, some of the classes were not separable and have the same name; there are 9 distinct land cover classes.
| Classification | Values | Description |
|---|---|---|
| Preliminary, raw classification: file names end with *_cls.tif or *_cls_mosaic.tif |
0 | No data |
| 1, 3, 4, 11 | Open water | |
| 2 | Wet shrubs | |
| 5 | Wet graminoid | |
| 6 | Dry graminoid | |
| 7, 8, 9 | Dry forest | |
| 10 | Dry woodland | |
| 12 | Bare ground | |
| 13 | Wet forest | |
| Final, analysis-ready: file names end with *_rcls.tif or *_rcls_mosaic.tif |
0 | No data |
| 1 | Land | |
| 2 | Open water | |
| 3 | Wet graminoid | |
| 4 | Wet shrubs | |
| 5 | Wet forest |
Table 3. Training shapefile names (i.e., data files named for data files named line_training_YYYY_mmmm_x.zip) and corresponding UAVSAR L-band scene (total of 764 features).
| Shapefile Name | Feature Count | UAVSAR Date | UAVSAR Scene |
|---|---|---|---|
| bakerc_training_2019.zip | 55 | 2019-09-05 | bakerc_16008_19060_037_190905_L090_CX_01 |
| padelt_training_2018.zip | 108 | 2018-08-21 | padelE_36000_18047_000_180821_L090_CX_01 |
| padelt_training_2019.zip | 195 | 2019-09-04 | padelE_36000_19059_003_190904_L090_CX_01 |
| padelW_training_2018.zip | 116 | 2018-08-21 | padelW_18035_18047_001_180821_L090_CX_01 |
| yflats_training_2017_June.zip | 116 | 2017-06-17 | yflats_21508_17069_009_170621_L090_CX_01 |
| yflats_training_2017_Sept_1.zip | 95 | 2017-09-17 | yflatW_21508_17098_006_170916_L090_CX_01 |
| yflats_training_2017_Sept_2.zip | 79 | 2017-09-17 | yflatE_21609_17098_008_170916_L090_CX_01 |
Table 4. Attributes of polygons for data files named line_training_YYYY_mmmm_x.zip.
| Attribute | Data Type | Description |
|---|---|---|
| Class | String | Observed land cover class: one of 13 possible class codes (Table 5) |
| Date | Date | Actual or average date of observation. "12:00:00 AM" means date unknown or from multiple sources |
| Source | String | Source of observation: one of 15 possible numerical source codes (Table 6) |
| Site | String | Place name for observation site, if applicable |
| Note | String | Note on how class was selected, if applicable |
Table 5. Description of classes used to train the land cover classifier. The “Value” column gives the raster cell value in preliminary land cover (Table 2) corresponding to the “Class” string from training shapefile attributes (Table 4). The feature count (total of 764) includes duplicate training polygons for temporally-constant land cover classes used as training for multiple UAVSAR scenes (total of 509,001).
| Value | Class | Long Name | Description | Feature Count | UAVSAR Pixel Count | Inundation Status |
|---|---|---|---|---|---|---|
| 1 | OW | Open Water | Open water (less radar reflective) | 83 | 54,366 | Wet |
| 2 | WS | Wet Shrub | Wet (emergent) shrub (thicket/savannah) 1–5 m tall can include flooded woodland | 65 | 40,353 | Wet |
| 3 | WH | Wet Herbaceous | Wet (emergent) herbaceous (usually water lilies) | 30 | 37,211 | Wet |
| 4 | SB | Sedimentary Bar | Gravel/sand bar, with or without water riffle | 27 | 47,489 | Wet * |
| 5 | WG | Wet Graminoid | Wet (emergent) graminoid (marsh/meadow) <3 m | 89 | 24,716 | Wet |
| 6 | DG | Dry Graminoid | Dry graminoid (marsh/meadow) <3 m tall | 59 | 50,698 | Dry |
| 7 | DS | Dry Shrub | Dry shrub (thicket/shrub) 1–5 m tall, >70% shrubs | 66 | 53,102 | Dry |
| 8 | DF | Dry Forest | Dry forest >5 m tall | 116 | 50,862 | Dry |
| 9 | BS | Bank Scarp Double-Bounce | Dry forest with double-bounce radar scattering from river/lake bank, located on the far-range side of a water body with respect to the radar look angle. | 57 | 15,359 | Dry |
| 10 | DW | Dry Woodland | Dry woodland (mix of grasses and woody vegetation, 30>60% woody), includes woodland and fen classes from Wang et al. (2019, 2020). | 53 | 41,374 | Dry |
| 11 | RW | Rough Water | Rough water (more radar reflective) | 60 | 50,490 | Wet |
| 12 | BG | Bare Ground | Bare, bedrock, mud, sand (≥60%) | 51 | 33,642 | Dry |
| 13 | WF | Wet Forest | Wet (emergent or flooded) forest >5 m, most commonly occurring in Yukon Flats. | 8 | 9,339 | Wet |
* Gravel/sand bars can be dry or wet, were spatially small, were barely separable from water, and interpreted as "open water".
Table 6. Key for the source of observation attribute (Table 4) for data files named line_training_YYYY_mmmm_x.zip. Codes 0, 2, and 3 have the most certainty for UAVSAR applications because they came from ground truth measurements, sometimes within a week of the UAVSAR flight.
| Source of Observation Code | Description |
|---|---|
| 0 | GPS shoreline walking |
| 1 | DigitalGlobe satellite image |
| 2 | Field photo or observation |
| 3 | UAV photo or orthomosaic |
| 4 | Landsat satellite image, 2019-09-10 |
| 5 | Sentinel satellite image, 2018-09-17 |
| 6 | Airplane window field photo |
| 7 | Interpretation of UAVSAR 2017 or 2018 radar imagery |
| 8 | Interpretation of UAVSAR 2019 radar imagery |
| 11 | Great Slave Lake ecosystem training areas, collected during 2014, 2015-2016, 2018 (average date 2016-07-31 in training polygon) (Bourgeau-Chavez et al., 2017, 2019). |
| 12 | ABoVE Land Cover for 2014 (average date 2014-07-31) (Wang et al., 2019; 2020). |
| 13 | AirSWOT color-infrared orthomosaics, 2017 (Kyzivat et al., 2019a; 2019b) |
| 14 | GPS shorelines traced by helicopter flight, June 2017 |
Table 7. Attributes for data files named line_aaabb_ccccc_ddd_YYmmDD_eeee_ff_gg_model_rcls_lakes.zip.
| Attribute | Units | Description |
|---|---|---|
| area_px_m2 | m2 | Area in square meters |
| perimeter_ | m | Perimeter in meters (unreliable for small lakes close to the pixel scale) |
| em_fractio | 1 | Emergent macrophyte coverage as fraction of lake (vegetated littoral zone; sum of fw_fractio, sw_fractio, and gw_fractio) |
| fw_fractio | 1 | Wet forest coverage as fraction of lake |
| sw_fractio | 1 | Wet shrub coverage as fraction of lake |
| gw_fractio | 1 | Wet graminoid coverage as fraction of lake |
| edge | flag | Indicates an edge lake that intersects a UAVSAR footprint boundary (1); otherwise (0) |
| cir_observ | flag | Indicates that the lake was detected in AirSWOT color-infrared camera (CIR) imagery (1); or that it was either not detected or not within coverage (0) |
Application and Derivation
This dataset contains a land cover classification focused on water and wetland classes over three ABoVE regions: Yukon Flats, AK; the Peace-Athabasca Delta, AB; and the Canadian Shield, NWT. This land cover classification was developed for a project focusing on potential methane emissions from the shallow near-shore, or littoral, regions of lakes. The emergent aquatic vegetation classes can be used as a proxy for these littoral zones. The product was derived from L-band synthetic aperture radar (SAR) acquisitions from the NASA UAVSAR instrument in 2017–2019. The product was trained and validated using GPS tracks and photos from field visits, UAV images, satellite imagery, and other ABoVE datasets.
Quality Assessment
The classification accuracy was assessed using a standard confusion matrix, using a test subset of the training data. The overall accuracy of this classifier was 84.1% for the Freeman-Durden model and 87.4% for the model with the additional LUT method. In addition, users are cautioned that the land cover classification produced outside the training regions is likely less accurate, but for consistency, land cover classification is provided for the entire original UAVSAR flight lines. Wetlands received priority, and less attention was given to the delineation between the dry land classes. None of the training data included mountainous, urban, or recently burned regions, resulting in poor performance for areas with these characteristics.
Data Acquisition, Materials, and Methods
The land cover classification was performed on polarimetric L-band synthetic aperture radar (SAR) images from the NASA UAVSAR instrument (NASA, 2020) acquired in 2017–2019 over three ABoVE regions: Yukon Flats, AK; the Peace-Athabasca Delta, AB; and the Canadian Shield, NWT (Table 1). This land cover classification was developed for a project focusing on potential methane emissions from the shallow near-shore, or littoral, regions of lakes; therefore, the principal focus was on wetlands and lake shorelines (Fig. 2).
 |
 |
Figure 2. Left: Example UAV photo used for interpretation of inundation extent in conjunction with GPS measurements. For scale, the author is barely visible in a canoe on the right edge of the lake below the islet. Right: Field photo showing shoreline measurement method. Field teams walked along the edges of inundated areas (top majority of image) carrying handheld GPS receivers.
The classification process involved creating a training dataset from field observations and remote imagery from 15 sources (Table 6; Fig. 3). Training areas were clustered around locations with convenient field access plus additional areas with available imagery. ArcMap 10.6 was used to trace landscape features at map scales ranging from 1:200–1:1000; these features were 50 m–1 km in length. The delineation of these training polygons was conservative, erring on the side of creating smaller polygons if there was any doubt about its land cover class. Field observations included GPS tracks collected while walking along edges of inundated areas of lakes and wetlands. GPS accuracy was ±5 m. In total, there are 764 training polygons in the dataset with 8 to 116 polygons per class.

Figure 3. Examples of training polygons, labeled by class code (Table 5) and superimposed over the 13-class preliminary map. Location: Lymon Lake, Peace-Athabasca Delta, AB, Canada. Source: padelt_training_2018.zip, padelt_189821_mosaic_cls.tif
The analysis used a Random Forests supervised classification applied to two polarimetric decomposition methods: (a) The Freeman-Durden (FD) polarimetric decomposition (Ballester-Berman and Lopez-Sanchez 2010); and (b) The FD decomposition with the addition of a look-up table (LUT) pre-processing workflow (only used for the northern Canadian Shield scenes). The stand-alone FD method had the best predictive power at incidence angles greater than 28.6° (0.5 rad), so these resulting files are cropped accordingly. The incidence angle on native UAVSAR scenes before cropping ranged from about 16.6° (0.29 rad) to 80.2° (1.40 rad); therefore, about 2 km was cropped off the near-range edge of each image to eliminate incident angles <28.6°.

Figure 4. The final 5-class map for Yukon Flats near Ft. Yukon, AK. Clipping to a minimum incidence angle produces “fuzzy” edges on the near-range sides caused by topography (top left). Source: yflats_170621_mosaic_rcls.tif
The preliminary results mapped 13 cover classes (Fig. 1), but some of them were inseparable, resulting in 8 unique classes. These data were revised to produce a final version with 5 distinct classes (Table 2; Fig. 4). All missing data was over open water, and these gaps were filled. The overall accuracy of the final classification was 84.1% for the Freeman-Durden model and 87.4% for the model with the additional LUT method. The classes Rough Water (RW) and Bank Scarp Double-Bounce (BS) (Table 5) were dependent on precise radar geometry and water wave conditions, so they are not relevant for the classification of other remote sensing images. The classes Wet Herbaceous (WH) and Sedimentary Bar (SB) were not separable from Open Water (OW) due to a lack of training samples.
For visualization and analysis, the authors recommend that the classes Wet Herbaceous (WH), Rough Water (RW), and Sedimentary Bar (SB) be lumped with Open Water (OW), since they are not separable due to limited training samples. Bank Scarp Double-Bounce (BS) should be lumped with Dry Forest (DF) since their distinction depends solely on radar viewing angle.
Data Access
These data are available through the Oak Ridge National Laboratory (ORNL) Distributed Active Archive Center (DAAC).
ABoVE: Lake and Wetland Classification from L-band SAR, Alaska and Canada, 2017-2019
Contact for Data Center Access Information:
- E-mail: uso@daac.ornl.gov
- Telephone: +1 (865) 241-3952
References
Ballester-Berman, J. D. and J. M. Lopez-Sanchez. 2010. Applying the Freeman–Durden Decomposition Concept to polarimetric SAR interferometry. IEEE Transactions on Geoscience and Remote Sensing 48:466-479. https://doi.org/ 10.1109/TGRS.2009.2024304
Bourgeau-Chavez, L. L., S. Endres, R. Powell, M. J. Battaglia, B. Benscoter, M. Turetsky, E. S. Kasischke, and E. Banda. 2017. Mapping boreal peatland ecosystem types from multi-temporal radar and optical satellite imagery. Canadian Journal of Forest Research 47:545-559. https://doi.org/10.1139/cjfr-2016-0192
Bourgeau-Chavez, L. L., J. A. Graham, S. Endres, N. H. F. French, M. Battaglia, D. Hansen, and D. Tanzer. 2019. ABoVE: Ecosystem Map, Great Slave Lake Area, Northwest Territories, Canada, 1997-2011. ORNL DAAC, Oak Ridge, Tennessee, USA. https://doi.org/10.3334/ORNLDAAC/1695
Kyzivat, E. D., L. C. Smith, L. H. Pitcher, J. V. Fayne, S. W. Cooley, M. G. Cooper, S. Topp, T. Langhorst, M. E. Harlan, C. J. Gleason, and T.M. Pavelsky. 2019a. ABoVE: AirSWOT Water Masks from Color-Infrared Imagery over Alaska and Canada, 2017. ORNL DAAC, Oak Ridge, Tennessee, USA. https://doi.org/10.3334/ORNLDAAC/1707
Kyzivat, E. D., L. C. Smith, L. H. Pitcher, J. V. Fayne, S. W. Cooley, M. G. Cooper, S. N. Topp, T. Langhorst, M. E. Harlan, C. Horvat, C. J. Gleason, and T. M. Pavelsky. 2019b. A high-resolution airborne color-infrared camera water mask for the NASA ABoVE Campaign. Remote Sensing 11:2163. https://doi.org/10.3390/rs11182163
NASA. 2015. Polarimetric (PolSAR) Data Format: UAVSAR data format for polarimetric products. NASA Jet Propulsion Laboratory, Pasadena, CA, USA. https://uavsar.jpl.nasa.gov/science/documents/polsar-format.html
NASA. 2020. UAVSAR Data Search, NASA. 2017-2019. NASA Jet Propulsion Laboratory, Pasadena, CA, USA. https://uavsar.jpl.nasa.gov/cgi-bin/data.pl
Wang, J.A., D. Sulla-Menashe, C.E. Woodcock, O. Sonnentag, R.F. Keeling, and M.A. Friedl. 2019. ABoVE: Landsat-derived Annual Dominant Land Cover Across ABoVE Core Domain, 1984-2014. ORNL DAAC, Oak Ridge, Tennessee, USA. https://doi.org/10.3334/ORNLDAAC/1691
Wang, J. A., D. Sulla-Menashe, C. E. Woodcock, O. Sonnentag, R. F. Keeling, and M. A. Friedl. 2020. Extensive land cover change across arctic–boreal northwestern North America from disturbance and climate forcing. Global Change Biology 26: 807-822. https://doi.org/10.1111/gcb.14804