Documentation Revision Date: 2022-09-22
Dataset Version: 1
Summary
There are two complementary sets of data files provided with the data set -- 158 files total. There are 79 files in the ABoVE standard projection and 79 files in the WGS 84 reference system. Both include inundation coverage and inundation frequency maps in GeoTIFF (.tif) format for the PAD site and Yukon Flats sites, and shapefiles (.shp) of the two study site footprints as .zip files. For each study site, there is also a companion file in .kmz format with the footprint data for viewing in Google Earth.
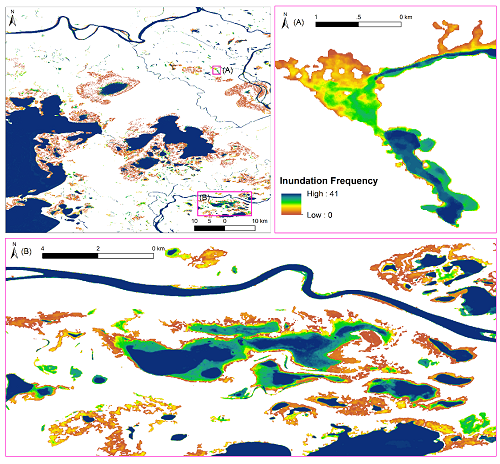
Figure 1. 2017-2019 inundation frequency of the Peace-Athabasca Delta, Canada. From Huang et al., 2021.
Citation
Huang, C., L.C. Smith, E.D. Kyzivat, J.V. Fayne, and C. Spence. 2021. ABoVE: Wetland Inundation Coverage at Yukon Flats, AK and PA Delta, Canada, 2017-2019. ORNL DAAC, Oak Ridge, Tennessee, USA. https://doi.org/10.3334/ORNLDAAC/1901
Table of Contents
- Dataset Overview
- Data Characteristics
- Application and Derivation
- Quality Assessment
- Data Acquisition, Materials, and Methods
- Data Access
- References
Dataset Overview
This dataset provides time series of wetland inundation coverage maps and corresponding inundation frequency maps at ~10-meter resolution estimated every 12 days during the free-water period (May to October) for the years 2017-2019 over the Yukon Flats (YK) portion of the Yukon River, Alaska, USA, and the Peace-Athabasca Delta (PAD), Alberta, Canada. Wetland inundation coverage was determined by a two-step modified decision-tree classification approach that first used Sentinel-1 C-band SAR to identify likely inundated areas across a study site and was followed by a decision-tree classification step with C-band SAR backscatter statistics thresholds to distinguish among different inundation components. The result of this process was five classes for each inundation map, namely Open Water (OW), Floating Plants (FP), Emergent Plants (EP), Flooded Vegetation (FV), and Dry Land (DRY). After all the individual (every 12 days) inundation coverage maps were derived for a study site, they were generalized to two-class maps which maintained only inundation status. These generalized maps were then stacked and summarized to produce the inundation frequency map for the site. In these maps, higher values signify more frequently inundated areas, with the maximum value representing permanently inundated pixels. The Sentinel-1 inundation mapping capability demonstrated here provided frequent, broad-scale mapping of different wetland inundation components. Integration of such products with process-based methane (CH4) models would improve simulation of CH4 emissions from wetlands.
Project: Arctic-Boreal Vulnerability Experiment
The Arctic-Boreal Vulnerability Experiment (ABoVE) is a NASA Terrestrial Ecology Program field campaign being conducted in Alaska and western Canada, for 8 to 10 years, starting in 2015. Research for ABoVE links field-based, process-level studies with geospatial data products derived from airborne and satellite sensors, providing a foundation for improving the analysis, and modeling capabilities needed to understand and predict ecosystem responses to, and societal implications of, climate change in the Arctic and Boreal regions.
Related Publication:
Huang, C., L.C. Smith, E.D. Kyzivat, J.V. Fayne, Y. Ming, and C. Spence. 2022. Tracking transient boreal wetland inundation with Sentinel-1 SAR: Peace-Athabasca Delta, Alberta and Yukon Flats, Alaska. GIScience & Remote Sensing. Under review.
Acknowledgements:
This work was funded by NASA ABoVE with grant number 80NSSC19M0104 and NASA Terrestrial Hydrology Program with grant number 80NSSC20K0429.
Data Characteristics
Spatial Coverage: Yukon Flats portion of the Yukon River, Alaska, USA, and the Peace-Athabasca Delta, Alberta, Canada.
ABoVE Reference Locations
Domain: Core ABoVE
State/Territory: Alaska and Canada
Grid cells (5-m):
| Ch46Cv29 | Ch46Cv30 | Ch46Cv31 | Ch47Cv29 | Ch47Cv30 | Ch47Cv31 |
| Ch82Cv82 | Ch82Cv83 | Ch83Cv80 | Ch83Cv81 | Ch83Cv82 | Ch83Cv83 |
| Ch84Cv80 | Ch84Cv81 | Ch84Cv82 | Ch84Cv83 | ||
Spatial Resolution: ~10-m (0.0000898 degree)
Temporal Coverage: 2017-05-21 to 2019-10-26
Temporal Resolution: 12 days
Site Boundaries: Latitude and longitude are given in decimal degrees.
| Site | Westernmost Longitude | Easternmost Longitude | Northernmost Latitude | Southernmost Latitude |
|---|---|---|---|---|
| Yukon Flats, AK and Peace-Athabasca Delta, CA | -146.430001 | -110.914999 | 66.810701 | 58.246399 |
Data File Information
There are two complementary sets of data files provided with the data set. There are 79 files in the ABoVE standard projection and 79 files in the WGS 84 reference system. A total of 158 files.
Each set of 79 files includes:
- 41 inundation coverage files in GeoTIFF (.tif) format for the PAD site -- every 12 days in the free-water period (May to October) for the years 2017-2019
- 34 inundation coverage .tif files for the Yukon Flats site -- every 12 days in the free-water period (May to October) for the years 2017-2019
- 2 inundation frequency .tif files -- one for the PAD site and one for the Yukon Flats site
- 2 shapefiles (.shp) of the study site footprints as .zip files -- one for the PAD site and one for the Yukon Flats site
Companion File Information
For each study site, there is one companion file in .kmz format with the study site footprint data for viewing in Google Earth. Companion files must be downloaded separately from the data files.
Table 1. File names and descriptions
Note that files in the ABoVE projection contain "ABoVE_proj" in the file name.
SITE = PAD or YUKON, and YYYY-MM-DD = Year (2017 to 2019), month, and day
| File name | Description |
|---|---|
| Inundation Coverage | |
| SITE_Inundationmap-YYYY-MM-DD.tif | Inundation coverage maps named by site, year-month-day. There are 41 maps for PAD and 34 for Yukon every 12 days during the free-water period (May to October) for the years 2017-2019. EPSG: 4326 |
| SITE_Inundationmap_ABoVE_proj-YYYY-MM-DD.tif |
Inundation coverage maps named by site, year-month-day. There are 41 maps for PAD and 34 for Yukon every 12 days during the free-water period (May to October) for the years 2017-2019. In ABoVE projection EPSG: 102001 |
| Inundation Frequency | |
| SITE-Inundationfrequency.tif | Inundation frequency maps for each site. EPSG: 4326 |
| SITE-Inundationfrequency_ABoVE-proj.tif | Inundation frequency maps for each site in the ABoVE projection. In ABoVE projection EPSG: 102001 |
| Site Footprints | |
|
SITE_footprint.zip |
Site footprints in .shp (shapefile) format, one for each site, provided in .zip files. EPSG: 4326 |
| SITE_footprint_ABoVE_proj.zip | Site footprints in .shp (shapefile) format for the ABoVE projection, one for each site, provided in .zip files. In ABoVE projection EPSG: 102001 |
| Companion files | |
| SITE_footprint.kmz | Two kmz files (footprint shapefile data) for viewing in Google Earth; one for each site |
Properties of the GeoTIFF files -- EPSG: 4326:
CRS: EPSG 4326 (GCS_WGS_1984)
Datum: WGS 84
Unit: Degree
Bands: 1
No data values:
All Inundation map files: 255
Two Inundation frequency files: 255
Properties of the GeoTIFF files -- ABoVE Projection:
CRS: Canada_Albers_Equal_Area_Conic, NAD83
ABoVE standard projection: EPSG 102001
Datum: North American Datum 1983
Unit: Degree
Bands: 1
No data value:
All Inundation map files: 15
Two Inundation frequency files: -128
Attributes of all GeoTIFF files:
Inundation Coverage
Pixel Value: 0-4 for inundation coverage
Table 2: Values and corresponding classes on the wetland inundation maps.
| Value | Code | Class |
| 0 | DRY | Dry land |
| 1 | OW | Open Water |
| 2 | FP | Floating Plants |
| 3 | EP | Emergent Plants |
| 4 | FV | Flooded Vegetation |
Inundation Frequency
For the inundation frequency maps, the pixel value denotes the number of times a pixel was inundated over all available observations.
- As there are 41 observations for the PAD, the inundation frequency map of PAD will have values from 0-41.
- For Yukon, the value range is 0-34.
A value of 0 means that this pixel was never detected as inundated, a value of 1 means that this pixel was detected as inundated once among all the available observations. A pixel with the maximum site value was permanently inundated.
Application and Derivation
The Sentinel-1 inundation mapping capability demonstrated here provides frequent, broad-scale mapping of different wetland inundation components. Integration of such products with process based CH4 models would improve simulation of CH4 emissions from ABR wetlands (Huang et al., 2022).
Quality Assessment
The classification accuracy was assessed using a standard confusion matrix, with field mapping surveys in 213 and 195 distributed locations within the YF and PAD respectively (Kyzivat et al., 2021). Field mappings were collected within 3 days of the input Sentinel-1 image, which were obtained with assistance from several other data sources (Bourgeau-Chavez et al., 2019, 2017; Kyzivat et al., 2019a, 2019b; Wang et al., 2019a, 2019b). Overall classification accuracy for the PAD and Yukon Flats is 93.15% and 92.04%, respectively (Figure 2). While this suggests that Sentinel-1 wetland mapping yields overall high accuracy, it is important to note that dry land has >98% accuracy and makes up over 69% of the study domain. For the open water class, omission errors are more common than commission errors, suggesting that the proposed method is conservative. For the inundated vegetation, omission error (33.33%) is higher than commission error (20.22%) for the PAD. commission and omission errors for Yukon Flats resemble those of the PAD, with values of 30.83% and 23.85%, respectively.
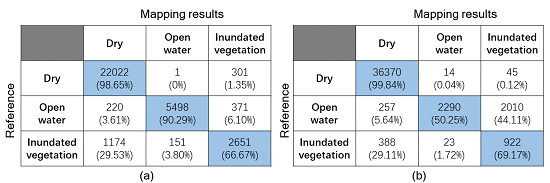
Figure 2. Confusion matrices for (a) PAD, and (b) Yukon Flats. Percentages in the parentheses stand for producer’s accuracy. (Huang et al., 2022).
Data Acquisition, Materials, and Methods
Study sites
Two study areas having extensive wetlands were selected for study, the Peace-Athabasca Delta (PAD) in northern Alberta, Canada and the Yukon Flats in north-central Alaska, USA (Figure 3, and black rectangles, Figure 1). The PAD is the world’s largest inland boreal delta, a Ramsar Wetland of International Importance, and part of a UNESCO World Heritage Site. The Yukon Flats is a lake-rich lowland found along a ~100 km low-gradient, and a branching section of Yukon River. Many wetlands are present in the area, interspersed with several tributaries and abundant lakes.
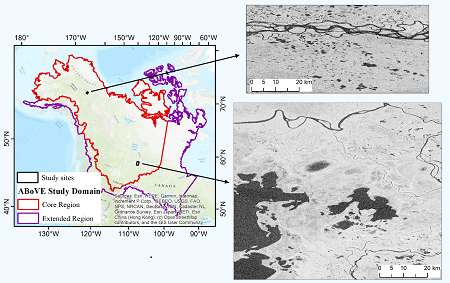
Figure 3. Two study sites (the Peace-Athabasca Delta (PAD) and the Yukon Flats) in the ABoVE domain, displayed with their Sentinel-1 VH backscatter images. From Huang et al., 2022.
The individual inundation maps (Figure 1) were created by a modified decision-tree method that is implemented with Google Earth Engine. It is a two-step inundation mapping methodology aiming to map both open water and inundated vegetation from time series of Sentinel-1 images. The first step tries to estimate maximum inundation extent over some range of time (here 2017-2019), which, once determined, is then employed to constrain the second step (i.e. single scene) of wetland inundation mapping. Inundated vegetation in wetlands may be subdivided into two categories, perennially inundated aquatic vegetation and temporarily flooded vegetation. Aquatic vegetation (AV) can be further divided into three classes, emergent plants (EP), floating plants (FP) and submerged plants (SP). Since SP grows underneath the water surface, they are not observable with SAR, so this class is hereafter ignored. Therefore, including the Dry land (DRY), there are in total five classes (OW, FP, EP, FV, DRY) in the inundation map (Table 2).
To ensure constancy in incidence angles for each pixel, only repeat-pass Sentinel-1 data collected by the same descending orbit tracks were used. There are seven threshold values that are used in the decision-tree method, three of them are determined manually, and require trial-and-error testing to achieve better results. Four are determined automatically. After all the individual inundation maps are derived, they are then generalized to two-class maps which maintain only inundation status. These generalized maps are then stacked to produce the inundation frequency map. In this map, higher values signify more frequently inundated areas, with the maximum value representing permanently inundated pixels.
Refer to Huang et al. (2022, under review) for additional details.
Data Access
These data are available through the Oak Ridge National Laboratory (ORNL) Distributed Active Archive Center (DAAC).
ABoVE: Wetland Inundation Coverage at Yukon Flats, AK and PA Delta, Canada, 2017-2019
Contact for Data Center Access Information:
- E-mail: uso@daac.ornl.gov
- Telephone: +1 (865) 241-3952
References
Bourgeau-Chavez, L.L., J.A. Graham, S. Endres, N.H.F. French, M. Battaglia, D. Hansen, and D. Tanzer. 2019. ABoVE: Ecosystem Map, Great Slave Lake Area, Northwest Territories, Canada, 1997-2011. ORNL DAAC, Oak Ridge, Tennessee, USA. https://doi.org/10.3334/ORNLDAAC/1695
Bourgeau-Chavez, L.L., S. Endres, R. Powell, M.J. Battaglia, B. Benscoter, M. Turetsky, E.S. Kasischke, E. Banda. 2017. Mapping Boreal Peatland Ecosystem Types from Multi-Temporal Radar and Optical Satellite Imagery. Canadian Journal of Forest Research, 47(4): 545-559, https://doi.org/10.1139/cjfr-2016-0192
Huang, C., L.C. Smith, E.D. Kyzivat, J.V. Fayne, Y. Ming, and C. Spence. 2022. Tracking transient boreal wetland inundation with Sentinel-1 SAR: Peace-Athabasca Delta, Alberta and Yukon Flats, Alaska. GIScience & Remote Sensing. Under review.
Kyzivat, E.D., L.C. Smith, C. Huang, C. Wang, T. Langhorst, J.V. Fayne, M.E. Harlan, Y. Ishitsuka, D. Feng, L.H. Pitcher, and T.M. Pavelsky. 2021. ABoVE: Lake and wetland classification from UAVSAR L-band over three regions. ORNL DAAC, Oak Ridge, Tennessee, USA (In process). https://doi.org/10.3334/ORNLDAAC/1883
Kyzivat, E.D., L.C. Smith, L.H. Pitcher, J.V. Fayne, S.W. Cooley, M.G. Cooper, S. Topp, T. Langhorst, M.E. Harlan, C.J. Gleason, and T.M. Pavelsky. 2019a. ABoVE: AirSWOT Water Masks from Color-Infrared Imagery over Alaska and Canada, 2017. ORNL DAAC, Oak Ridge, Tennessee, USA. https://doi.org/10.3334/ORNLDAAC/1707
Kyzivat, E.D., Smith, L.C., Pitcher, L.H., Fayne, J.V., Cooley S.W., Cooper, M.G., Topp, S.N. et al. 2019b. A High-Resolution Airborne Color-Infrared Camera Water Mask for the NASA ABoVE Campaign. Remote Sensing 11: 1–28. https://doi.org/10.3390/rs11182163.
Wang, J.A., D. Sulla-Menashe, C.E. Woodcock, O. Sonnentag, R.F. Keeling, and M.A. Friedl. 2019a. ABoVE: Landsat-derived Annual Dominant Land Cover Across ABoVE Core Domain, 1984-2014. ORNL DAAC, Oak Ridge, Tennessee, USA. https://doi.org/10.3334/ORNLDAAC/1691
Wang, Jonathan A., Damien Sulla-Menashe, Curtis E. Woodcock, Oliver Sonnentag, Ralph F. Keeling, and Mark A. Friedl. 2019b. “Extensive Land Cover Change across Arctic–Boreal Northwestern North America from Disturbance and Climate Forcing.” Global Change Biology 00: 1–16. https://doi.org/10.1111/gcb.14804.