Documentation Revision Date: 2022-11-17
Dataset Version: 1
Summary
This dataset includes 247 files in Cloud-Optimized GeoTIFF (*.tif) format.
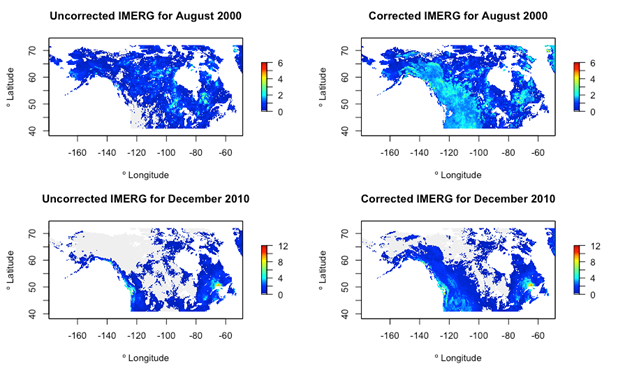
Figure 1. Two examples of uncorrected and corrected months Canada-Alaska domain. The correction is applied to pixels > 500 m, so the correction is seen primarily in mountainous areas. Figure from Lober et al. (in review).
Citation
Lober, C., and J.V. Fayne. 2022. ABoVE: Bias-Corrected IMERG Monthly Precipitation for Alaska and Canada, 2000-2020. ORNL DAAC, Oak Ridge, Tennessee, USA. https://doi.org/10.3334/ORNLDAAC/2097
Table of Contents
- Dataset Overview
- Data Characteristics
- Application and Derivation
- Quality Assessment
- Data Acquisition, Materials, and Methods
- Data Access
- References
Dataset Overview
Dataset Overview
This dataset is a modification to the Integrated Multi-satellitE Retrievals for GPM (IMERG) Final Run microwave-only, daily precipitation Version 06 data. It provides bias-corrected IMERG monthly precipitation data for Alaska and Canada from June 2000 through December 2020 in Cloud-Optimized GeoTIFF (*.tif) format. Data are provided in the units of mm/day. NASA's IMERG data product is one of the most advanced satellite precipitation products with a 0.1-degree spatial resolution and near global coverage. This dataset bias-corrected IMERG's HQprecipitation precipitation estimates, which are based on passive microwave (PMW)-only retrievals, using a linear regression method. This method utilizes empirical measurements from rain gauge stations from the Global Historical Climatology Network (GHCN) and a digital elevation model. This bias correction approach improves estimates at elevations above 500 m a.s.l., which are typically underestimated.
Project: ABoVE
The Arctic-Boreal Vulnerability Experiment (ABoVE) is a NASA Terrestrial Ecology Program field campaign being conducted in Alaska and western Canada, for 8 to 10 years, starting in 2015. Research for ABoVE links field-based, process-level studies with geospatial data products derived from airborne and satellite sensors, providing a foundation for improving the analysis, and modeling capabilities needed to understand and predict ecosystem responses to, and societal implications of, climate change in the Arctic and Boreal regions.
Related Publication:
Lober, C., J. Fayne, and L.C. Smith. 2022. Bias Correction of 20 years of IMERG Satellite Precipitation Data over Canada and Alaska. In review.
Data Characteristics
Spatial Coverage: Alaska, USA and Canada
Spatial Resolution: 0.1-degree x 0.1-degree
Temporal Coverage: June 2000 to December 2020
Temporal Resolution: Monthly
Study Areas: Latitude and longitude are given in decimal degrees.
| Site | Westernmost Longitude | Easternmost Longitude | Northernmost Latitude | Southernmost Latitude |
|---|---|---|---|---|
| Alaska, USA and Canada | -179.30 | -48.50 | 72.00 | 40.80 |
Data File Information
Data are presented as georeferenced Cloud-Optimized GeoTIFF (*.tif) files for 247 months from June 2000 to December 2020. Files contain bias-corrected IMERG-estimated measurements of precipitation in units of mm/day averaged over the specified month.
The files are named CanAK_IMERG_01_YYYYMM.tif; where ‘01’ is the version number and ‘YYYYMM’ is the date (e.g. ‘200006’ for June 2000).
No data value: -3.4e+38
Application and Derivation
Precipitation is a critical part of the global water cycle and is highly variable over time, which complicates its measurement. Satellite precipitation products (SPPs) offer global or near-global coverage, but suffer from known biases and missing data related to topography, season, precipitation intensity, and satellite orbit (Maggioni et al., 2016). Bias correction of SPPs can improve their accuracy and utility in modeling applications where precipitation data is needed (Hinge et al., 2022; Setti et al., 2020; Wang et al., 2020). Bias correction studies for high latitudes are limited, in part due to limitations in the spatial coverage of SPPs. IMERG is the first SPP to offer coverage poleward of 60º N/S; however, its calibrated product lacks consistent coverage at these high latitudes. To our knowledge, our study is the first to perform an elevation-based evaluation and bias correction on IMERG’s Final Run data in Canada and Alaska for the full 20 years of IMERG data availability (new with IMERG version 06). Our aim is to produce an improved, high-coverage satellite precipitation dataset for Canada and Alaska for hydrologic applications.
To produce this data, we derive a bias correction based on monthly linear regressions between bias and elevation. The IMERG data are evaluated using rain gauge records from the Global Historical Climatology Network (GHCN; Menne et al., 2012) with auxiliary environmental data from a digital elevation model (DEM; Yamazaki et al., 2017). Rain gauges are grouped into geographically and climatologically similar clusters to be compared with the 10 km resolution IMERG data. Monthly linear relationships between elevation and bias for each domain are derived and applied to each domain using the DEM to create a final bias-corrected dataset.
Quality Assessment
These bias-corrected IMERG data improves the absolute bias, relative bias, root-mean-square error (RMSE), and mean absolute error (MAE) by 16%, 34.7%, 5.5%, and 6.1%, respectively, in comparison with an uncorrected IMERG HQprecipitation data. When considering high elevations above 500 m a.s.l., the bias-corrected IMERG data improves absolute bias, relative bias, RMSE, and MAE by 44%, 81%, 15%, and 17%, respectively. For additional details see Lober et al. (in review).
Data Acquisition, Materials, and Methods
This dataset is a modification to IMERG Final Run microwave-only, daily precipitation Version 06 data (Huffman et al., 2019) from June 1, 2000 to December 31, 2020. The analysis performed is described in Lober et al. (in review). 4,011 rain gauge stations from the Global Historical Climatology Network (GHCN) were used as ground-truth data to assess the IMERG data. A linear regression between bias and elevation were derived and applied to the full extent of the data using the Multi-Error Removed Improved Terrain digital elevation model (MERIT DEM) (Yamazaki et al., 2017) resampled to match the 10-km IMERG pixels.
GHCN climatological stations (Menne et al., 2012) were clustered geospatially and by precipitation quantiles to create groups of geographically and climatically similar stations and to facilitate comparison between the station measurements and gridded IMERG data using hierarchical clustering. First, geographic (latitude, longitude, elevation) and climatic (50th and 75th percentiles of precipitation values) variables for each station were standardized to have a mean of 0 and standard deviation of 1. Standardization adjusts for the effect of scale of the variables on the clustering analysis. The standardized variables representing latitude and longitude were multiplied by two to increase their relative weight and prioritize geographic proximity. The agglomerative nesting hierarchical clustering method from the “agnes” R package was run on the five geographic and climatic factors as described in (Kaufman and Rosseeuw, 1990).
Concave hull polygons surrounding the stations in each cluster were made to extract the IMERG data using an iterative buffering-reducing process as follows. First, circular buffers of 100 km were created around each individual station within a cluster and then dissolved, to enclose all stations within a single cluster perimeter polygon. Next, the cluster polygon was inwardly buffered, or reduced, by 90 km to create a polygon closely fitted to all stations in that cluster. IMERG data were then averaged within the buffered hull and the final value evaluated against the average of station values within the cluster.
A linear regression between bias and elevation of the clusters was calculated for each month of the year, then applied to the original gridded IMERG data for the full study area. Mean bias for each station cluster for each of the twelve months was plotted against mean elevation for each station cluster. A linear model was fit to the data according to the relationship observed. The slope and intercept of the regression lines were used to calculate a monthly additive correction for the whole scene using the MERIT DEM resampled to match IMERG pixels. For DEM cell values falling outside the domain of average elevation of the clusters, the correction corresponding to the nearest end of the domain was used (i.e., the same magnitude of correction was applied to every pixel above 2926 m, the highest average cluster elevation). The monthly corrections were then added to the original IMERG satellite precipitation data to create the final, bias-corrected monthly product, and the same evaluation metrics as described above applied to assess the performance of the corrected monthly IMERG product.
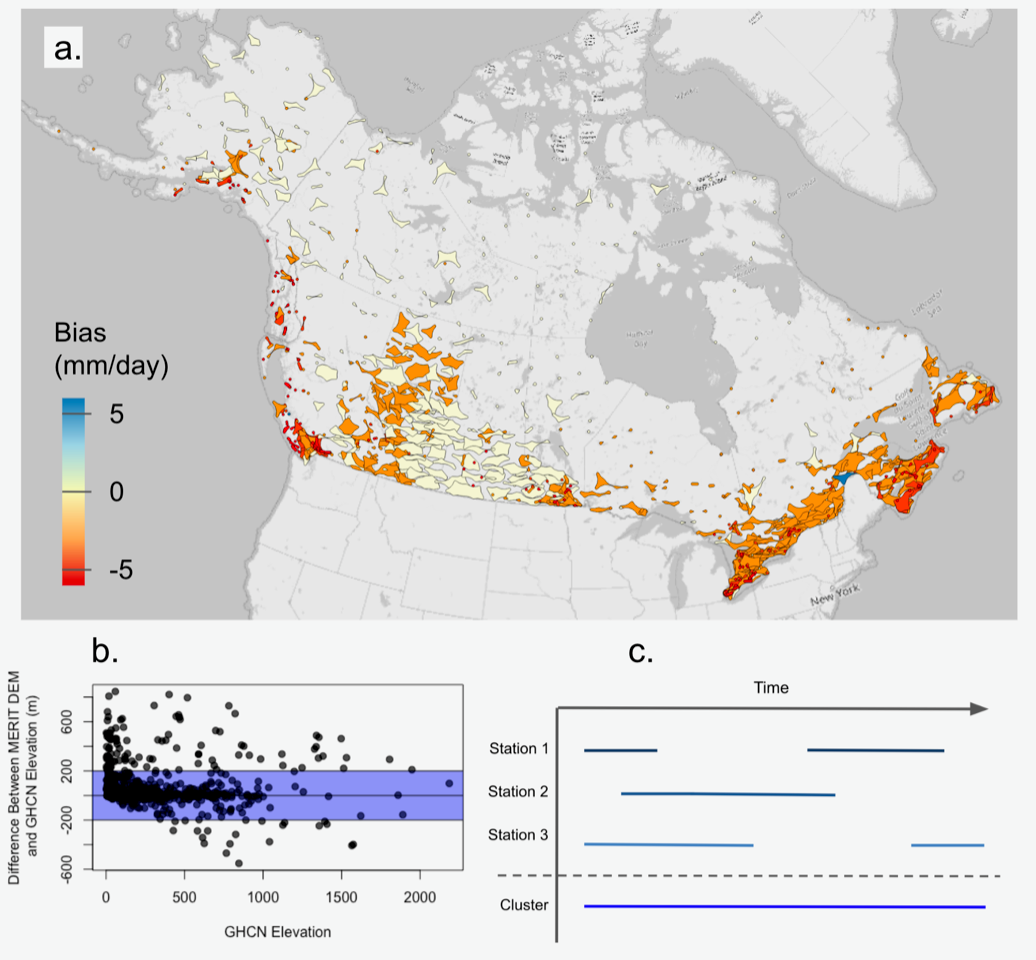
Figure 2. a) This map shows the 750 clusters created for the full Canada and Alaska domain, colored by the average bias at each cluster. The red colors show that clusters with higher bias (greater underestimation) tend to be located along the Pacific Coast, Atlantic Coast, southern Ontario and Quebec, and along the Rockies. b) The difference between average elevation reported by the GHCN stations in the cluster and the MERIT DEM averaged over the polygon. Because we are interested in bias related to elevation, we only consider the clusters that agree to within 200 m (highlighted in blue). c) Schematic showing the impact of clustering GHCN stations on the temporal coverage of those clusters versus the original stations. Figure from Lober et al. (in review).
Data Access
These data are available through the Oak Ridge National Laboratory (ORNL) Distributed Active Archive Center (DAAC).
ABoVE: Bias-Corrected IMERG Monthly Precipitation for Alaska and Canada, 2000-2020
Contact for Data Center Access Information:
- E-mail: uso@daac.ornl.gov
- Telephone: +1 (865) 241-3952
References
Hinge, G., Hamouda, M. A., Long, D., & Mohamed, M. M. (2022). Hydrologic utility of satellite precipitation products in flood prediction: A meta-data analysis and lessons learnt. Journal of Hydrology, 612, 128103. https://doi.org/10.1016/j.jhydrol.2022.128103
Huffman, G.J., E.F. Stocker, D.T. Bolvin, E.J. Nelkin, and J. Tan. 2019. GPM IMERG Final Precipitation L3 1 day 0.1 degree x 0.1 degree, V06. Goddard Earth Sciences Data and Information Services Center (GES DISC), Greenbelt, Maryland. https://doi.org/10.5067/GPM/IMERGDF/DAY/06
Kaufman, L. and P .Rosseeuw. 1990. Agglomerative Nesting (Program AGNES). Pp. 199-152 in L. Kaufman and P. Rosseeuw (eds). Finding Groups in Data. John Wiley & Sons, Ltd. https://doi.org/10.1002/9780470316801.ch5
Lober, C., J. Fayne, and L.C. Smith. 2022. Bias Correction of 20 years of IMERG Satellite Precipitation Data over Canada and Alaska. In review.
Maggioni, V., Meyers, P. C., & Robinson, M. D. (2016). A Review of Merged High-Resolution Satellite Precipitation Product Accuracy during the Tropical Rainfall Measuring Mission (TRMM) Era. Journal of Hydrometeorology, 17(4), 1101–1117.https://doi.org/10.1175/JHM-D-15-0190.1
Menne, M.J., I. Durre, R.S. Vose, B.E. Gleason, and T.G. Houston. 2012. An Overview of the Global Historical Climatology Network-Daily Database. Journal of Atmospheric and Oceanic Technology 29:897–910. https://doi.org/10.1175/JTECH-D-11-00103.1
Setti, S., Maheswaran, R., Sridhar, V., Barik, K. K., Merz, B., & Agarwal, A. (2020). Inter-Comparison of Gauge-Based Gridded Data, Reanalysis and Satellite Precipitation Product with an Emphasis on Hydrological Modeling. Atmosphere, 11(11), Article 11.https://doi.org/10.3390/atmos11111252
Wang, N., Liu, W., Sun, F., Yao, Z., Wang, H., & Liu, W. (2020). Evaluating satellite-based and reanalysis precipitation datasets with gauge-observed data and hydrological modeling in the Xihe River Basin, China. Atmospheric Research, 234, 104746.https://doi.org/10.1016/j.atmosres.2019.104746
Yamazaki, D., D. Ikeshima, R. Tawatari, T. Yamaguchi, F. O’Loughlin, J.C. Neal, C.C. Sampson, S. Kanae, and P.D. Bates. 2017. A high-accuracy map of global terrain elevations. Geophysical Research Letters 44:5844–5853. https://doi.org/10.1002/2017GL072874