Documentation Revision Date: 2021-03-11
Dataset Version: 1
Summary
These data can be used in spatial and temporal analyses related to identifying lake locations, the appearance and disappearance of lakes, and changes in lake area owing to thermokarst. The locations and size of these thermokarst lakes are related to the freeze and thaw dynamics of permafrost in this region.
There are 4 shapefiles bundles in compressed (*.zip) format provided in this dataset.
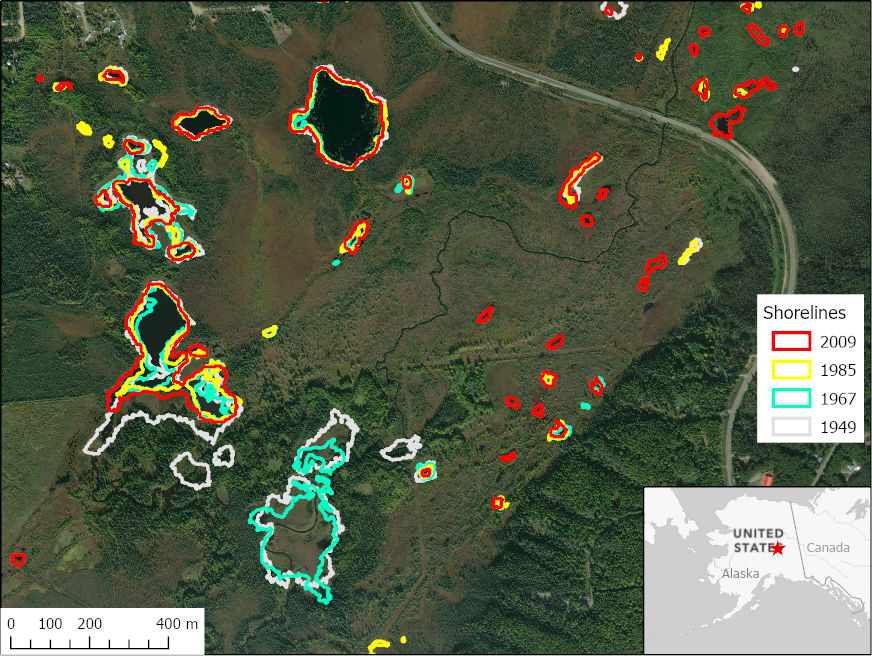
Figure 1. Shorelines of lakes northwest of Fairbanks, AK, over a 60 year period mapped from aerial photographs and satellite imagery. Notice the shoreline shift.
Citation
Anthony, K.W., and P. Lindgren. 2021. ABoVE: Historical Lake Shorelines and Areas near Fairbanks, Alaska, 1949-2009. ORNL DAAC, Oak Ridge, Tennessee, USA. https://doi.org/10.3334/ORNLDAAC/1859
Table of Contents
- Dataset Overview
- Data Characteristics
- Application and Derivation
- Quality Assessment
- Data Acquisition, Materials, and Methods
- Data Access
- References
Dataset Overview
This dataset includes maps of historical lake shorelines with derived lake areas in the southern portion of the Goldstream Valley and the surrounding landscape north of Fairbanks, Alaska, USA. Historical lake margins were mapped for 1949, 1967, and 1985 using 1 m aerial photographs available through U.S. Geological Survey Earth Explorer, and for 2009 using 2.5 m SPOT satellite image mosaics. The study area was a 214 km2 area of Pleistocene-aged yedoma permafrost in the southern portion of the Goldstream Valley. An increasing number of thermokarst lakes and ponds, from 130–275 per year, were identified over the entire study period. Anthropogenic lakes, formed by mining peat, gravel, and gold concentrated in the northwestern extent of Goldstream Valley, were excluded.
These data can be used in spatial and temporal analyses related to identifying lake locations, the appearance and disappearance of lakes, and changes in lake area owing to thermokarst. The locations and size of these thermokarst lakes are related to the freeze and thaw dynamics of permafrost in this region.
Project: Arctic-Boreal Vulnerability Experiment
The Arctic-Boreal Vulnerability Experiment (ABoVE) is a NASA Terrestrial Ecology Program field campaign being conducted in Alaska and western Canada, for 8 to 10 years, starting in 2015. Research for ABoVE links field-based, process-level studies with geospatial data products derived from airborne and satellite sensors, providing a foundation for improving the analysis, and modeling capabilities needed to understand and predict ecosystem responses to, and societal implications of, climate change in the Arctic and Boreal regions.
Related Publication
Walter Anthony, K.M., P. Lindgren, P. Hanke, M. Engram, P. Anthony, R. Daanen, A.C. Bondurant, A.K. Liljedahl, J. Lenz, G. Grosse, B.M. Jones, L. Brosius, S.R. James, B.J. Minsley, N.J. Pastick, J. Munk, J. Chanton, C.E. Miller, and F.J. Meyer. 2020. Decadal-scale hotspot methane ebullition within lakes following abrupt permafrost thaw. Environmental Research Letters 16 035010. http://doi.org/10.1088/1748-9326/abc848
Related Datasets
Anthony, K.W., P. Lindgren, P. Hanke, J. Cherry, and M.J. Engram. 2020. ABoVE: Aerial Photographs of Frozen Lakes near Fairbanks, Alaska, October 2014. ORNL DAAC, Oak Ridge, Tennessee, USA. https://doi.org/10.3334/ORNLDAAC/1845
Anthony, K.W., P. Hanke, and P. Lindgren. 2021. ABoVE: Methane Ebullition Hotspots in Frozen Lakes near Fairbanks, Alaska, 2014. ORNL DAAC, Oak Ridge, Tennessee, USA. https://doi.org/10.3334/ORNLDAAC/1861
Cooley, S.W., L.C. Smith, J.C. Ryan, L.H. Pitcher, and T.M. Pavelsky. 2019. Timeseries of Arctic-Boreal Lake Area Derived from CubeSat Imagery, 2017. ORNL DAAC, Oak Ridge, Tennessee, USA. https://doi.org/10.3334/ORNLDAAC/1667
Du, J., J.S. Kimball, and J.D. Watts. 2016. ABoVE: Fractional Open Water Cover for Pan-Arctic and ABoVE-Domain Regions, 2002-2015. ORNL DAAC, Oak Ridge, Tennessee, USA. https://doi.org/10.3334/ORNLDAAC/1362
User Note: Users can overlay the locations of 21 orthophotograph lakes (dataset 1845) on the shapefiles in the current dataset (1859) to create a cross-reference map. The relationships among three Anthony et al. related datasets are as follows:
- Anthony et al. (2020) (dataset 1845) - high-resolution orthophotographs of 21 lakes in the Goldstream Valley
- Anthony et al. (2021) (current dataset - 1859) - historical and recent lake locations, shorelines, and areas of lakes and ponds across Goldstream Valley
- Anthony et al. (2021) (dataset 1861) - digitized methane hotspot locations in 15 lakes in the Goldstream Valley derived from 15 of the 21 photographed lakes provided in dataset 1845
Acknowledgments
This work was supported by grants from NASA’s ABoVE project (NNX15AU49A) and the National Science Foundation’s Arctic System Science Program (1500931).
Data Characteristics
Spatial Coverage: Goldstream Valley northwest of Fairbanks, AK, USA
ABoVE Reference Locations
Domain: Core
State/Territory: Alaska
Grid cells (3): Ah001v000, Bh006v005, Ch040v032
Spatial Resolution: 1 m
Temporal Coverage: 1949-01-01 to 2019-12-31
Temporal Resolution: Four estimates
Site Boundaries: Latitude and longitude are given in decimal degrees.
| Site | Westernmost Longitude | Easternmost Longitude | Northernmost Latitude | Southernmost Latitude |
|---|---|---|---|---|
| Goldstream Valley, AK | -147.9797 | -147.6600 | 65.9233 | 65.9162 |
Data File Information
There are 4 shapefiles bundles in compressed (*.zip) format provided in this dataset. The shapefiles provide digitized shorelines and other attributes for lakes and ponds across the study area. Files are named Shorelines_Fairbanks_YYYY.tif, where YYYY represents the year the image was collected.
Table 1. File names and descriptions.
| File Name | Imagery Source | Year | Number of Lakes/Ponds |
|---|---|---|---|
| Shorelines_Fairbanks_1949.zip | Aerial photography | 1949 | 131 |
| Shorelines_Fairbanks_1967.zip | Aerial photography | 1967 | 209 |
| Shorelines_Fairbanks_1985.zip | Aerial photography | 1985 | 290 |
| Shorelines_Fairbanks_2009.zip | SPOT satellite | 2009 | 278 |
Data File Details
All files use the CRS "Alaska Albers Equal Area projection" (EPSG:3338).
Table 2. Shapefile attribute names and descriptions. YYYY represents the year of the image.
| Attribute | Units | Description |
|---|---|---|
| YYYY_Ar_Ha | ha | Area in hectares |
| YYYY_Ar_M2 | m2 | Area in square meters |
| YYYY_Stage | A flag indicating whether the lake is “new” or “existing” relative to the previous year | |
| YYYY_WB_Ty | Wetland type: Lake, Pond | |
| L_Size_09 | Category of lake size in 2009: <1 ha or >1 ha | |
| Subregion | Name of subregion of study area | |
| Location | Name of more specific location in study area | |
| Origin | Indicates a "natural" or "anthropogenic" origin for a lake | |
| Yedoma | Whether a lake is located in yedoma permafrost | |
| HS_Anlys | "Yes" or "no" flag related to author’s analysis |
Application and Derivation
These data can be used in spatial analyses related to identifying lake locations and changes in lake area. The locations and size of these thermokarst lakes are related to the freeze and thaw dynamics of permafrost in this region. Moreover, these lakes can be hotspots of methane emissions (Walter Anthony et al., 2020).
Quality Assessment
Shorelines were initially identified from digitized aerial photographs and satellite images by semi-automated image classification based on spectral values. An image enhancement was then applied to further separate bodies of water from surrounding landscape features. The results were manually inspected and edited to remove misclassified objects, such as shadows, streams, and rivers. Lindgren et al. (2016; 2019) provide additional information on image analyses.
Data Acquisition, Materials, and Methods
Study Area
The study area was 214 km2 in size and encompassed thermokarst lakes in the discontinuous permafrost region northwest of Fairbanks, AK, especially the southern region of the Goldstream Valley (Fig. 2). This landscape is characterized by yedoma permafrost and ice wedges covering the valley bottom and north-facing slopes, thermokarst lakes at toe-slopes, and the valley floor, large differences in microclimates between high- and low-elevation areas, and an abundance of wetlands despite relatively low precipitation.
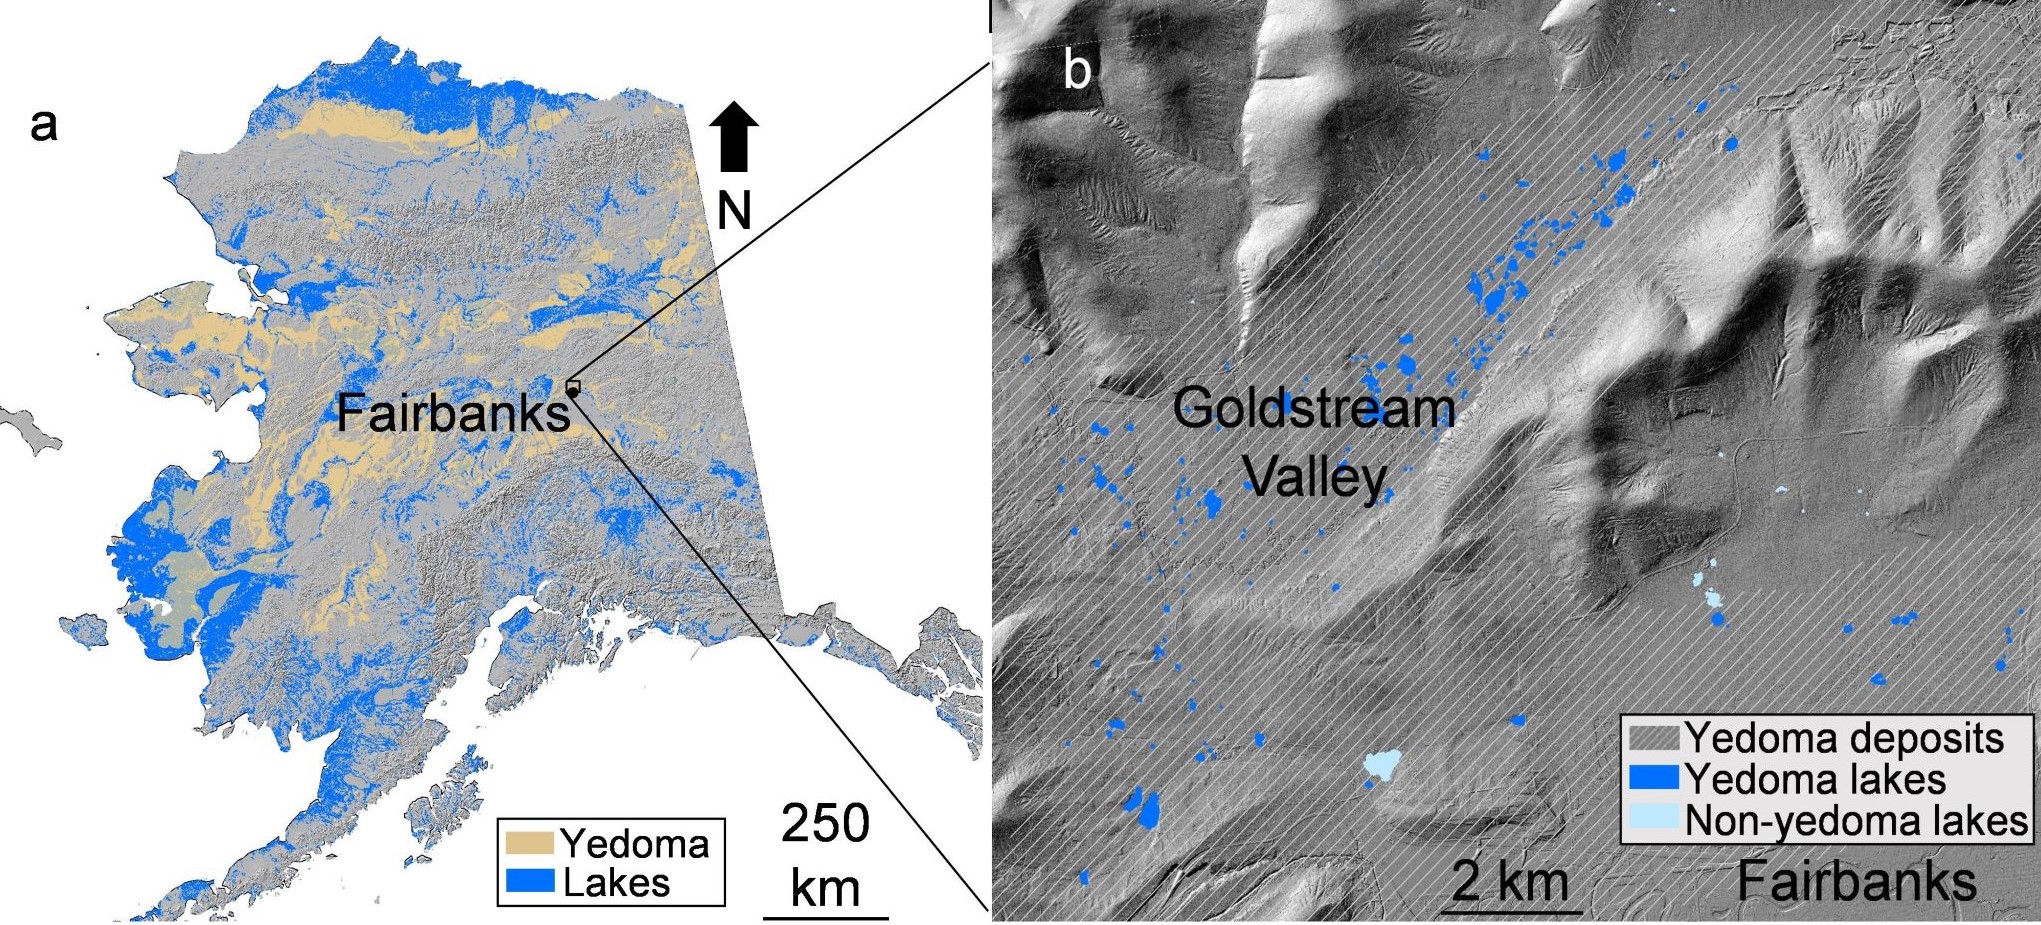
Figure 2. Location of the study area northwest of Fairbanks, Alaska, USA. The map shows (a) yedoma permafrost distribution and (b) yedoma lakes and terrain of the Goldstream Valley. Data sources include Strauss et al. (2016), Alaska LiDAR Dataset (USGS, 2018), Elevation Datasets of Alaska (DGGS Staff, 2013), and Walter Anthony et al. (2020).
Data Sources
Thermokarst lake perimeters were mapped from four observations spanning 60 years (1949–2009). Imagery sources include 1 m resolution aerial photographs acquired in 1949, 1967, and 1985 available through U.S. Geological Survey's Earth Explorer (available at https://pubs.usgs.gov/gip/AerialPhotos_SatImages/aerial.html). For recent lake boundaries, 2.5 m resolution multi-band Satellite Pour l’Observation de la Terre (SPOT) visible and infrared satellite images were acquired in 2009 were used. Images were multispectral, except 1949, which was panchromatic.
Image Processing
First, a semiautomated adaptable mapping solution based on the Object-based Image Analysis technique in the eCognition (version 8) image processing software was used to identify lake margins on both aerial and SPOT images (Lindgren et al., 2019). Next, the lake margins were delineated in the historic images by segmenting them into image objects and classifying the objects based on spectral characteristics. Modern lake margins were delineated from the 2009 SPOT images. SPOT image bands were transformed using principal component analysis to permit the spectral separation of water bodies from the surrounding landscape features. In addition, the Normalized Difference Water Index (McFeeters, 1996) was used to further classify water bodies. Finally, historic and modern water body segments that were not lakes (e.g., streams and rivers) and other spectrally similar misclassified objects (e.g., shadows) were removed through manual editing. More details on the data processing workflows can be found in Lindgren et al. (2016; 2019).
Data Access
These data are available through the Oak Ridge National Laboratory (ORNL) Distributed Active Archive Center (DAAC).
ABoVE: Historical Lake Shorelines and Areas near Fairbanks, Alaska, 1949-2009
Contact for Data Center Access Information:
- E-mail: uso@daac.ornl.gov
- Telephone: +1 (865) 241-3952
References
DGGS Staff. 2013. Elevation Datasets of Alaska. Alaska Division of Geological & Geophysical Surveys Digital Data Series 4. https://doi.org/10.14509/25239
Lindgren, P.R., G. Grosse, K.M. Walter Anthony, and F.J. Meyer. 2016. Detection and spatiotemporal analysis of methane ebullition on thermokarst lake ice using high-resolution optical aerial imagery. Biogeosciences 13:27-44. https://doi.org/10.5194/bg-13-27-2016
Lindgren, P., G. Grosse, F.J. Meyer, and K. Walter Anthony. 2019. An object-based classification method to detect methane ebullition bubbles in early winter lake ice. Remote Sensing 11:822. https://doi.org/10.3390/rs11070822
McFeeters, S. K. 1996. The use of the Normalized Difference Water Index (NDWI) in the delineation of open water features. International Journal of Remote Sensing 17:1425-1432. https://doi.org/10.1080/01431169608948714
Strauss, J., S. Laboor, A.N. Fedorov, D. Fortier, D. Froese, M. Fuchs, G. Grosse, F. Günther, J.W. Harden, G. Hugelius, M.Z. Kanevskiy, A.L. Kholodov, V.V. Kunitsky, G. Kraev, L. Lapointe-Elmrabti, A.V. Lozhkin, E. Rivkina, J. Robinson, L. Schirrmeister, D. Shmelev, Y. Shur, C. Siegert, V. Spektor, M. Ulrich, S.L. Vartanyan, A. Veremeeva, K.M. Walter Anthony, and S.A. Zimov. 2016. Database of Ice-Rich Yedoma Permafrost (IRYP). PANGAEA. https://doi.org/10.1594/PANGAEA.861733
USGS (U.S. Geological Survey.) 2018. USGS Lidar Point Cloud AK FairbanksNSB QL1 2017 FB17 4205 LAS 2018: U.S. Geological Survey. https://www.sciencebase.gov/catalog/item/5be30ff4e4b0b3fc5cf70b38
Walter Anthony, K.M., P. Lindgren, P. Hanke, M. Engram, P. Anthony, R. Daanen, A.C. Bondurant, A.K. Liljedahl, J. Lenz, G. Grosse, B.M. Jones, L. Brosius, S.R. James, B.J. Minsley, N.J. Pastick, J. Munk, J. Chanton, C.E. Miller, and F.J. Meyer. 2020. Decadal-scale hotspot methane ebullition within lakes following abrupt permafrost thaw. Environmental Research Letters 16 035010. http://doi.org/10.1088/1748-9326/abc848