Documentation Revision Date: 2025-02-27
Dataset Version: 1
Summary
There are two data files in shapefile (.shp) format provided in compressed .zip files with this dataset. The shapefiles provide lake names, area, and locations of analyzed lakes and potential gas seeps of several lakes in the Goldstream Valley area of Fairbanks, Alaska.
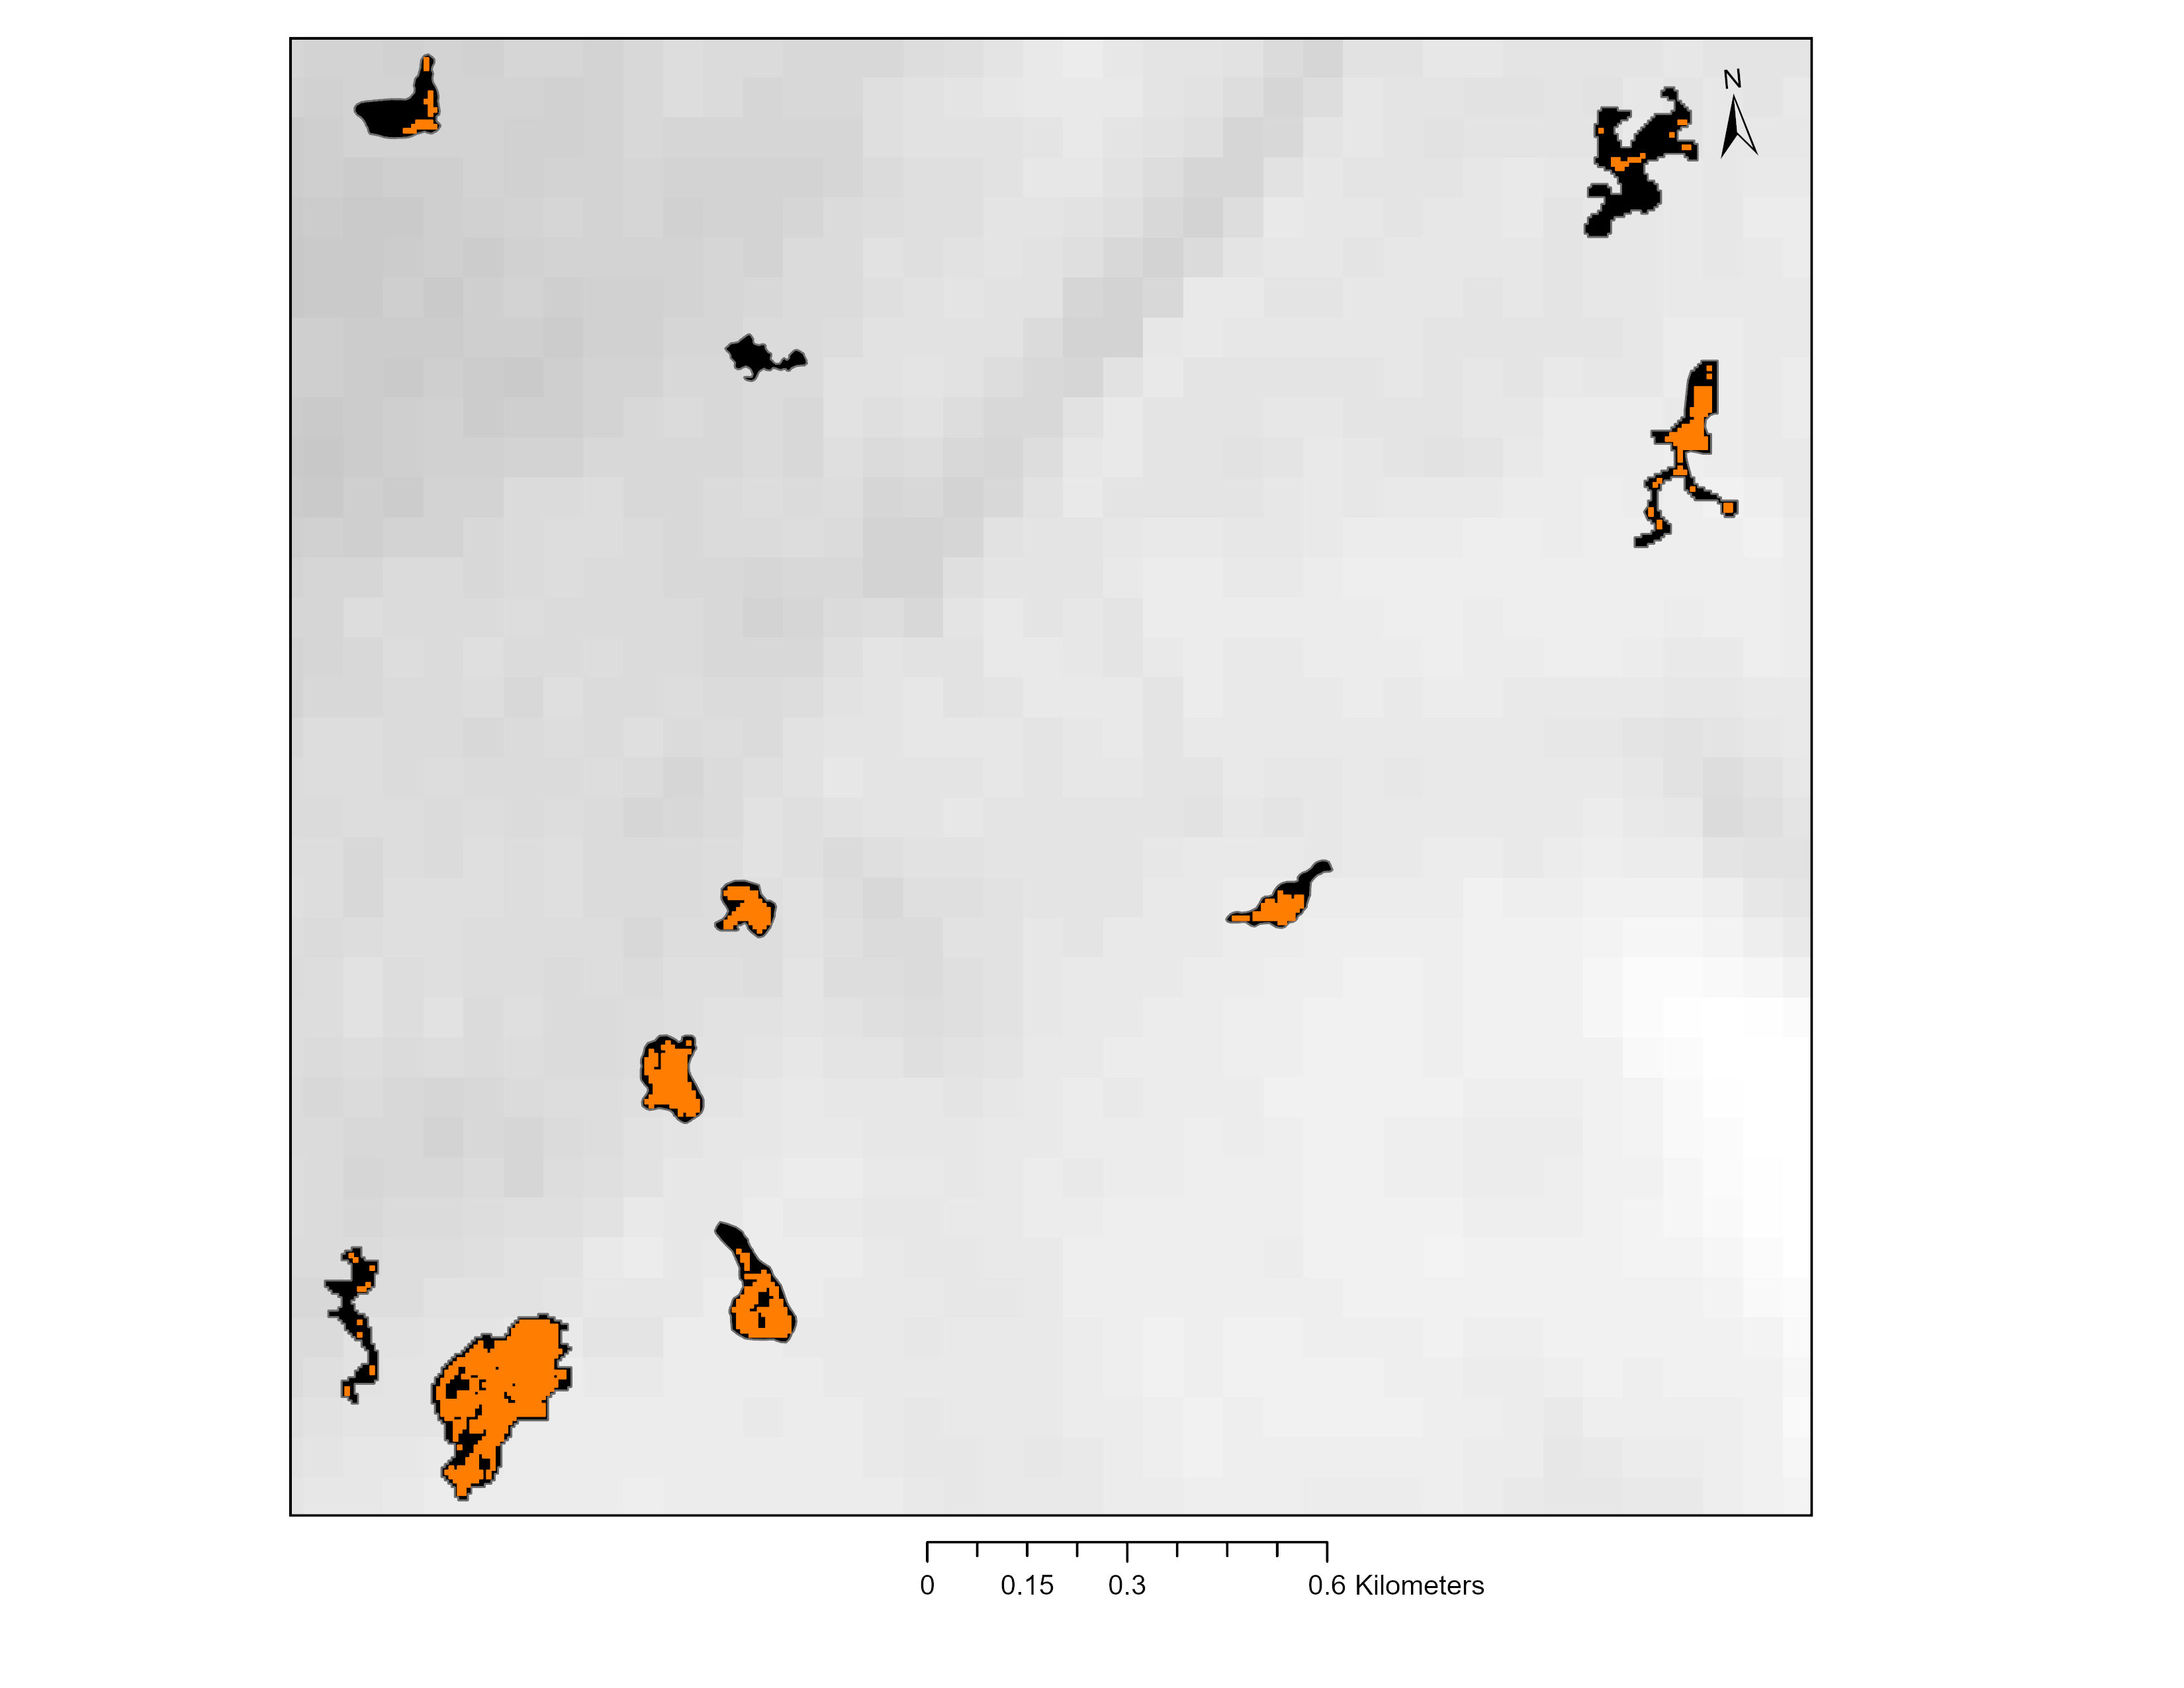
Figure 1. Examples of SAR-detected areas of potential perennial ebullition (orange) in several lakes (black) within the Goldstream Valley area of Fairbanks indicate possible locations of methane-rich gas (background: 60 m NED Hillshade, USGS, 2018).
Citation
Tyler, N., M.J. Engram, and K. Walter Anthony. 2025. Potential Areas of Gas Seepage Detected by SAR in Lakes near Fairbanks, Alaska. ORNL DAAC, Oak Ridge, Tennessee, USA. https://doi.org/10.3334/ORNLDAAC/2394
Table of Contents
- Dataset Overview
- Data Characteristics
- Application and Derivation
- Quality Assessment
- Data Acquisition, Materials, and Methods
- Data Access
- References
Dataset Overview
This dataset includes maps and locations of potential gas seepage in lakes within the immediate and surrounding area around Fairbanks, Alaska, a region underlain by discontinuous permafrost and characterized by thermokarst lake formation. Gas bubbling from lakes in the Fairbanks area is usually rich in methane, a potent greenhouse gas that is difficult to quantify. A new remote sensing method was used for detecting potential gas seepage, defined as areas of suspected perennial ebullition, by using a previously ground-truthed seep that appeared as a high-backscatter perennial feature in winter L-band Synthetic Aperture Radar (SAR) data from 2006-2011. Based on threshold values determined by the sigma-naught backscatter of this training seep, 1,690 areas of potential seepage were detected in 459 lakes out of 658 lakes analyzed. Results were validated through a different ground-truthed seep.
Project: Arctic-Boreal Vulnerability Experiment
The Arctic-Boreal Vulnerability Experiment (ABoVE) is a NASA Terrestrial Ecology Program field campaign being conducted in Alaska and western Canada, for 8 to 10 years, starting in 2015. Research for ABoVE links field-based, process-level studies with geospatial data products derived from airborne and satellite sensors, providing a foundation for improving the analysis, and modeling capabilities needed to understand and predict ecosystem responses to, and societal implications of, climate change in the Arctic and Boreal regions.
Related Dataset
Mullen, A., J.D. Watts, B.M. Rogers, M.L. Carroll, J.A. Caraballo-Vega, J. Noomah, Z.W. Williams, J.K.Y. Hung, and S. Natali. 2022. ABoVE: Lake and Pond Extents in Alaskan Boreal and Tundra Subregions, 2019-2021. ORNL DAAC, Oak Ridge, Tennessee, USA. https://doi.org/10.3334/ORNLDAAC/2134
Acknowledgement
This work was supported by NASA's ABoVE project via subcontract 1685291: Enhanced Methane Emissions in Transitional Permafrost Environments: An ABoVE Phase 3 Synthesis Investigation.
Data Characteristics
Spatial Coverage: Fairbanks area, Alaska
Spatial Resolution: 10 m (resolution of ALOS-1 PALSAR)
Temporal Coverage: 2006-12-04 to 2011-03-17, during ice-on season only (November through April).
Temporal Resolution: Resampling intervals were irregular, averaged 25-46 day acquisition spacings for all ice covers (Used all available scenes that were good quality, with minimal distortions and artifacts).
Site Boundaries: Latitude and longitude are given in decimal degrees.
| Site | Westernmost Longitude | Easternmost Longitude | Northernmost Latitude | Southernmost Latitude |
|---|---|---|---|---|
| Fairbanks area, Alaska | -148.2867 | -146.87006 | 65.17867 | 64.33126 |
Data File Information
There are two data files in shapefile (.shp) format provided in compressed .zip files. The shapefiles provide lake names, area, and locations of analyzed lakes and potential gas seeps of several lakes in the Goldstream Valley area of Fairbanks, Alaska:
analyzed_lakes_Fairbanks_AK.shp: Shapefile of Fairbanks-area lakes that were analyzed for potential seeps.
potential_lake_gas_seeps_Fairbanks_AK.shp: Shapefile of SAR-detected potential seeps, where each polygon represents a potential seep that showed up in 5 out of 5 years of data.
Variables in the shapefiles
analyzed_lakes_Fairbanks_AK.shp
- lakeID: Identifying number for the analyzed lake.
- Source: Dataset that lake outline was copied or derived from: DGGS Hydro, AK Wetlands, Mullen et al 2022
- Lake_name: Name of lake, if known.
- LkAreaM2: Area of the lake in square meters.
- modToSPOT5: Binary identifier if lake outline was manually edited to SPOT5 reference
potential_lake_gas_seeps_Fairbanks_AK.shp
- lakeID: Identifying number for the analyzed lake.
- SpAreaM2: Area of potential gas seepage in square meters.
- POTSeepID: Identifying number of potential gas seepage feature.
Application and Derivation
These data provide a valuable and focused dataset to guide future ground truth investigations for areas of persistent ebullition (bubbling) from lakes. The gas seeps within these areas generally have a high percentage of methane, a potent greenhouse gas. Coupled with field-based and other remote sensing analyses, this will provide further insight into the distribution of gas seepage in Arctic lakes, including in areas where permafrost degrades.
Quality Assessment
Several quality control steps were added to the data processing to minimize uncertainties.
- Application of a 4.5-m inward shoreline buffer (max distance across a 6.25 m2 pixel) to the lake perimeters to remove pixels that may have included high backscatter from the lakeshore due to geolocation error or morphological changes in lake perimeters.
- Added penalty to scene-specific threshold selection process to minimize false positives.
- Added condition that areas of potential seepage had to show up 30% of the time in each ice cover (winter), then for 5 out of the 5 ice covers analyzed to minimize ephemeral features/artifacts.
Finally, a false alarm rate for the final product, or the percentage of FP in the TN area, and it was very small: 0.0001%.
Data Acquisition, Materials, and Methods
Study Area
Lakes located within a 3,549 km2 area around Fairbanks, Alaska were analyzed. For this analysis, a large, previously ground-truthed gas seep in North Blair Lake (Engram and Walter Anthony, 2024) was used for training.
The following is a summary of the data collection, processing, and analysis used. All GIS analyses were done in ArcGIS Pro 3.4.0. and Python 3.11.
Lake Perimeters
Lake perimeters were sourced from several datasets: DGGS IfSAR Hydro (DGGS Staff, 2013), AK Wetlands (USFWS, 1980), and Mullen et al. (2022). Lakes with areas less than 2,000 m2 were filtered out, with the exception of six smaller lakes where field data was previously collected. Of the smaller lakes, two were manually derived. To refine lake perimeters and remove spurious artifacts prior to analysis, 2009 SPOT5 imagery were used as co-temporal reference data relative to the ALOS-1 PALSAR acquisitions used for this analysis. These refinements were applied at 1:1,500 - 2,500, depending on the complexity of the perimeter’s shape. The final shapefile had 658 lakes.
SAR Acquisitions
Winter L-band data were procured from the ALOS-1 PALSAR instrument, acquired in FBS mode with HH polarization and a 34.3° off-nadir angle, from the Alaska Satellite Facility’s Vertex system. Level 1.5 detected products of winter scenes (November – April) from late 2006 to early 2011 were downloaded that covered the location of our training seep, as well as preceding and subsequent frames in the same relative orbit (path). SAR data were post-processed following Engram et al. (2020).
Prior to area(s) of potential seepage analysis (summarized below), the revised lake shapefile was used to mask out potential land pixels in order to work exclusively with lake pixels.
Analysis
Previous studies showed a strong correlation between L-band SAR backscatter from lake ice and gas seeps (Engram et al. 2013, 2020). Based on this principle, an automated weighted minimum cost approach was utilized to select and apply scene-specific thresholds using the backscatter intensity (from pixel values) of the training seep (i.e. true positives, or TP) balanced against areas where no seepage was observed (i.e. true negatives, or TN). Pixel statistics were obtained using scene-specific TP polygons delineated by the steep radiometric gradient between training seep pixels and the surrounding lake ice pixels, then manually revised based on field data. TN polygons, based solely on field data, were created and used universally for all scenes.
The automated selection process evaluated 1,000 potential thresholds between the minimum and maximum training seep pixel values in each scene, selecting the best possible threshold value that maximized TP and minimized false positives (i.e. FP, pixels identified as “seep” within the TN area), where a penalty (weight = 20) was applied towards FP to give us a higher degree of confidence in our results. Scenes were then binarized, identifying pixels as areas of potential seepage if backscatter intensity was higher than the selected threshold. Each binarized scene was visually checked to ensure that the training seep was properly classified with at least two pixels within its TP polygon to maximize carry-through.
The binarized scenes were vertically summed to create a classified count of occurrence for each ice cover, then normalized to the depth of the data for each ice cover, resulting in a pixel classification percentage for all the scenes in that winter. A pixel was classified as “potential seepage” if backscatter intensity exceeded the threshold for 30% of the scenes in an ice cover and then again if it re-appeared in all five ice covers. Adjacent potential seepage pixels were then merged into polygon features.
Data Access
These data are available through the Oak Ridge National Laboratory (ORNL) Distributed Active Archive Center (DAAC).
Potential Areas of Gas Seepage Detected by SAR in Lakes near Fairbanks, Alaska
Contact for Data Center Access Information:
- E-mail: uso@daac.ornl.gov
- Telephone: +1 (865) 241-3952
References
DGGS Staff. 2013. Elevation Datasets of Alaska: Alaska Division of Geological & Geophysical Surveys Digital Data Series 4, https://elevation.alaska.gov/ https://doi.org/10.14509/25239
Engram, M., K.M.W. Anthony, T. Sachs, K. Kohnert, A. Serafimovich, G. Grosse, and F.J. Meyer. 2020. Remote sensing northern lake methane ebullition. Nature Climate Change 10:511–517. https://doi.org/10.1038/s41558-020-0762-8.
Engram, M. K.M. Anthony, F.J. Meyer, and G. Grosse. 2013. Synthetic aperture radar (SAR) backscatter response from methane ebullition bubbles trapped by thermokarst lake ice. Canadian Journal of Remote Sensing 38: 667–682. https://doi.org/10.5589/m12-054.
Engram, M. and K.W. Anthony. 2024. Synthetic aperture radar (SAR) detects large gas seeps in Alaska lakes. Environmental Research Letters 19:044034 https://doi.org/10.1088/1748-9326/ad2b2a.
Mullen, A., J.D. Watts, B.M. Rogers, M.L. Carroll, J.A. Caraballo-Vega, J. Noomah, Z.W. Williams, J.K.Y. Hung, and S. Natali. 2022. ABoVE: Lake and Pond Extents in Alaskan Boreal and Tundra Subregions, 2019-2021. ORNL DAAC, Oak Ridge, Tennessee, USA. https://doi.org/10.3334/ORNLDAAC/2134
USFWS. 1980. National Wetlands Inventory website. U.S. Department of the Interior, U.S. Fish and Wildlife Service, Washington, D.C. https://www.fws.gov/program/national-wetlands-inventory