Documentation Revision Date: 2022-09-14
Dataset Version: 1
Summary
There are 6,576 data files in HDF4 (*.hdf) format and one companion file in Portable Document (*.pdf) format included in this dataset.
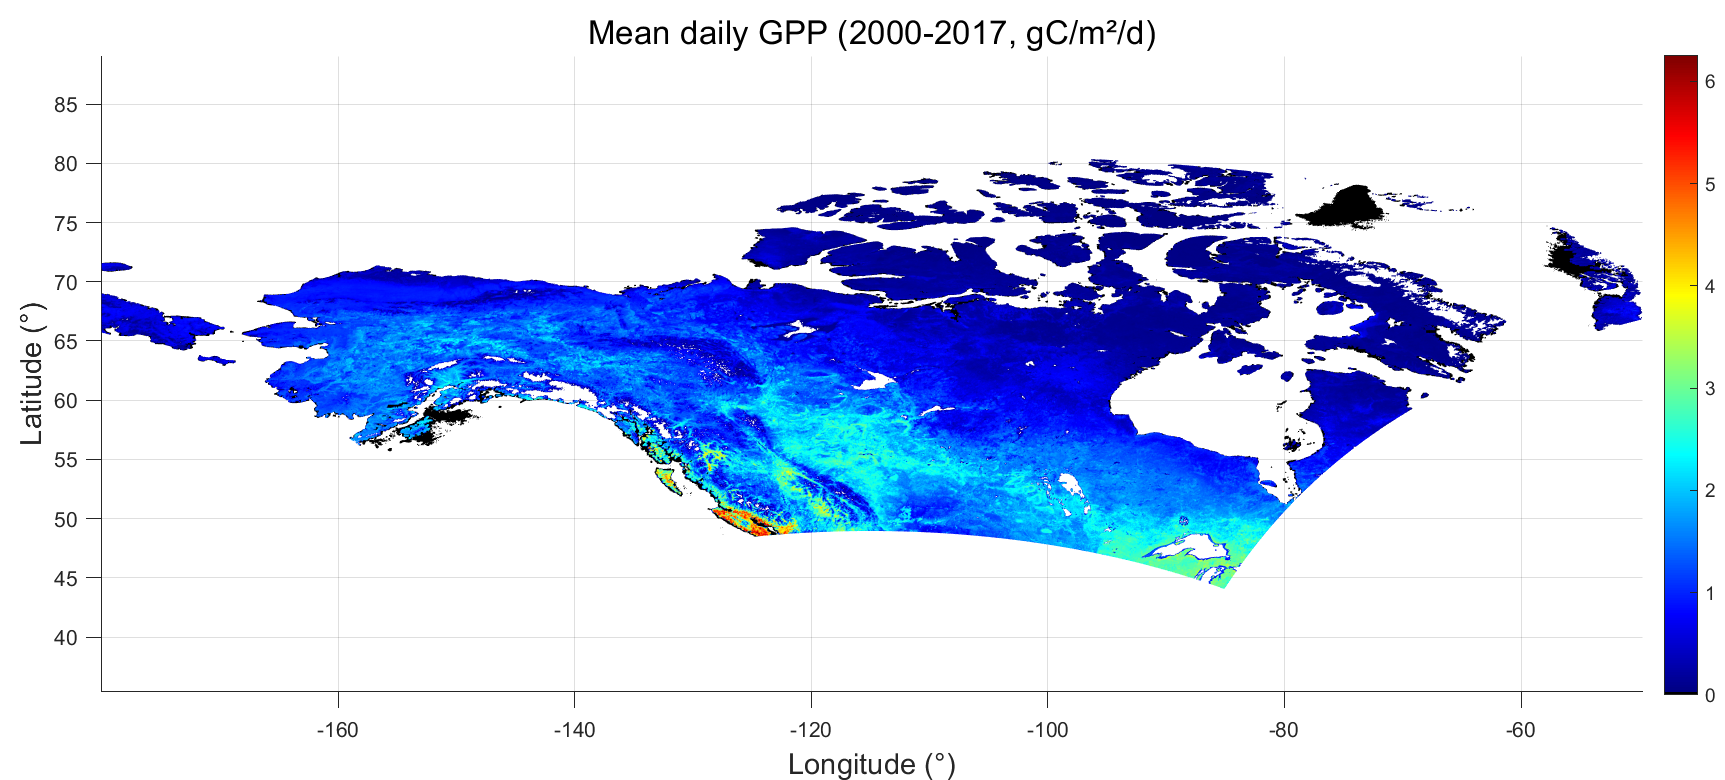
Figure 1. Average daily GPP for 2000-2017 in units of grams of carbon per square meter per day.
Citation
Hmimina, G., R. Yu, R. Wang, K.F. Huemmrich, and J.A. Gamon. 2022. ABoVE: Light-Curve Modelling of Gridded GPP Using MODIS MAIAC and Flux Tower Data. ORNL DAAC, Oak Ridge, Tennessee, USA. https://doi.org/10.3334/ORNLDAAC/2024
Table of Contents
- Dataset Overview
- Data Characteristics
- Application and Derivation
- Quality Assessment
- Data Acquisition, Materials, and Methods
- Data Access
- References
Dataset Overview
This dataset contains gridded estimations of daily ecosystem Gross Primary Production (GPP) in grams of carbon per day at a 1 km2 spatial resolution over Alaska and Canada from 2000-01-01 to 2018-01-01. Daily estimates of GPP were derived from a light-curve model that was fitted and validated over a network of ABoVE domain Ameriflux flux towers then upscaled using MODIS Multi-Angle Implementation of Atmospheric Correction (MAIAC) data to span the extended ABoVE domain. In general, the methods involved three steps; the first step involved collecting and processing mainly carbon-flux site-level data, the second step involved the analysis and correction of site-level MAIAC data, and the final step developed a framework to produce large-scale estimates of GPP. The light-curve parameter model was generated by upscaling from flux tower sub-daily temporal resolution by deconvolving the GPP variable into 3 components: the absorbed photosynthetically active radiation (aPAR), the maximum GPP or maximum photosynthetic capacity (GPPmax), and the photosynthetic limitation or amount of light needed to reach maximum capacity (PPFDmax). GPPmax and PPFDmax were related to satellite reflectance measurements sampled at the daily scale. GPP over the extended ABoVE domain was estimated at a daily resolution from the light-curve parameter model using MODIS MAIAC daily reflectance as input. This framework allows large-scale estimates of phenology and evaluation of ecosystem sensitivity to climate change.
Project: Arctic-Boreal Vulnerability Experiment
The Arctic-Boreal Vulnerability Experiment (ABoVE) is a NASA Terrestrial Ecology Program field campaign being conducted in Alaska and western Canada, for 8 to 10 years, starting in 2015. Research for ABoVE links field-based, process-level studies with geospatial data products derived from airborne and satellite sensors, providing a foundation for improving the analysis, and modeling capabilities needed to understand and predict ecosystem responses to, and societal implications of, climate change in the Arctic and Boreal regions.
Related Datasets
Yu, R., G. Hmimina, K.F. Huemmrich, D.P. Billesbach, A. Lyapustin, Y. Wang, and J.A. Gamon. 2019. ABoVE: Corrected MODIS MAIAC Reflectance at Tower Sites, Alaska and Canada, 2000-2016. ORNL DAAC, Oak Ridge, Tennessee, USA. https://doi.org/10.3334/ORNLDAAC/1700
Acknowledgments
This work was supported by NASA's Arctic-Boreal Vulnerability Experiment (grant NNX15AT78A).
Data Characteristics
Spatial Coverage: Alaska, U.S., and Canada
ABoVE Reference Locations
Domain: Extended ABoVE
State/Territory: Alaska, Canada
Spatial Resolution: 1 km2
Temporal Coverage: 2000-01-01 to 2018-01-01
Temporal Resolution: Daily
Study Area: Latitude and longitude are given in decimal degrees.
| Site | Northernmost Latitude | Southernmost Latitude | Easternmost Longitude | Westernmost Longitude |
|---|---|---|---|---|
| Alaska and Canada | 79.74890 | 50.06044 | -73.64067 | -172.07817 |
Data File Information
There are 6,576 data files in HDF4 (*.hdf) format and one companion file in Portable Document (*.pdf) format included in this dataset. The data files are named GPP_YYYYDDD.hdf (e.g., GPP_2000001.hdf), where YYYYDDD is the four-digit year and three-digit month of the orbit timestamp.
Table 1. File names and descriptions.
| File Names | Description |
|---|---|
| GPP_YYYYDDD.hdf | predicted daily GPP (grams of carbon per square meter per day) |
| MAIAC_GPP_ATBD.pdf | Algorithm Description: Light-curve modelling of GPP across the ABoVE domain using MODIS MAIAC data and a flux tower network |
Data File Details
The scale factor varies by file and is provided in the attributes of the variable GPP. Each file contains 4800 rows and 3600 columns. The Coordinate Reference System is Albers Conical Equal-Area (WGS-84).
Table 2. Variable names and descriptions.
| Variable Name | Units | Description |
|---|---|---|
| GPP | gC m-2 day-1 | GPP predicted using a light-curve model, where GPP = double(x) / scale + offset. The scale and offset values are provided as attributes in each file. |
| flag | Quality Flags: >0 = land 1 = missing data 2 = valid data |
Application and Derivation
This dataset provides a daily Gross Primary Productivity (GPP) product spanning the ABoVE Domain and adjacent regions (areas covered by MODIS tiles overlapping the domain). Applications include ecosystem photosynthesis and carbon flux analyses at multiple spatial scales (MODIS pixel to entire Extended ABoVE Domain), GPP phenology, and climate change and disturbance impacts.
Quality Assessment
Estimated GPP was compared to independent flux tower derived GPP data over 17 sites selected using a land cover class homogeneity criterion (MODIS pixel composed of at least 75% of the same land cover class as the flux tower). No significant differences in Root Mean Square Error (RMSE) were found between International Geosphere-Biosphere Programme (IGBP; CITE) classes, years, and months. MODIS GPP products showed good agreement with flux tower GPP (R2=0.831; RMSE=1.11 g m-2 d-1). Error estimates can be derived from the relationship between the bootstrapped RMSE and GPP estimates (R2=0.99; RMSE=0.051 g m-2 d-1) using the equation:
RMSE = -1.394 * exp(-0.8105 * GPP) + 1.485
Data Acquisition, Materials, and Methods
Daily Gross Primary Productivity (GPP) was estimated using a light-curve model. The general approach involved performing a multi-site analysis centered on a network of flux towers across the extended ABoVE domain, then an upscaling of the results using MODIS MAIAC data (Yu et al., 2021) to span the entire extended ABoVE domain. The first step involved collecting and processing site-level data (mainly carbon flux data to be used as a reference). The second step involved the correction and analysis of MODIS MAIAC data at the site level. The final step was to develop a framework to produce large-scale estimates of phenology and ecosystem sensitivity to climate change. The steps are detailed in the companion file MAIAC_GPP_ATBD.pdf.
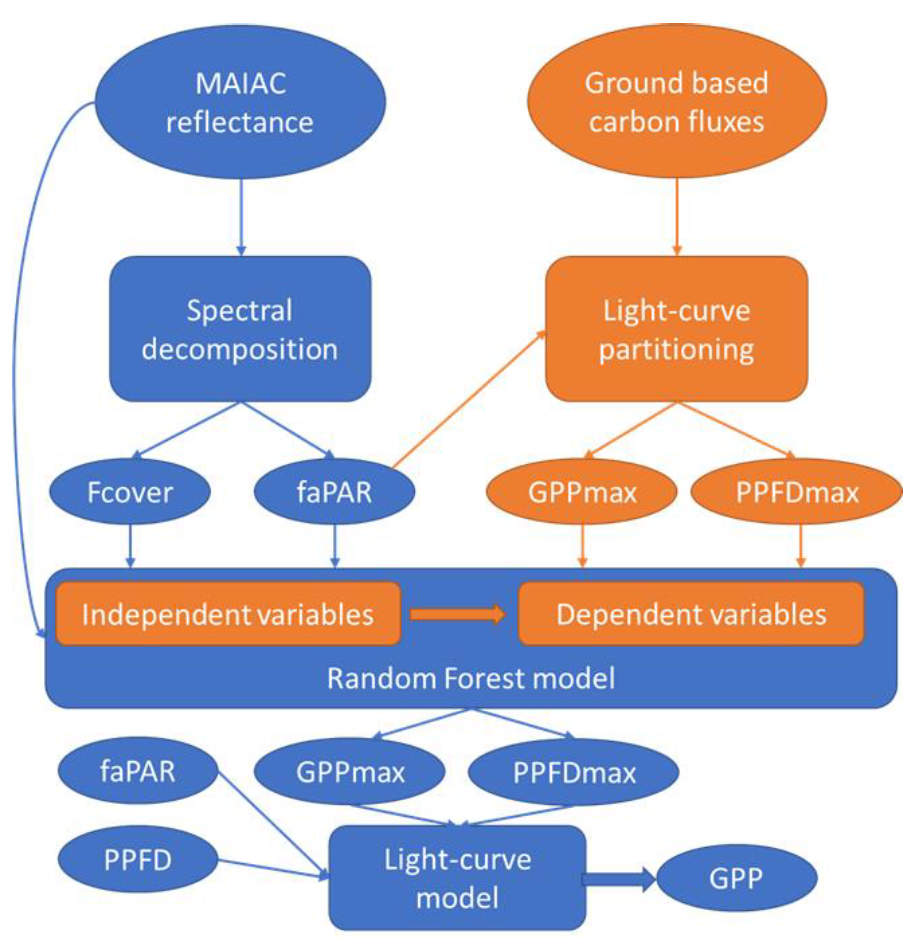
Figure 2. Functional diagram of the tile level GPP model. Blue components are datasets or processes at the tile-level scale, orange components are datasets of processes at the flux-tower level. Source: MAIAC_GPP_ATBD.pdf
Estimates of hourly GPP (in μmol m-2 h-1) were derived using the light-curve model described as
GPP = GPPmax * Erf((PPFD * faPARvegetation) / (PPFDmax * (1 / erfinv(0.95))))
where GPPmax is the maximum GPP or maximum photosynthetic capacity, Erf(x) is the error function (i.e., the integral of a Gaussian function between -infinity and x), PPFDmax is the photosynthetic limitation or amount of light needed to reach maximum capacity, and faPARvegetation is the fraction of absorbed PAR.
Hourly PPFD estimates were derived from the ERA5-Land dataset (Muñoz Sabater, 2019). faPARvegetation estimates were derived using a linear spectral decomposition of MODIS MAIAC reflectance data (Yu et al., 2021) and a compiled spectral library (see References). The light-curve parameters GPPmax and PPFDmax were obtained first at the flux-tower level by fitting the light-curve model onto net ecosystem exchange (NEE), then interpolated across the extended ABoVE Domain using random forest models fitted onto MODIS MAIAC reflectance data. The estimated hourly GPP was then summed up to a daily scale and converted to the units g m-2 d-1.
Data Access
These data are available through the Oak Ridge National Laboratory (ORNL) Distributed Active Archive Center (DAAC).
ABoVE: Light-Curve Modelling of Gridded GPP Using MODIS MAIAC and Flux Tower Data
Contact for Data Center Access Information:
- E-mail: uso@daac.ornl.gov
- Telephone: +1 (865) 241-3952
References
Spectral Libraries
Burnett, A.C., S.P. Serbin, J. Lamour, J. Anderson, K.J. Davidson, D. Yang, and A. Rogers. 2020. Seasonal Measurements of Photosynthesis and Leaf Traits in Scarlet Oak. EcoSIS. https://doi.org/10.21232/ujBYNxhm
Couture, J.J., S.P. Serbin, and P.A. Townsend. 2015. Elevated temperature and periodic water stress alter growth and quality of common milkweed (Asclepias syriaca) and monarch (Danaus plexippus) larval performance. Arthropod-Plant Interactions 9:149–161. https://doi.org/10.1007/s11829-015-9367-y
Fallon, B., A. Yang, C. Nguyen, I. Armour, J. Juzwik, R.A. Montgomery, and J. Cavender-Bares. 2019. Leaf Spectra from Experimental Detection of Oak Wilt in Oak Seedlings. EcoSIS. https://doi.org/10.21232/h90m-mg68
Kokaly, R.F., R.N. Clark, G.A. Swayze, K.E. Livo, T.M. Hoefen, N.C. Pearson, R.A. Wise, W.M. Benzel, H.A. Lowers, R.L. Driscoll, and A.J. Klein. 2017. USGS Spectral Library Version 7. Data Series. https://doi.org/10.3133/ds1035
Qi, Y. 2015. Missoula Montana Lodgepole Pine and Big Sagebrush Time Series. EcoSIS. https://doi.org/10.21232/C2D08D
Rogers, A., S. Serbin, and K. Ely. 2021. Leaf Mass Area, Leaf Carbon and Nitrogen Content, Kougarok Road and Teller Road, Seward Peninsula, Alaska, 2016. Next Generation Ecosystems Experiment - Arctic, Oak Ridge, Tennessee, USA. https://doi.org/10.5440/1430080
Schweiger, A.K. 2016. Leaf Spectra Cedar Creek LTER for Chemical Analyses. EcoSIS. https://doi.org/10.21232/zKg7PEC9
Schweiger, A.K. 2016. Leaf Spectra IDENT Cloquet. EcoSIS. https://doi.org/10.21232/j9h9Axyi
Schweiger, A.K. 2016. Leaf Spectra Oak Savanna Cedar Creek LTER. EcoSIS. https://doi.org/10.21232/MkgZwdSw
Serbin, S., W. Lieberman-Cribbin, K. Ely, and A. Rogers. 2019. NGEE Arctic Leaf Spectral Reflectance and Transmittance, Barrow, Alaska, 2014-2016. Next Generation Ecosystems Experiment - Arctic, Oak Ridge, Tennessee, USA. https://doi.org/10.5440/1437044
Serbin, S., and A. Rogers. 2021. NGEE Arctic Leaf Spectral Reflectance, Kougarok Road, Seward Peninsula, Alaska, 2016. Next Generation Ecosystems Experiment - Arctic, Oak Ridge, Tennessee, USA. https://doi.org/10.5440/1430079
Serbin, S., A. Rogers, and J. Liebig. 2018. NGEE Arctic Leaf Spectral Reflectance, Barrow, Alaska 2013. Next Generation Ecosystems Experiment - Arctic, Oak Ridge, Tennessee, USA. https://doi.org/10.5440/1441203
Serbin, S. 2016. Fresh Leaf Spectra to Estimate Leaf Morphology and Biochemistry for Northern Temperate Forests. EcoSIS. https://doi.org/10.21232/C2WC75
Serbin, S. 2019. NGEE Arctic Leaf Spectral Absorptance, Barrow, Alaska, 2015-2016. Next Generation Ecosystems Experiment - Arctic, Oak Ridge, Tennessee, USA.. https://doi.org/10.5440/148233
Serbin, S., D.N. Dillaway, E.L. Kruger, P.A. Townsend. 2008 University of Wisconsin Biotron Fresh Leaf Spectra and Gas Exchange Leaf Traits. EcoSIS. https://doi.org/10.21232/C22M27
Vargas-Zesati, S., C.E. Tweedie, S. Oberbauer, and R. Hollister. 2018. 2017 Eagle Creek, Alaska Plant Species Leaf Reflectance Spectra (SVC). EcoSIS. https://doi.org/10.21232/zfwgxjYU
Vargas-Zesati, S., C.E. Tweedie, S. Oberbauer, and R. Hollister. 2018. 2017 No Name Creek, Alaska Plant Species Reflectance Spectra (SVC). EcoSIS. https://doi.org/10.21232/voz6NMC6
Vargas-Zesati, S., C.E. Tweedie, S. Oberbauer, and R. Hollister. 2018. 2017 Toolik, Alaska Plant Species Leaf Reflectance Spectra (SVC). EcoSIS. https://doi.org/10.21232/pMwwDc9U
Vargas-Zesati, S., C.E. Tweedie, S. Oberbauer, and R. Hollister. 2018. 2017 Utqiaġvik, Alaska Oil Spill Runway Plant Species Leaf Reflectance Spectra (SVC). EcoSIS. https://doi.org/10.21232/WQrdDJVS
Vargas-Zesati, S., C.E. Tweedie, S. Oberbauer, and R. Hollister. 2018. 2017 Utqiaġvik, Alaska Plant Species Leaf Reflectance Spectra (SVC). EcoSIS. https://doi.org/10.21232/K8Mc2z5N
Vargas-Zesati, S., C.E. Tweedie, S. Oberbauer, and R. Hollister. 2018. 2017 Sagwon, Alaska Plant Species Leaf Reflectance Spectra (SVC). EcoSIS. https://doi.org/10.21232/7W8yTYa4
Wang, Z. 2019. Dried Leaf Spectra to Estimate Foliar Functional Traits Over NEON Domains in Eastern United States. EcoSIS. https://doi.org/10.21232/4d6k-sj15
Wang, Z. 2019. Fresh Leaf Spectra to Estimate LMA Over NEON Domains in Eastern United States. EcoSIS. https://doi.org/10.21232/9831-rq60
Wang, Z. 2019. Fresh Leaf Spectra to Estimate Foliar Functional Traits Over NEON Domains in Eastern United States. EcoSIS. https://doi.org/10.21232/gx9f-5546
Zesati, S.V., C.E. Tweedie, K.F. Huemmrich, P.K. Campbell, and M. Velez-Reyes. 2019. ABoVE: Reflectance Spectra of Tundra Plant Communities across Northern Alaska. ORNL DAAC, Oak Ridge, Tennessee, USA. https://doi.org/10.3334/ORNLDAAC/1685
Other
Muñoz Sabater, J. 2019. ERA5-Land hourly data from 1981 to present. Copernicus Climate Change Service (C3S) Climate Data Store (CDS). https://doi.org/10.24381/cds.e2161bac
Yu, R., G. Hmimina, K.F. Huemmrich, D.P. Billesbach, A. Lyapustin, Y. Wang, Z. Jingchao, R. Wang, and J.A. Gamon. 2021. ABoVE: Angular-corrected MODIS MAIAC Reflectance across Alaska and Canada, 2000-2017. ORNL DAAC, Oak Ridge, Tennessee, USA. https://doi.org/10.3334/ORNLDAAC/1858