Documentation Revision Date: 2024-03-25
Dataset Version: 1
Summary
This dataset holds 3654 files in cloud optimized GeoTIFF (COG) format.
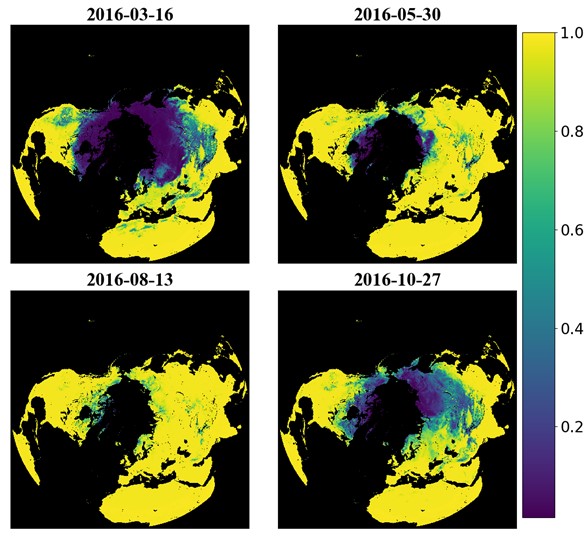
Figure 1. Probability of thawed conditions for four selected days over the 2016 seasonal cycle. The probability of thawed conditions ranges from low (0) to high (1) and is lower at higher latitudes and upper elevations during early spring (March) and late fall (October) in the Northern Hemisphere. In contrast, the probability of thawed conditions is much greater during summer (August).
Citation
Du, J., and J.S. Kimball. 2023. Probabilistic Freeze-Thaw Record for the Northern Hemisphere, 2016-2020. ORNL DAAC, Oak Ridge, Tennessee, USA. https://doi.org/10.3334/ORNLDAAC/2323
Table of Contents
- Dataset Overview
- Data Characteristics
- Application and Derivation
- Quality Assessment
- Data Acquisition, Materials, and Methods
- Data Access
- References
Dataset Overview
This dataset provides a probabilistic freeze/thaw (FT) data record from 2016 to 2020 for the Northern Hemisphere derived using a deep learning model (U-Net). The model was informed by satellite multi-frequency microwave brightness temperature retrievals from the NASA SMAP (Soil Moisture Active Passive) and JAXA AMSR2 (Advanced Microwave Scanning Radiometer 2) radiometers, and trained using daily soil temperature observations from Northern Hemisphere weather stations and global reanalysis data (ERA-5). Unlike other available FT data records that provide only a binary classification of frozen or non-frozen conditions, this product includes both binary FT and continuous variable estimates of the probability of thawed conditions. This product is designed to complement other established binary FT data records, including the NASA FT Earth System Data Record and SMAP Level 3 FT operational products, by providing a probabilistic FT variable with enhanced accuracy and sensitivity to near-surface (<=5 cm depth) soil FT condition. The data are provided in cloud optimized GeoTIFF (COG) format.
Project: ABoVE
The Arctic-Boreal Vulnerability Experiment (ABoVE) is a NASA Terrestrial Ecology Program field campaign being conducted in Alaska and western Canada, for 8 to 10 years, starting in 2015. Research for ABoVE links field-based, process-level studies with geospatial data products derived from airborne and satellite sensors, providing a foundation for improving the analysis, and modeling capabilities needed to understand and predict ecosystem responses to, and societal implications of, climate change in the Arctic and Boreal regions.
Related Publication
Donahue, K., J.S. Kimball, J. Du, F. Bunt, A. Colliander, M. Moghaddam, J. Johnson, Y. Kim, and M.A. Rawlins. 2023. Deep learning estimation of northern hemisphere soil freeze-thaw dynamics using satellite multi-frequency microwave brightness temperature observations. Frontiers in Big Data 6:1243559. https://doi.org/10.3389/fdata.2023.1243559
Acknowledgements
This work was conducted at the University of Montana under contract to NASA. This project was supported by NASA's Making Earth System Data Records for Use in Research Environments (MEaSUREs) (grant 80NSSC18K0980) and Arctic Boreal Vulnerability Experiment) (ABoVE) (grant 80NSSC22K1238) programs.
Data Characteristics
Spatial Coverage: Northern Hemisphere
Spatial Resolution: 9 km
Temporal Coverage: 2016-01-01 to 2020-12-31
Temporal Resolution: Daily
Study Areas: Latitude and longitude are given in decimal degrees.
| Site | Westernmost Longitude | Easternmost Longitude | Northernmost Latitude | Southernmost Latitude |
|---|---|---|---|---|
| Northern Hemisphere | -180 | 180 | 90 | 0 |
Data File Information
This dataset holds 3654 files in cloud optimized GeoTIFF (COG) format. These files record the daily freeze/thaw (FT) condition of land-dominated areas in the Northern Hemisphere.
The file naming convention is NH_PROBABILISTIC_AM_FT_<year>_day<DOY>.tif (e.g., "NH_PROBABILISTIC_AM_FT_2016_day001.tif"), where
- <year> = 2016, 2017. 2018, 2019, or 2020
- <DOY> = a three digit number indicating day of year (e.g., "001" = January 1, "365" = December 31 or 30 for leap years).
GeoTIFF characteristics
- Coordinate system: Northern-Hemisphere Polar EASE-Grid 2 projection, EPSG 6931
- Resolution: 9000 m x 9000 m
- Dimensions: 2000 rows x 2000 columns
- Two bands: Band 1 = probability of thawed condition, Band 2 = binary map of frozen (0) vs. thawed (1) condition
- Data format: Int16
- Scale factor: 10000 (Divide pixel values by this factor to obtain values listed in Table 1).
- Nodata value: -30000 or -3 unscaled
Table 1. GeoTIFF pixel value definitions.
| Band | Value | Description |
|---|---|---|
| 1 | 0.0 to 1.0 | Probability of thawed condition from low (0) to high (1) for land-dominated pixels |
| 2 | 0 | Frozen condition (binary) |
| 1 | Thawed condition (binary | |
| Both bands | -1 | Water-dominated pixel |
| -2 | Ice-dominated pixel | |
| -3 | Missing data |
User Note: A Guide to EASE Grids (NSIDC, 2023) provides a detailed definition of this coordinate reference system. A list of tools compatible with EASE grids is available from NSIDC.
Application and Derivation
This product is designed to complement other established binary freeze/thaw (FT) data records by providing a probabilistic FT variable with enhanced accuracy and sensitivity to near-surface (≤5 cm depth) soil FT conditions.
Quality Assessment
The overall product accuracy for the morning (6 am) binary freeze/thaw (FT) data is 93.1% when compared to ERA5 (Hersbach et al., 2020) and 92.5% compared to the in-situ soil temperature measurements. The relative accuracy varies seasonally, ranging from 98.7% in the summer months to 89.6% in the winter months.
See Donahue et al. (2023) for additional details.
Data Acquisition, Materials, and Methods
The deep learning model U-Net architecture used to derive the soil FT product employs convolutional neural network learning with four downscaling, four upscaling layers, and an initial filter bank size of 32 channels. The model's dynamic inputs include multi-band (1.4, 18.7, 36.5 GHz) V and H polarized brightness temperature daily image arrays from NASA Soil Moisture Active Passive (SMAP) (Brodnik et al., 2021) and Advanced Microwave Scanning Radiometers (AMSR2) (Kim et al., 2021). Station temperature measurements and the ERA-5 reanalysis (Hersbach et al., 2020) were used to build the output images.
Model training and verification were done using regional weather stations and ERA5 based daily soil FT observations from the years 2017, 2018, and 2019; whereas, model validation was done against independent observations from years 2016 and 2020. After each epoch, candidate models were verified against observational data from a selection of model training years, and the model with the highest performance score was saved as the final model.
Details of dataset development and analysis are available in Donahue et al. (2023).
Data Access
These data are available through the Oak Ridge National Laboratory (ORNL) Distributed Active Archive Center (DAAC).
Probabilistic Freeze-Thaw Record for the Northern Hemisphere, 2016-2020
Contact for Data Center Access Information:
- E-mail: uso@daac.ornl.gov
- Telephone: +1 (865) 241-3952
References
Brodzik, M. J., D. G. Long, and M. A. Hardman. 2021. SMAP Radiometer Twice-Daily rSIR-Enhanced EASE-Grid 2.0 Brightness Temperatures, Version 2. NASA National Snow and Ice Data Center Distributed Active Archive Center; Boulder, Colorado USA. https://doi.org/10.5067/YAMX52BXFL10
Donahue, K., J.S. Kimball, J. Du, F. Bunt, A. Colliander, M. Moghaddam, J. Johnson, Y. Kim, and M.A. Rawlins. 2023. Deep learning estimation of northern hemisphere soil freeze-thaw dynamics using satellite multi-frequency microwave brightness temperature observations. Frontiers in Big Data 6:1243559. https://doi.org/10.3389/fdata.2023.1243559
Hersbach, H., B. Bell, P. Berrisford, S. Hirahara, A. Horányi, J. Muñoz-Sabater, J. Nicolas, C. Peubey, R. Radu, D. Schepers, A. Simmons, C. Soci, S. Abdalla, X. Abellan, G. Balsamo, P. Bechtold, G. Biavati, J. Bidlot, M. Bonavita, G. De Chiara, P. Dahlgren, D. Dee, M. Diamantakis, R. Dragani, J. Flemming, R. Forbes, M. Fuentes, A. Geer, L. Haimberger, S. Healy, R.J. Hogan, E. Hólm, M. Janisková, S. Keeley, P. Laloyaux, P. Lopez, C. Lupu, G. Radnoti, P. de Rosnay, I. Rozum, F. Vamborg, S. Villaume, and J. Thépaut. 2020. The ERA5 global reanalysis. Quarterly Journal of the Royal Meteorological Society 146:1999–2049. https://doi.org/10.1002/qj.3803
Kim, Y., J. Kimball, J. Glassy, and K. McDonald. 2021. MEaSUREs Northern Hemisphere Polar EASE-Grid 2.0 Daily 6 Km Land Freeze/thaw Status from AMSR-E and AMSR2, Version 2. NASA National Snow and Ice Data Center Distributed Active Archive Center; Boulder, Colorado USA. https://doi.org/10.5067/BDY2V548E07C
NSIDC. 2023. A guide to EASE grids. NASA National Snow and Ice Data Center; Boulder, Colorado USA. https://nsidc.org/data/user-resources/help-center/guide-ease-grids