Documentation Revision Date: 2020-01-28
Dataset Version: 1
Summary
This dataset depicts the detailed spatial distribution of woody, herbaceous, and nonvascular fuel components at subpixel resolution across Alaskan tundra, which can function as a critical input for studying wildland fire risk and behavior in the tundra. Multiple map files are provided that have been clipped to the “B” grid cells of the ABoVE standard reference grids.
There are 148 data files in GeoTIFF (*.tif) format, with 37 “B” grid cell files for each of three fuel type components (woody, herbaceous, and nonvascular) and the tundra vegetation mask.

Figure 1. Examples of fractional cover distribution in a tundra region near Lake Narvakrak in the Noatak River National Preserve (Bh006v001): (a) very high-resolution imagery from Google Earth; (b) fractional cover of woody component; (b) fractional cover of herbaceous component; (d) fractional cover of nonvascular component. (From He, et al., 2019)
Citation
He, J., T.V. Loboda, L. Jenkins, and D. Chen. 2019. ABoVE: Distribution Maps of Wildland Fire Fuel Components across Alaskan Tundra, 2015. ORNL DAAC, Oak Ridge, Tennessee, USA. https://doi.org/10.3334/ORNLDAAC/1761
Table of Contents
- Dataset Overview
- Data Characteristics
- Application and Derivation
- Quality Assessment
- Data Acquisition, Materials, and Methods
- Data Access
- References
Dataset Overview
This dataset provides maps of the distribution of three major wildland fire fuel types at 30 m spatial resolution covering the Alaskan arctic tundra, circa 2015. The three fuel components include woody (evergreen and deciduous shrubs), herbaceous (sedges and grasses), and nonvascular species (mosses and lichens). Multi-seasonal and multispectral mosaics were first developed at 30 m resolution using Landsat 8 surface reflectance data collected from 2013 to 2017. The spectral information from Landsat mosaics was combined with field observations from representative tundra vegetation plots collected during multiple field trips to model the fractional cover of fuel type components. An improved vegetation mask for shrub and graminoid-dominated tundra was developed using random forest classification and is also included. The final fractional cover maps were developed using the trained model with the multi-seasonal and multi-spectral Landsat mosaics across the entire Alaskan tundra.
This dataset depicts the detailed spatial distribution of woody, herbaceous, and nonvascular fuel components at subpixel resolution across Alaskan tundra, which can function as a critical input for studying wildland fire risk and behavior in the tundra. Multiple map files are provided that have been clipped to the “B” grid cells of the ABoVE standard reference grids.
Project: Arctic-Boreal Vulnerability Experiment
The Arctic-Boreal Vulnerability Experiment (ABoVE) is a NASA Terrestrial Ecology Program field campaign conducted in Alaska and western Canada between 2016 and 2021. Research for ABoVE links field-based, process-level studies with geospatial data products derived from airborne and satellite sensors, providing a foundation for improving the analysis, and modeling capabilities needed to understand and predict ecosystem responses to, and societal implications of, climate change in the Arctic and Boreal regions.
Related Dataset:
Carroll, M.L., M.R. Wooten, C. Dimiceli, R.A. Sohlberg, and J.R.G. Townshend. 2016. ABoVE: Surface Water Extent, Boreal and Tundra Regions, North America, 1991-2011. ORNL DAAC, Oak Ridge, Tennessee, USA. https://doi.org/10.3334/ORNLDAAC/1324 (This dataset provided the surface water extent for masking water pixels.)
Walker, D.A., and M.K. Raynolds. 2018. Circumpolar Arctic Vegetation, Geobotanical, Physiographic Maps, 1982-2003. ORNL DAAC, Oak Ridge, Tennessee, USA. https://doi.org/10.3334/ORNLDAAC/1323 (Digital map for Walker, D.A., Raynolds, M.K., Daniëls, F.J., Einarsson, E., Elvebakk, A., Gould, W.A., Katenin, A.E., Kholod, S.S., Markon, C.J., Melnikov, E.S. and Moskalenko, N.G., 2005. The circumpolar Arctic vegetation map. Journal of Vegetation Science, 16(3), pp.267-282. http://dx.doi.org/10.1111/j.1654-1103.2005.tb02365.x)
Related Publication
He, J., T.V. Loboda, L. Jenkins, and D. Chen. 2019. Mapping fractional cover of major fuel type components across Alaskan tundra. Remote Sensing of Environment 232:111324. https://doi.org/10.1016/j.rse.2019.111324
Acknowledgments
This work was funded by NASA ABoVE grant NNX15AT79A.
Data Characteristics
Spatial Coverage: Alaska, USA
ABoVE Reference Locations
Domain: Core ABoVE
State/Territory: Alaska
Grid Cells: 37 unique "B" grid cells with some overlap across Regions
| Region | Number of Grid Cells | "B" Grid Cells |
|---|---|---|
| North Slope & Noatak | 22 | Bh005v000, Bh005v001, Bh005v002, Bh006v000, Bh006v001, Bh006v002, Bh006v003, Bh007v000, Bh007v001, Bh007v002, Bh007v003, Bh007v004, Bh008v001, Bh008v002, Bh008v003, Bh008v004, Bh009v002, Bh009v003, Bh009v004, Bh009v005, Bh010v004, Bh010v005 |
| Seward Peninsular | 6 | Bh003v001, Bh003v002, Bh004v001, Bh004v002, Bh005v001, Bh005v002 |
| Southwest Alaska | 12 | Bh001v002, Bh001v003, Bh001v004, Bh001v005, Bh002v002, Bh002v003, Bh002v004, Bh002v005, Bh003v002, Bh003v003, Bh003v004, Bh004v003 |
Spatial Resolution: 30 m (each cell has coverage of 6000x6000 30-m pixels)
Temporal Coverage: 2013-01-01 to 2017-12-31 (circa 2015)
Temporal Resolution: One-time estimation of the fuel type cover combining multi-year data
Study Area: (all latitudes and longitudes given in decimal degrees)
| Site | Westernmost Longitude | Easternmost Longitude | Northernmost Latitude | Southernmost Latitude |
| Alaska, USA | -170.0058 | -132.48674 | 72.52295 | 57.39106 |
Data File Information
There are 148 data files in GeoTIFF (*.tif) format, with 37 “B” grid cell files for each of three fuel type components (woody, herbaceous, and nonvascular) and the tundra vegetation mask.
The naming convention of the files is ABoVE_BhXXXvYYY_ZZZ.tif
Where:
BhXXXvYYY designates the tile ID in the “B” grid from the ABoVE standard reference grids:
XXX represents the 3-digit horizontal ID and YYY represents the 3-digit vertical ID of the tile
ZZZ refers to product type, either WoodyCover, HerbaceousCover, NonvascularCover, or TundraVegMask.
| Filename | Units | Description |
|---|---|---|
| ABoVE_BhXXXvYYY_WoodyCover | integer | fractional cover of woody component |
| ABoVE_BhXXXvYYY_HerbaceousCover | integer | fractional cover of herbaceous component |
| ABoVE_BhXXXvYYY_NonvascularCover | integer | fractional cover of nonvascular component |
| ABoVE_BhXXXvYYY_TundraVegMask | category | tundra vegetation mask |
Data File Details
All files:
projection = Canadian Albers Equal Area Conic, WKID: 102001, Authority: ESRI
data type = 16-bit signed integer
fill value = -9999
Three cover files (WoodyCover, HerbaceousCover, TundraVegMask):
valid range = 0 to 10000 (scaled = 0 to 1)
scale factor = 0.0001
TundraVegMask has three categories:
1 = Tall shrub or trees
2 = Build-up or barren land
3 = Shrub or graminoid dominated tundra
Application and Derivation
The fuel type component maps and their periodic updates can create a strong basis for enhancing modeling capabilities for both assessing fire behavior and post-fire ecological impacts. The long-term archive of moderate resolution data offers an opportunity to examine the fuel composition change in Alaskan tundra as a result of both climate change and fire occurrence.
Quality Assessment
Both internal metrics provided by random forest regression and cross-validation methods were utilized to assess the modeling results of fractional fuel component cover. 70% of the field observations were randomly selected for model training and the rest 30% were reserved for cross-validation. Internal metrics including out-of-bag error rate, the percent of variance explained, and the mean of squared residuals were generated to evaluate the performances of the trained models. The cross-validation was then conducted by comparing the predicted and observed values using the reserved 30% samples. In addition, the overall fractional cover distribution of this dataset was assessed through comparisons with existing products at similar spatial scales, to examine the differences caused by fractional cover definitions, field sampling strategies, and modeling methods. See He et al. (2019) for details.
Data Acquisition, Materials, and Methods
Study Area
The study area of Alaskan tundra was defined using the Circumpolar Arctic Vegetation Map (Walker et al., 2005). Burning in Alaskan tundra is primarily supported by surface vegetation fuels including evergreen or deciduous shrubs, herbaceous species (sedges and grasses), mosses, and lichens. Dry sites in the tundra tend to be dominated by dwarf shrubs with some grasses, mosses, and lichens, while wet sites have more sedges and mosses. Alaskan tundra shares similar vegetation communities and species across ecoregions.
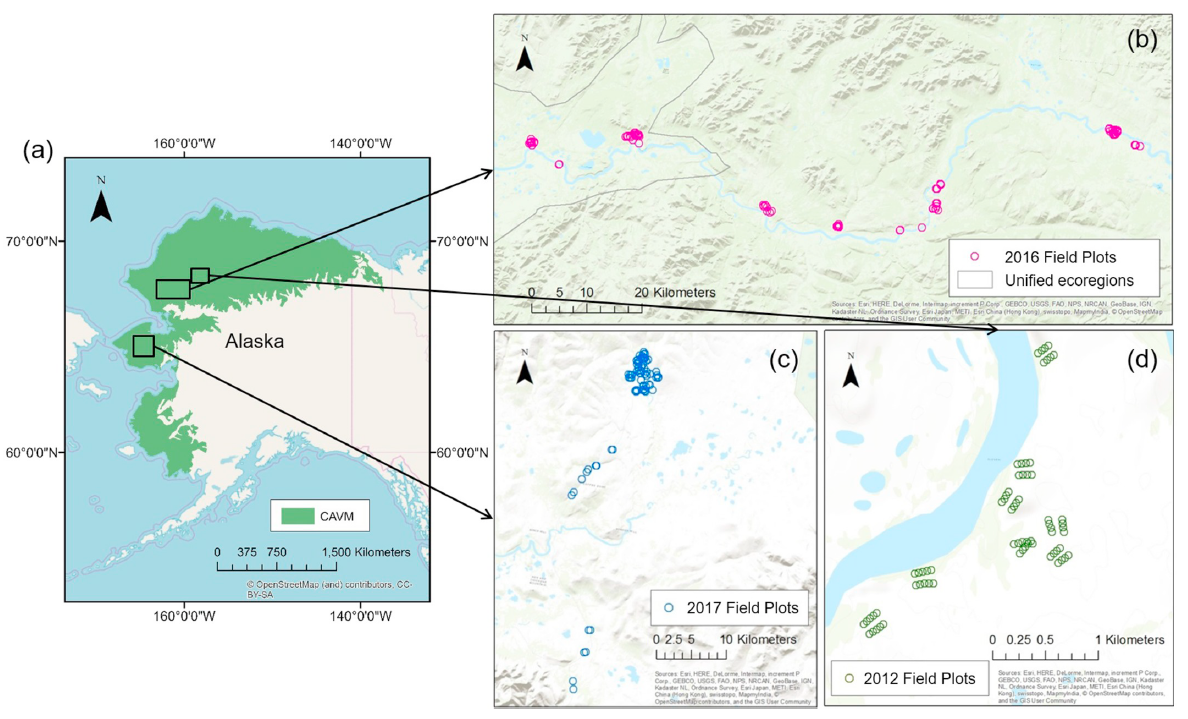
Figure 2. Alaskan tundra region as defined by CAVM (a; Walker et al., 2005) and three field campaign sites: (b) 2016 field plots in Noatak River National Preserve, (c) 2017 field plots in Seward Peninsula, (d) 2012 field plots in North Slope. (He, et al., 2019)
Data Collection
Landsat 8 Operational Land Imager Level-2 surface reflectance data from 2013 to 2017 were used to develop spatially continuous mosaics of the Alaskan tundra. Images acquired during mid-April and October with land cloud coverage less than 70% were downloaded for each year.
Fractional coverages of the three fuel components were collected from 222 10 x 10 m plots during three field campaigns in the Alaskan tundra: 2012 campaign in the North Slope, 2016 campaign in the Noatak River basin, and 2017 campaign in the Seward Peninsula. All three campaigns were conducted from late July to mid-August. Fractional coverages of fuel components within each plot were determined using ocular assessment.
The 30 m ABoVE Surface Water Extent data (Carroll et al., 2016) centered in the 2011 epoch were adopted to identify the nominal extent of water bodies across the study area for spatial and temporal consistency. The study regions are designated within the ABoVE Domain according to Loboda et al. (2019).
Data Processing
A four-step method was designed to map the spatial distribution of the fuel components (Fig. 3). The steps are briefly described below, but see He et al. (2019) for details.
Continuous mosaics of six Landsat surface reflectance bands and seven spectral indices were first developed for pre-growing (late-April to early-June), peak-growing (mid-July to mid-August) and post-growing season (end-August to September). Cloud, cloud shadow, and snow pixels were masked using the QA band from Landsat 8 Level-2 product. The Maximum Value Compositing approach was adopted for developing seasonal mosaics. The output mosaics then served as the input data for the remaining steps.
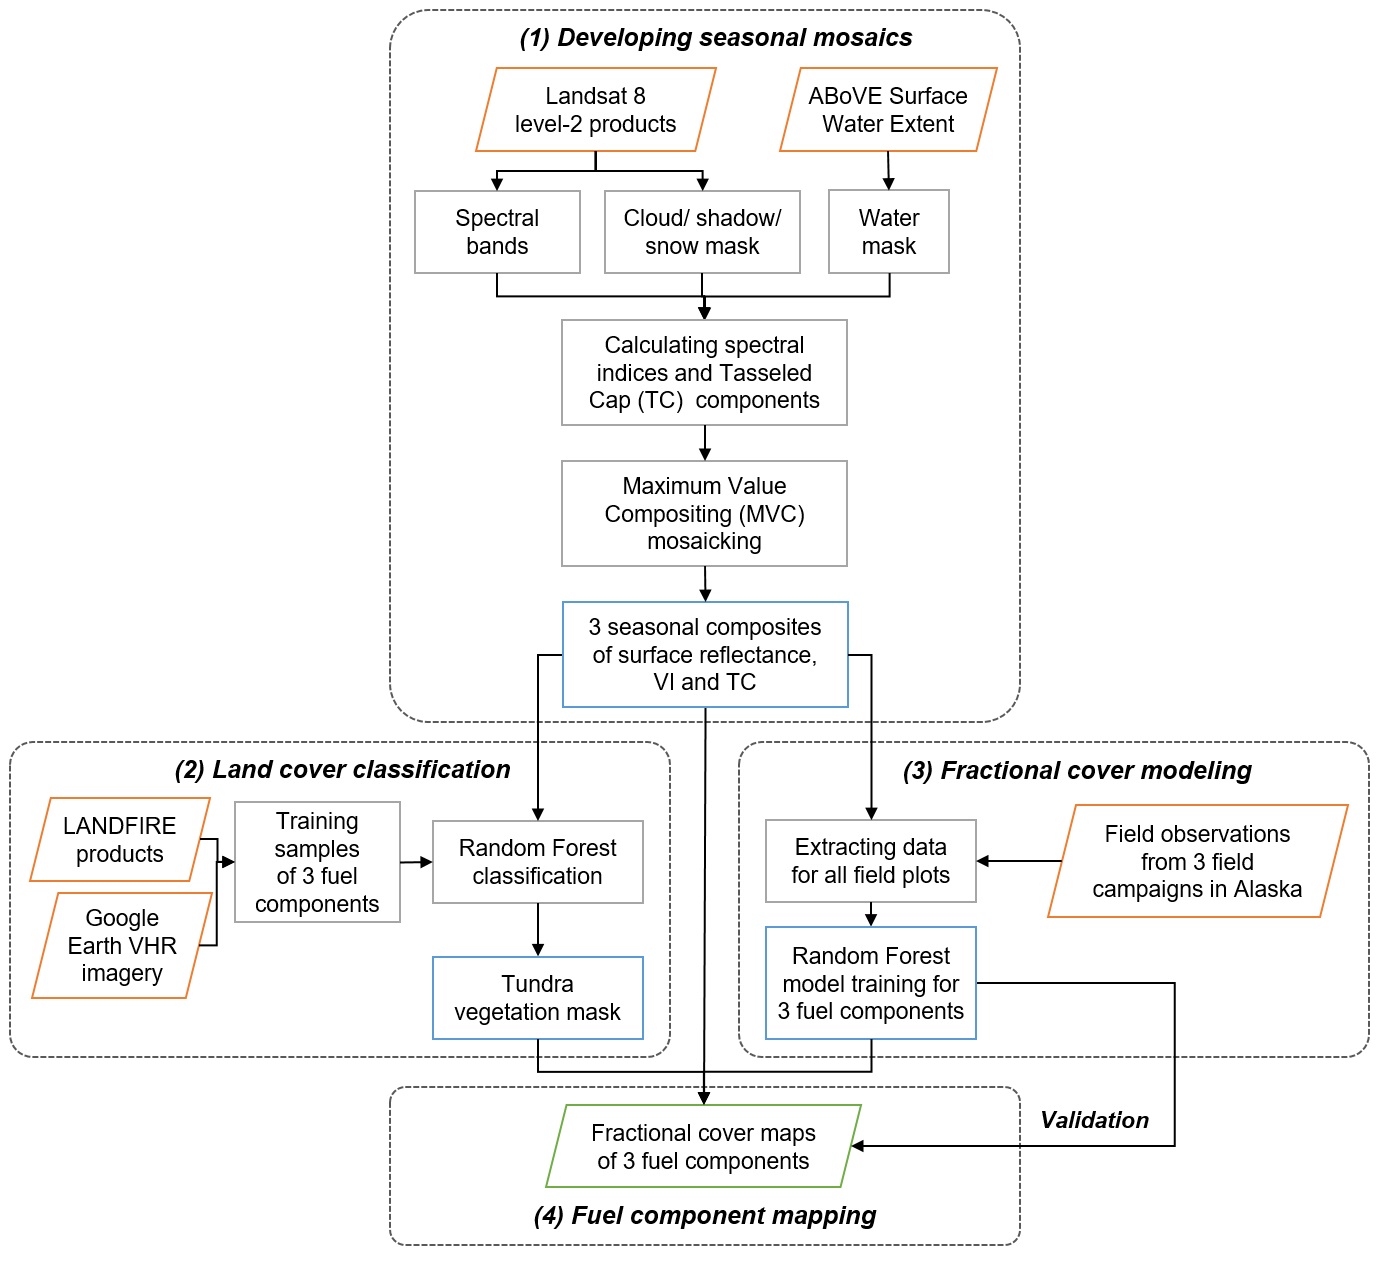
Figure 3. Flowchart of fractional fuel components mapping. (He, et al., 2019)
The TundraVegMask layer was developed to refine the shrub or graminoid dominated tundra region using random forest classification, with three land cover classes identified. Existing LANDFIRE products were used to define the general regions of the three classes for sampling random points. All bands from the seasonal mosaics were used as the input features for training and mapping the tundra vegetation mask.
Individual random forest regression models were trained for the three fuel components separately with our field measurements and seasonal composites. All spectral properties from the three growing seasons were used as the input parameters for modeling fractional covers of the fuel type components.
The results from previous steps were combined to develop fractional cover maps for the three fuel components. Only shrub or graminoid dominated tundra pixels identified by the “tundra vegetation mask” were used for mapping.
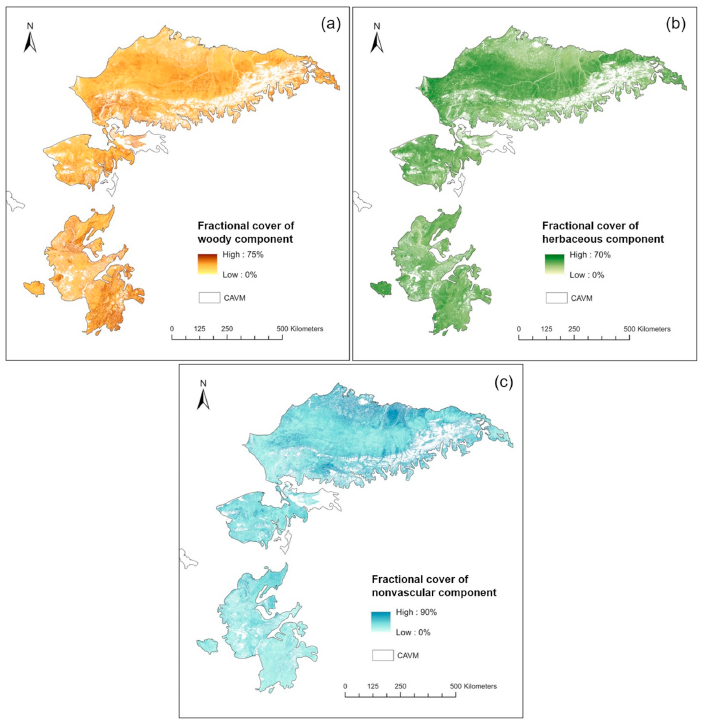
Figure 4. Fractional cover of three major fuel type components across Alaskan tundra: (a) woody, (b) herbaceous, and (c) nonvascular components. (He, et al., 2019)
Data Access
These data are available through the Oak Ridge National Laboratory (ORNL) Distributed Active Archive Center (DAAC).
ABoVE: Distribution Maps of Wildland Fire Fuel Components across Alaskan Tundra, 2015
Contact for Data Center Access Information:
- E-mail: uso@daac.ornl.gov
- Telephone: +1 (865) 241-3952
References
Carroll, M.L., M.R. Wooten, C. Dimiceli, R.A. Sohlberg, and J.R.G. Townshend. 2016. ABoVE: Surface Water Extent, Boreal and Tundra Regions, North America, 1991-2011. ORNL DAAC, Oak Ridge, Tennessee, USA. https://doi.org/10.3334/ORNLDAAC/1324
He, J., T.V. Loboda, L. Jenkins, and D. Chen. 2019. Mapping fractional cover of major fuel type components across Alaskan tundra. Remote Sensing of Environment 232:111324. https://doi.org/10.1016/j.rse.2019.111324
Loboda, T.V., E.E. Hoy, and M.L. Carroll. 2019. ABoVE: Study Domain and Standard Reference Grids, Version 2. ORNL DAAC, Oak Ridge, Tennessee, USA. https://doi.org/10.3334/ORNLDAAC/1527
Walker, D.A., M.K. Raynolds, F.J.A. Daniels, E. Einarsson, A. Elvebakk, W.A. Gould, A.E. Katenin, S.S. Kholod, C.J. Markon, E.S. Melnikov, N.G. Moskalenko, S.S. Talbot, B.A. Yurtsev, the other members of the CAVM Team. 2005. The Circumpolar Arctic vegetation map. Journal of Vegetation Science, 16:267–282. https://doi.org/10.1111/j.1654-1103.2005.tb02365.x