Documentation Revision Date: 2018-12-31
Data Set Version: 1
Summary
Data were collected at three tower sites near Barrow spanning a well-drained wet coastal tundra site at NOAA Climate Monitoring and Diagnostics Laboratory (US-Brw), a medium well-drained wet coastal tundra site on the Barrow Environmental Observatory (US-Beo), and an inundated wet coastal tundra site at the location of the southern end of the previous Biocomplexity Experiment (US-Bes). The tower site at Atqasuk (US-Atq) is sandy, non-acidic, moist tussock tundra, and the tower at Ivotuk (US-Ivo) occupies a southern moist tussock tundra site in the foothills of the Brooks Range.
There are four data files in comma-separated format (.csv) with this data set and one companion file with plot photos.
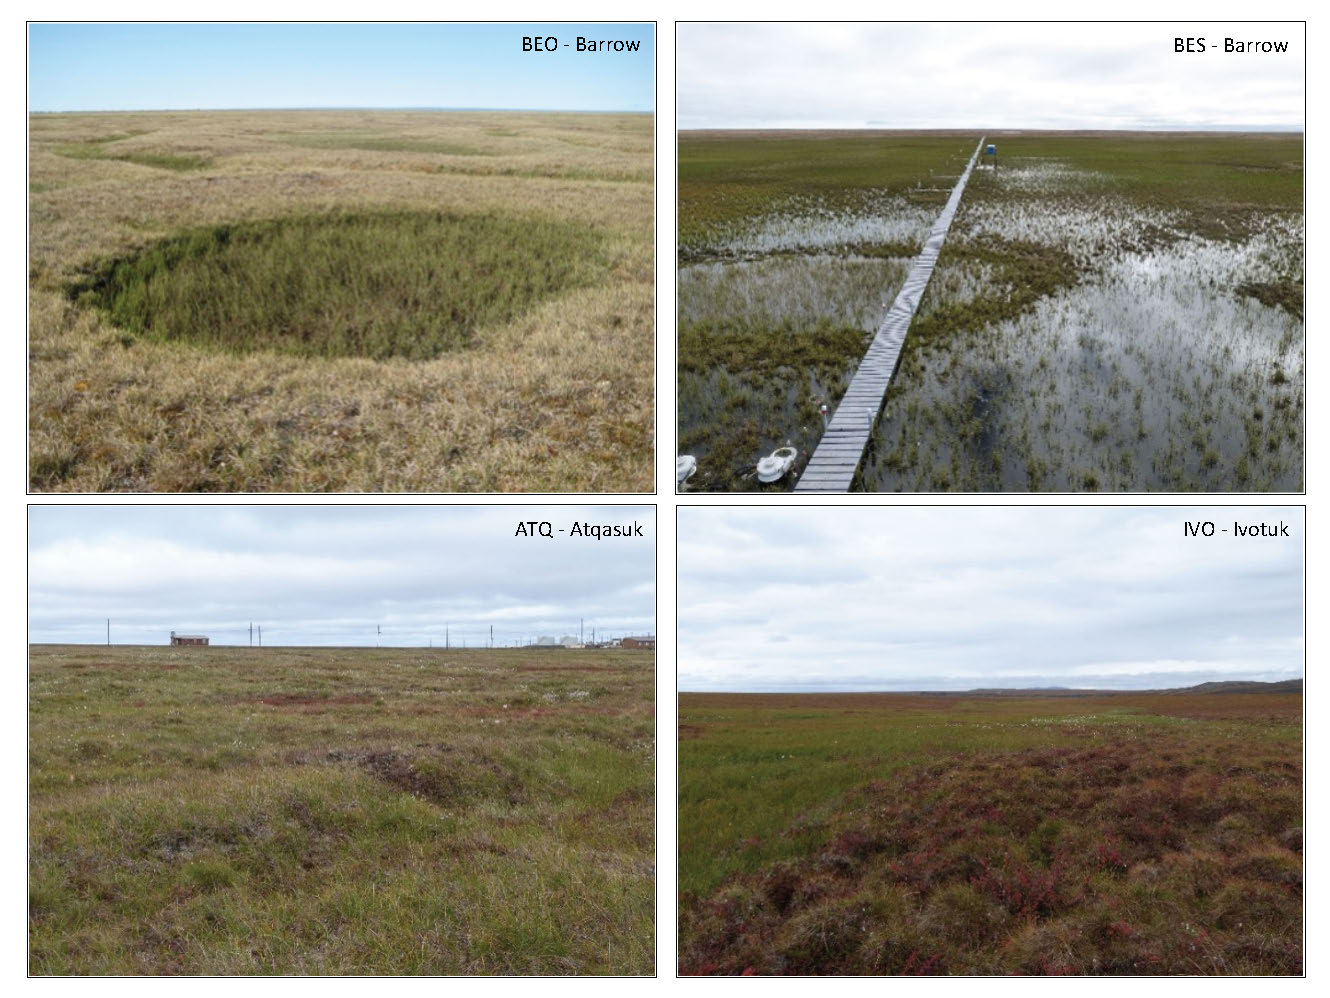
Figure 1. Land cover types and topography at the flux tower field sites at Barrow, Atqasuk and Ivotuk, Alaska
Citation
Davidson, S.J., and D. Zona. 2018. Arctic Vegetation Plots in Flux Tower Footprints, North Slope, Alaska, 2014. ORNL DAAC, Oak Ridge, Tennessee, USA. https://doi.org/10.3334/ORNLDAAC/1546
Table of Contents
- Data Set Overview
- Data Characteristics
- Application and Derivation
- Quality Assessment
- Data Acquisition, Materials, and Methods
- Data Access
- References
Data Set Overview
This data set provides vegetation, environmental, and soil data collected from plots located in the footprints of eddy covariance flux towers along a 300 km north-south latitudinal gradient from Barrow, to Atqasuk, and to Ivotuk across the North Slope of Alaska in 2014. Within each of the five flux tower footprints, 1x1-m quadrats were placed subjectively within widespread habitat or micro-habitat types to map the dominant vegetation communities and site environmental factors. Specific attributes included species cover data and environmental, soil and spectral data (active layer thaw depth, moss layer depth, organic horizon layer depth, standing water depth, soil moisture status, vegetation height, LAI).
Data were collected at three tower sites near Barrow spanning a well-drained wet coastal tundra site at NOAA CMDL (US-Brw), a medium well-drained wet coastal tundra site on the Barrow Environmental Observatory (US-Beo), and an inundated wet coastal tundra site at the location of the southern end of the previous Biocomplexity Experiment (US-Bes). The tower site at Atqasuk (US-Atq) is sandy, non-acidic, moist tussock tundra, and the tower at Ivotuk (US-Ivo) occupies a southern moist tussock tundra site in the foothills of the Brooks Range
The Pre-ABoVE vegetation plot datasets were curated to create the Alaska Arctic Vegetation Archive (AVA-AK; Walker et al. 2016b, Walker 2013). The AVA-AK is a regional database that is part of the larger Arctic Vegetation Archive (Walker 2016a, Walker et al. 2013, Walker and Raynolds 2011). The database contains vegetation plots from homogeneous plant communities with tables of cover or cover-abundance scores for all species and accompanying environmental site data. Field data were collected using Braun-Blanquet, US National Vegetation Classification protocols, or comparable methods.
Project: Arctic-Boreal Vulnerability Experiment (ABoVE)
The Arctic-Boreal Vulnerability Experiment (ABoVE) iis a NASA Terrestrial Ecology Program field campaign that will take place in Alaska and western Canada between 2016 and 2021. Climate change in the Arctic and Boreal region is unfolding faster than anywhere else on Earth. ABoVE seeks a better understanding of the vulnerability and resilience of ecosystems and society to this changing environment.
Related Publications:
Davidson, S.J., V. L. Sloan, G. K. Phoenix, R. Wagner, J. P. Fisher, W. Oechel and D. Zona. 2016. Vegetation type dominates the spatial variability in CH4 Emissions across multiple arctic tundra landscapes. Ecosystems 19:1116-1132. https://doi.org/10.1007/s10021-016-9991-0
Davidson, S. J., M. J. Santos, V. Sloan, J. D. Watts, W. C. Oechel, and D. Zona. 2016. Mapping Arctic Tundra Vegetation Communities Using Field Spectroscopy and Multispectral Satellite Data in North Alaska, U.S.A. Remote Sensing. 8(12):978; https://doi.org/10.3390/rs8120978
Related Dataset:
Zona, D., W. Oechel, C.E. Miller, S.J. Dinardo, R. Commane, J.O.W. Lindaas, R.Y-W. Chang, S.C. Wofsy, C. Sweeney, and A. Karion. 2016. CARVE-ARCSS: Methane Loss From Arctic- Fluxes From the Alaskan North Slope, 2012-2014. ORNL DAAC, Oak Ridge, Tennessee, USA. https://doi.org/10.3334/ORNLDAAC/1300
Acknowledgements:
These data files were edited by Donald A. Walker, Amy L. Breen and Lisa A. Druckenmiller at the University of Alaska Fairbanks' Alaska Geobotany Center and obtained via the Arctic Geoecological Atlas (http://arcticatlas.geobotany.org/), which provides access to existing Arctic vegetation plot and map data in support of the ABoVE campaign.
Data Characteristics
Spatial Coverage: Flux tower sites across a 300 km north-south latitudinal gradient from Barrow, to Atqasuk, and to Ivotuk across the North Slope of Alaska
ABoVE Grid Location:
Domain: Core ABoVE region
State/territory: Alaska
Grid cells:
Barrow: Ahh1Avv0Bh2Bv1
Atqasuk: Ah01v00Bh01v01
Ivotuk: Ahh1Avv0Bh1Bv2
Spatial Resolution: Point resolution. Each plot had an area of 1 square meter.
Temporal Coverage: 20140718 to 20140731
Temporal Resolution: Each plot was sampled once.
Study Area: (All latitude and longitude given in decimal degrees)
|
Site |
Westernmost Longitude |
Easternmost Longitude |
Northernmost Latitude |
Southernmost Latitude |
|---|---|---|---|---|
|
Flux tower sites at Barrow, Atqasuk, and Ivotuk, Alaska |
-157.4143 |
-155.7467 |
71.3250 |
68.4850 |
Eddy Covariance Flux Tower Locations
|
Site |
Latitude |
Longitude |
Tower Site Description |
|---|---|---|---|
|
BES |
71.28088 |
-156.596467 |
Barrow-BES tower (US-Bes) is located 10 km east of the town of Barrow, Alaska at the Barrow Environmental Observatory reserve. Elevation 3 m ASL. Instrument height 2 m. Vegetation at the site consists of moist acidic tundra - wet sedges, grasses, moss, and assorted lichens. |
|
BEO |
71.281001 |
-156.61235 |
Barrow-BEO tower is located 10 km east of the town of Barrow, Alaska at the Barrow Environmental Observatory reserve. Elevation 3 m ASL. Instrument height 3 m. Vegetation at the site consists of moist acidic tundra - wet sedges, grasses, moss, and assorted lichens. |
|
CMDL |
71.280881 |
-156.596467 |
Barrow-CMDL tower (US-Brw) is located 10 km east of the town of Barrow, Alaska, adjacent to the NOAA CMDL Laboratory. Elevation 4 m ASL. Instrument height 5 m. Vegetation at the site consists of moist acidic tundra - wet sedges, grasses, moss, and assorted lichens. |
|
ATQ |
70.469622 |
-157.408947 |
Atqasuk tower (US-Atq) is located 100 km south of Barrow. Elevation 25 m ASL. Instrument height 2 m. Vegetation at the site is a variety of moist-wet coastal sedge tundra and moist-tussock tundra surfaces in the more well-drained upland. |
|
IVO |
68.48649 |
-155.75022 |
Ivotuk tower (US-Ivo) is located 300 km south of Barrow at 579 m elevation in polar tundra. Instrument height 4 m. |
Data File Information
This data set includes four data files: flux_tower_zona_enivronmental_data.csv, flux_tower_zona_soil_data.csv, flux_tower_zona_spectral_data.csv, flux_tower_zona_species_cover_data.csv and one companion file: flux_tower_zona_Photos.pdf. File contents are described in Table 1.
Table 1. Data and companion files
| Data File Name | Description |
|---|---|
| flux_tower_zona_species_data.csv | This file contains species cover data for the vegetation plots at the Flux Towers (Barrow, Atqasuk, Ivotuk) |
| flux_tower_zona_spectral_data.csv |
This file contains the leaf area index of Ivotuk vegetation plots |
| flux_tower_zona_soil_data.csv | This file contains the soils data consisting of soil pH, depths of mosses and organic layer,thaw depth, and soil moisture in a range of two depths (ground surface and at 15 cm) for the vegetation plots at the Flux Towers (Barrow, Atqasuk, Ivotuk) |
| flux_tower_zona_enivronmental_data.csv | This file contains comprehensive set of environmental data for the vegetation plots at the Flux Towers (Barrow, Atqasuk, Ivotuk) |
| Companion File Name | Description |
| Flux_Tower_Zona_Veg_Plots_Photos.pdf | Photos of the individual plots at Barrow, Atqasuk, & Ivotuk. |
Data Descriptions: The column names, their units and descriptions for each of the .csv data files are listed below.
Table 1. File flux_tower_zona_species_cover_data.csv
| Column Numbers | Column Name | Units | Description |
| 1 | PASL_TAXON_SCIENTIFIC_NAME_NO_AUTHORS | Current Taxonomy according to the Panarctic Species List (PASL) | |
| 2 | PASL_TAXON_SCIENTIFIC_NAME_WITH_AUTHOR(S) | Current Taxonomy according to the Panarctic Species List (PASL) includng authors names | |
| 3 | DATASET_TAXON | Dataset taxonomy | |
| 4 to 143 | TURBOVEG_NUMBER/PLOT_NUMBER |
Column headings correspond to the plot sites that were surveyed at the Flux Towers. Barrow: BEO, BES, CMDL Atqasuk: ATQ, and Ivotuk: IVO |
Table 2. File flux_tower_zona_spectral_data.csv
| Column Name | Units | Description |
| PLOT_NUMBER | Plot number where the soil sample was collected | |
| LEAF_AREA_INDEX | Leaf Area Index for the plot |
Table 3. File flux_tower_zona_soil_data.csv
| Column Name | Units | Description |
| PLOT_NUMBER | Plot number where the soil sample was collected | |
| SOIL_PH | PH of the soil sample | |
| DEPTH_TO_BASE_OF_GREEN_MOSS_CM | cm | Depth to the base of the green moss layer in the soil in the plots |
| BROWN_MOSS_LAYER_THICKNESS_CM | cm | Thickness of the green moss layer within the soil in the plots |
| DEPTH_TO_BASE_OF_BROWN_MOSS_CM | cm | Depth to the base of the brown moss layer in the soil in the plots |
| ORGANIC_HORIZON_THICKNESS_CM | cm | Thickness of the organic layer within the soil in the plots |
| DEPTH_TO_BASE_OF_ORGANIC_SOIL_CM | cm | Depth to the base of the organic layer in the soil in the plots |
| THAW_DEPTH_CM | cm | Depth to permafrost of the plots |
| SOIL_MOISTURE_0_5_CM_PERCENT | % | Soil moisture content within the top 5 cm of soil in the plots |
| SOIL_MOISTURE_15_20_CM_PERCENT | % | Soil moisture content within the top 15-20 cm of soil in the plots |
Table 4. File flux_tower_zona_enivronmental_data.csv
| Column Name | Units | Description |
| SURVEY_DATE | YYYYMMDD | Date of survey |
| MICROTOPOGRAPHY | Description of topography | |
| LATITUDE | Decimal Degrees | Latitude of the center of the plots |
| LONGITUDE | Decimal Degrees | Longitude of the center of the plots |
| GPS_ACCURACY_M | m | GPS accuracy |
| COMMUNITY_NAME | Name of the vegetation community | |
| SOIL_PH | PH of the soil within the plots | |
| ORGANIC_LAYER_THICKNESS_CM | cm | Thickness of the organic layer within the soil in the plots |
| DEPTH_OF_STANDING_WATER_CM | cm | Depth of standing water within the plots |
| VEGETATION_MEAN_HEIGHT_CM | cm | Mean height of vegetation within the plots |
| HERB_LAYER_HEIGHT_CM | cm | Height of the herb layer within the plots |
| cm | Height of moss within the plots | |
| TREE_COVER_PERCENT | % | Percentage of tree cover in the plot |
| SHRUB_COVER_PERCENT | % | Percentage of shrub cover in the plot |
| TALL_SHRUB_COVER_PERCENT | % | Percentage of tall shrub cover in the plot |
| LOW_SHRUB_COVER_PERCENT | % | Percentage of low shrub cover in the plot |
| DWARF_SHRUB_COVER_PERCENT | % | Percentage of dwarf shrub cover in the plot |
| PROSTRATE_DWARF_SHRUB_COVER_PERCENT | % | Percentage of dwarf shrub cover in the plot |
| GRAMINOID_COVER_PERCENT | % | Percentage of graminoid cover in the plot |
| TUSSOCK_GRAMINOID_COVER_PERCENT | % | Percentage of tussock graminoid cover in the plot |
| FORB_COVER_PERCENT | % | Percentage of forb cover in the plot |
| SEEDLESS_VASCULAR_PLANT_COVER_PERCENT | % | Percentage of seedless vascular plant cover in the plot |
| MOSS_COVER_PERCENT | % | Percentage of moss cover within the plots |
| LICHEN_COVER_PERCENT | % | Percentage of lichen cover in the plot |
| CRUSTOSE_LICHEN_COVER_PERCENT | % | Percentage of crustose lichen cover in the plot |
| ALGAE_COVER_PERCENT | % | Percentage of algae cover in the plot |
| SOIL_COVER_PERCENT | % | Percentage of soil cover in the plot |
| ROCK_COVER_PERCENT | % | Percentage of rock cover in the plot |
| WATER_COVER_PERCENT | % | Percentage of water cover in the plot |
| LITTER_COVER_PERCENT | % | Percentage of litter cover in the plot |
| TOTAL_VEGETATION_COVER_PERCENT | % | Percentage of total vegetation cover in the plot |
| LOCATION_REMARKS | Remarks |
Application and Derivation
The vegetation and spectral data were used to model the relationships between gross primary productivity, dissolved organic carbon, and CH4 fluxes which resulted in the finding that vegetation types are an important consideration when modeling CH4 emissions. Improved understanding of tundra vegetation distributions will also provide necessary insight into the ecological processes driving plant community assemblages in Arctic environments (Davidson et al., 2016a).
Quality Assessment
No specific quality assessment information provided.
Data Acquisition, Materials, and Methods
Plot Selection
Field surveys were conducted at five tower eddy covariance field sites across the North Slope of Alaska between 18 and 31 July 2014 (Davidson et al., 2016b).
Within each flux tower footprint, five or ten 1 x 1 m quadrats were placed subjectively within a widespread habitat or a micro-habitat type, as identified during initial walkover surveys.
- At the Barrow-BEO site, habitats consist of polygon rims, low centers (ponds), flat centers, high centers and wet troughs (50 quadrats).
- At the Barrow-BES site, quadrats were placed close to a boardwalk crossing a drained lake basin (10 quadrats).
- At the Barrow-CMDL site, habitats were polygon high centers and troughs, and a relatively flat homogenous area unaffected by thaw lake processes (20 quadrats).
- At Atqasuk-ATQ site, habitats included polygon low centers and ridges on sandy soils (30 quadrats).
- Ivotuk-IVO habitats comprise a stable plateau, wet meadows on the margin of a watercourse, and a north-west facing slope (30 quadrats).
Differential GPS coordinates were obtained for each plot on the date of survey.
Vegetation Surveys
The vegetation within the flux collars was subsequently surveyed at peak season (Ivotuk 18th July 2014, Barrow-BEO 22nd July 2014, Barrow-BES 23rd July 2014, Atqasuk 29th July 2014).
Percentage cover of all vascular and non-vascular plant species was recorded as 0.1 (present), 1 (occasional, few individuals) or 3 (occasional, more individuals), and to the nearest 5% thereafter (Davidson et al., 2016b).
Vascular plant identifications were made in the field according to Hultén (1968), and non-vascular plant identifications according to Vitt et al. (1988) respectively.
Environmental, Soil, and Spectral Data
Environmental, soils and spectral data (active layer thaw depth, moss layer depth, organic horizon layer depth, standing water depth, soil moisture status, vegetation height, LAI (Ivotuk)) were collected in the field.
- Thaw depth was measured with a metal rod with cm gradations. Values are averages of 3 - 5 measurements per plot.
- Green/brown moss and organic layer thickness were measured from a block cut with a 30 cm bread knife.
- Soil moisture was measured with a TDR 300 (FieldScout, Spectrum Technologies, Aurora, IL, USA) with 5 cm probes, measured once at top of soil (ground surface below any loose moss) and once at 15 cm depth, inserting head of probe through a knife slit.
- Leaf area index of the Ivotuk plots was measured with an LAI 2000 Plant Canopy Analyzer (LI-COR, Lincoln, USA), Ninety degree view cap, one above for reference, and four below measurements (N, S, E, W from plot center). These data are only available for Ivotuk because the vegetation elsewhere is either too short and sparse to measure reliably, or plots were in deep standing water.
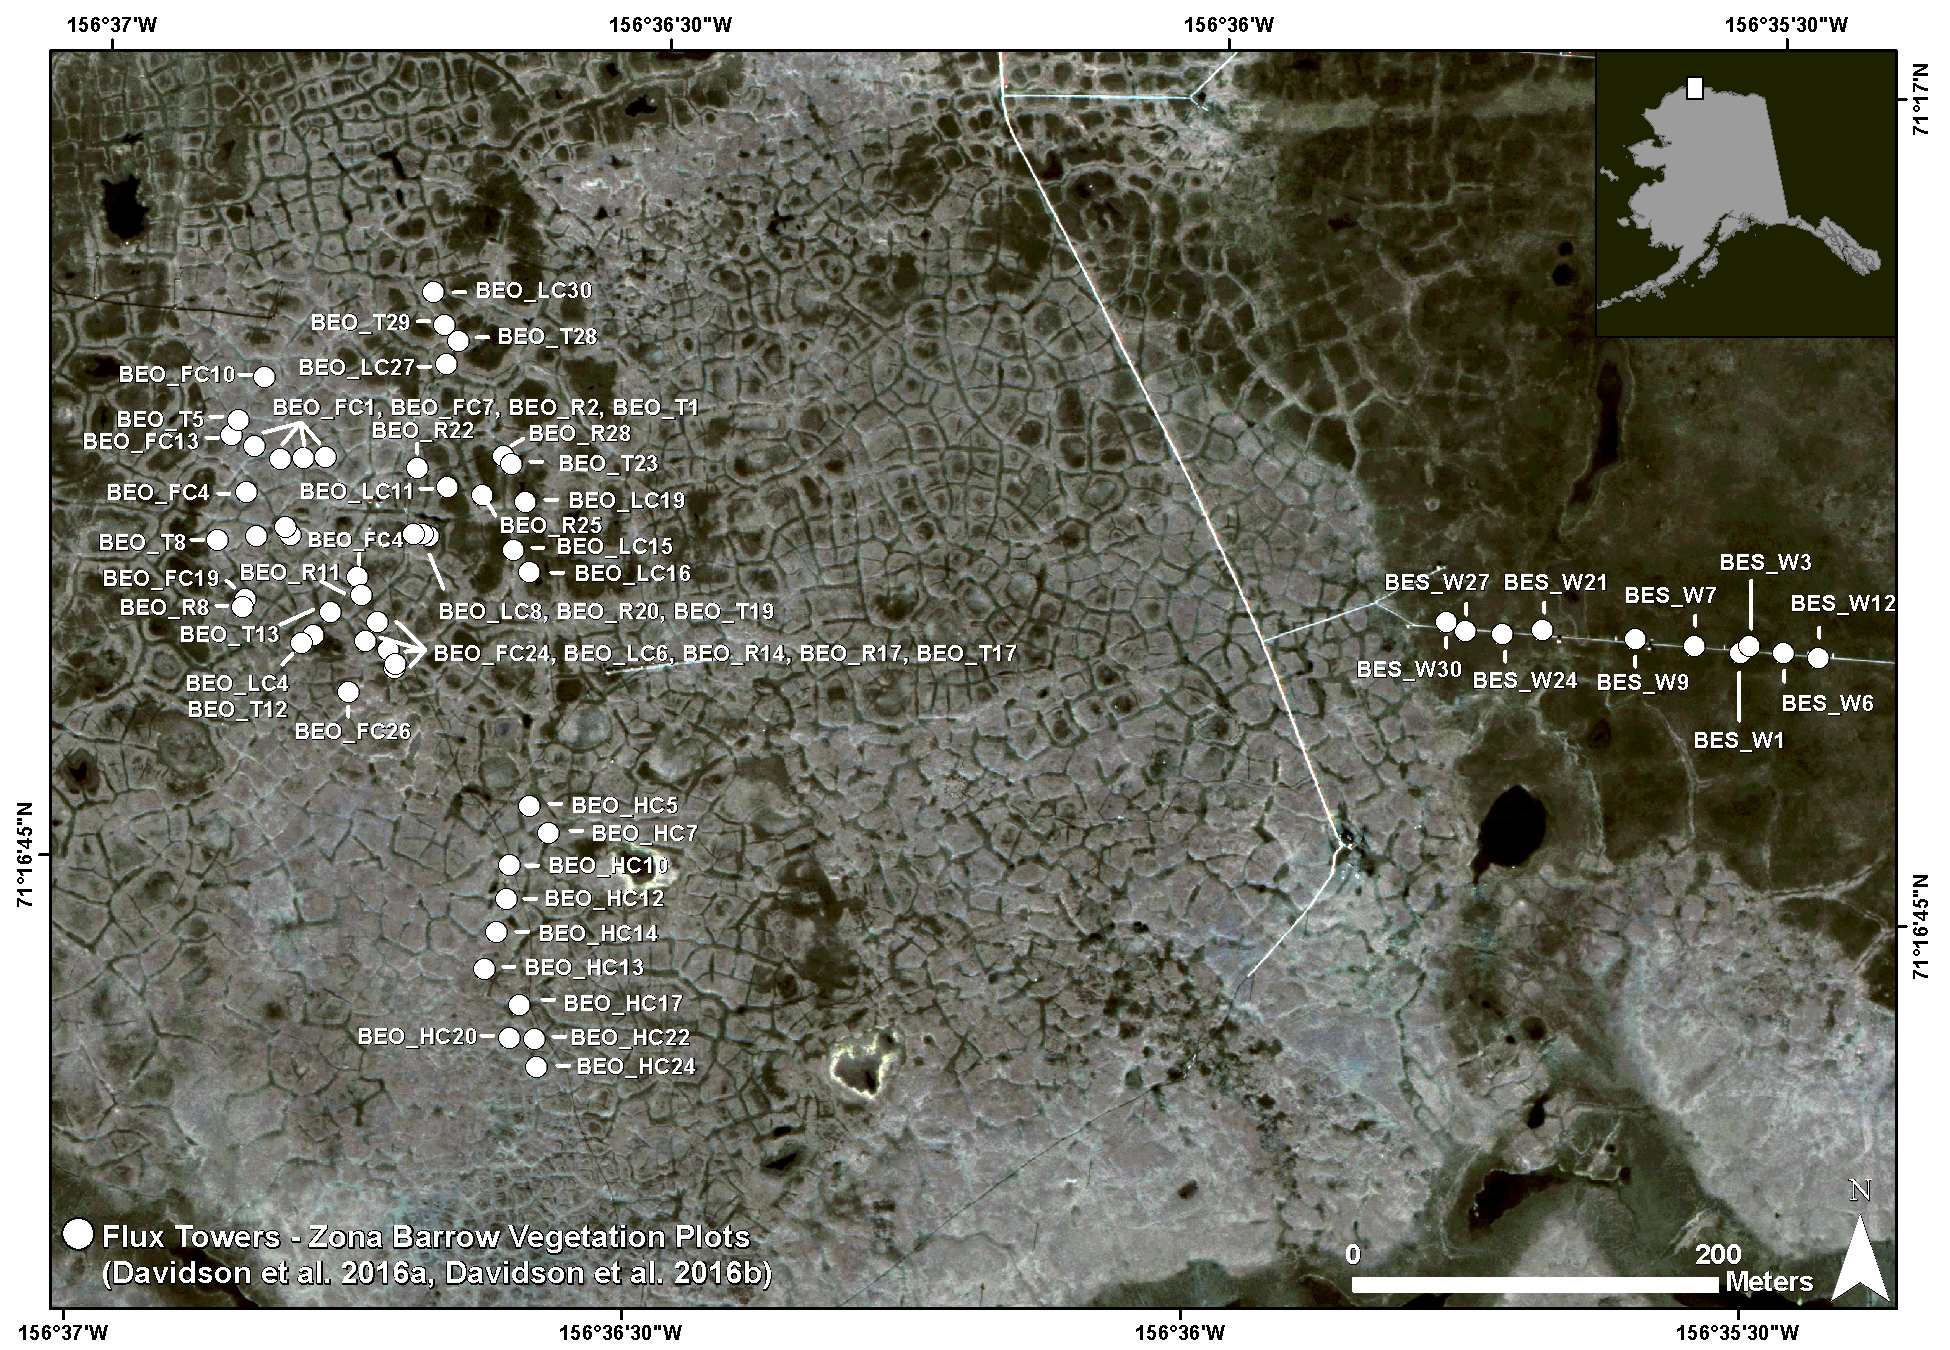
Figure 2: Location of the Barrow Environmental Observatory Flux Tower (BEO) and Barrow Biocomplexity Experiment South Tower (BES) sites.
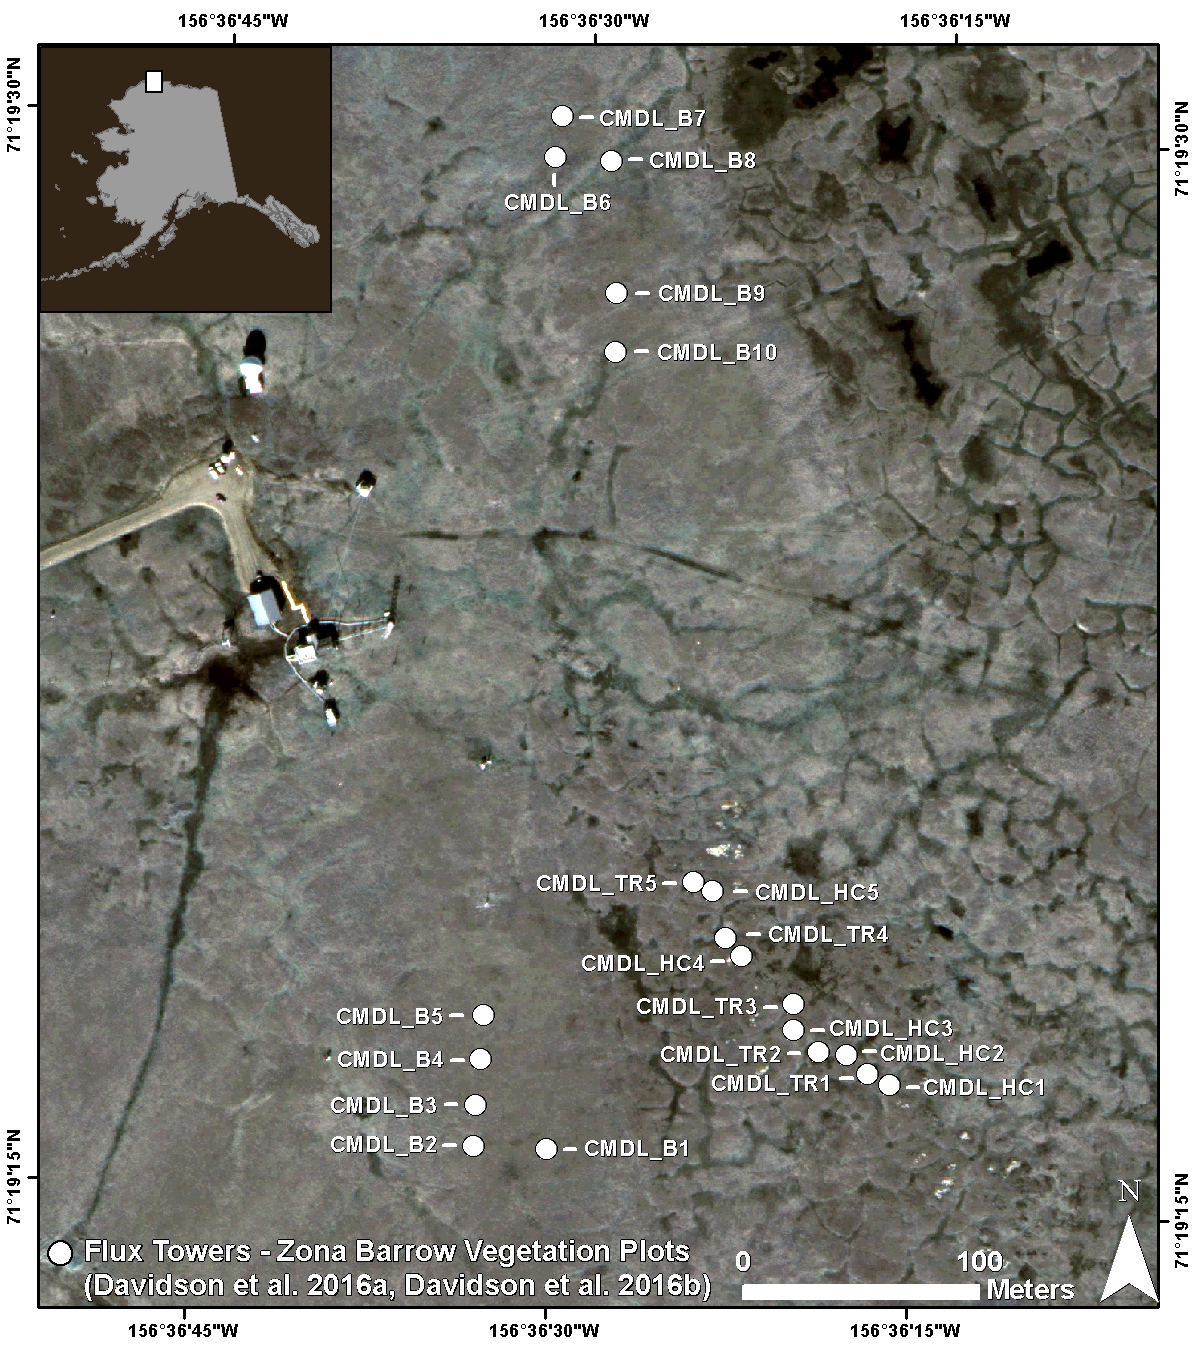
Figure 3: Location of the Climate Monitoring and Diagnostics Laboratory Flux Tower (CMDL) sites
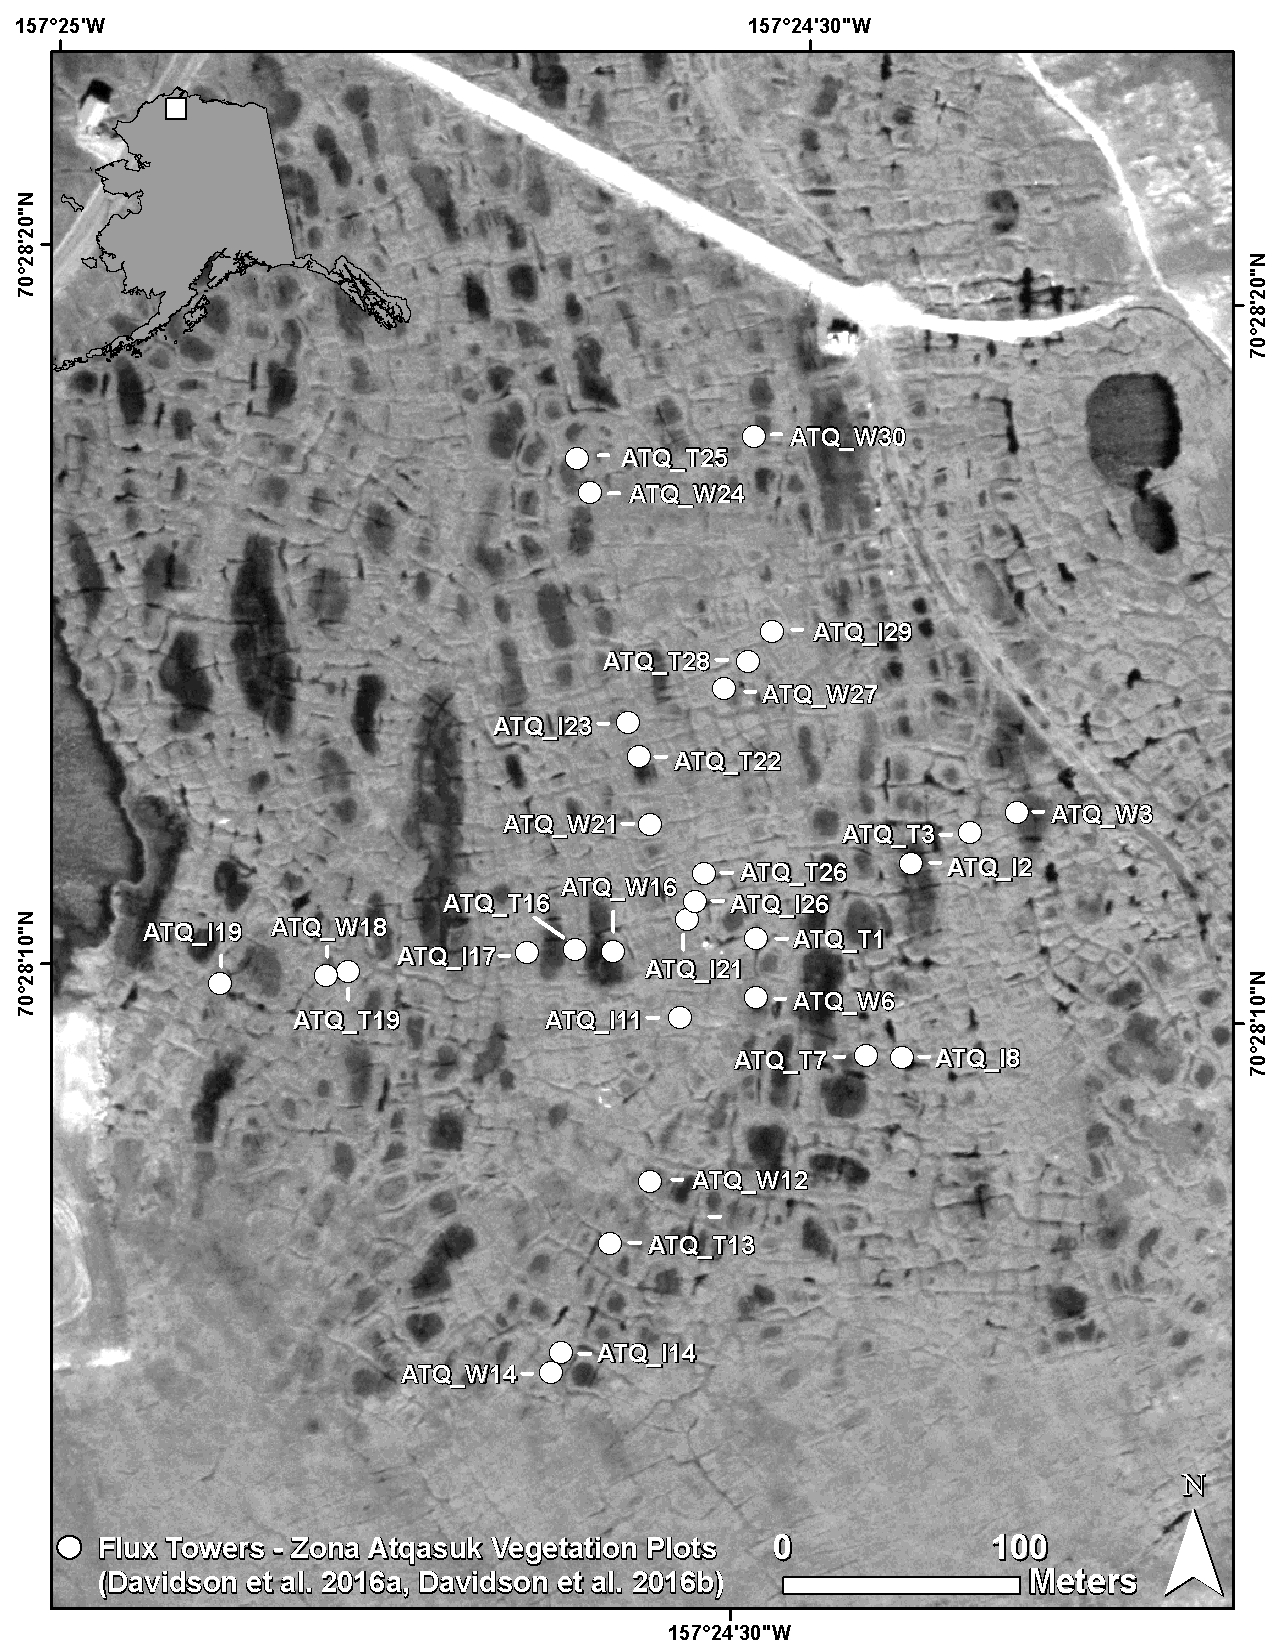
Figure 4: Location of the Atqasuk sites
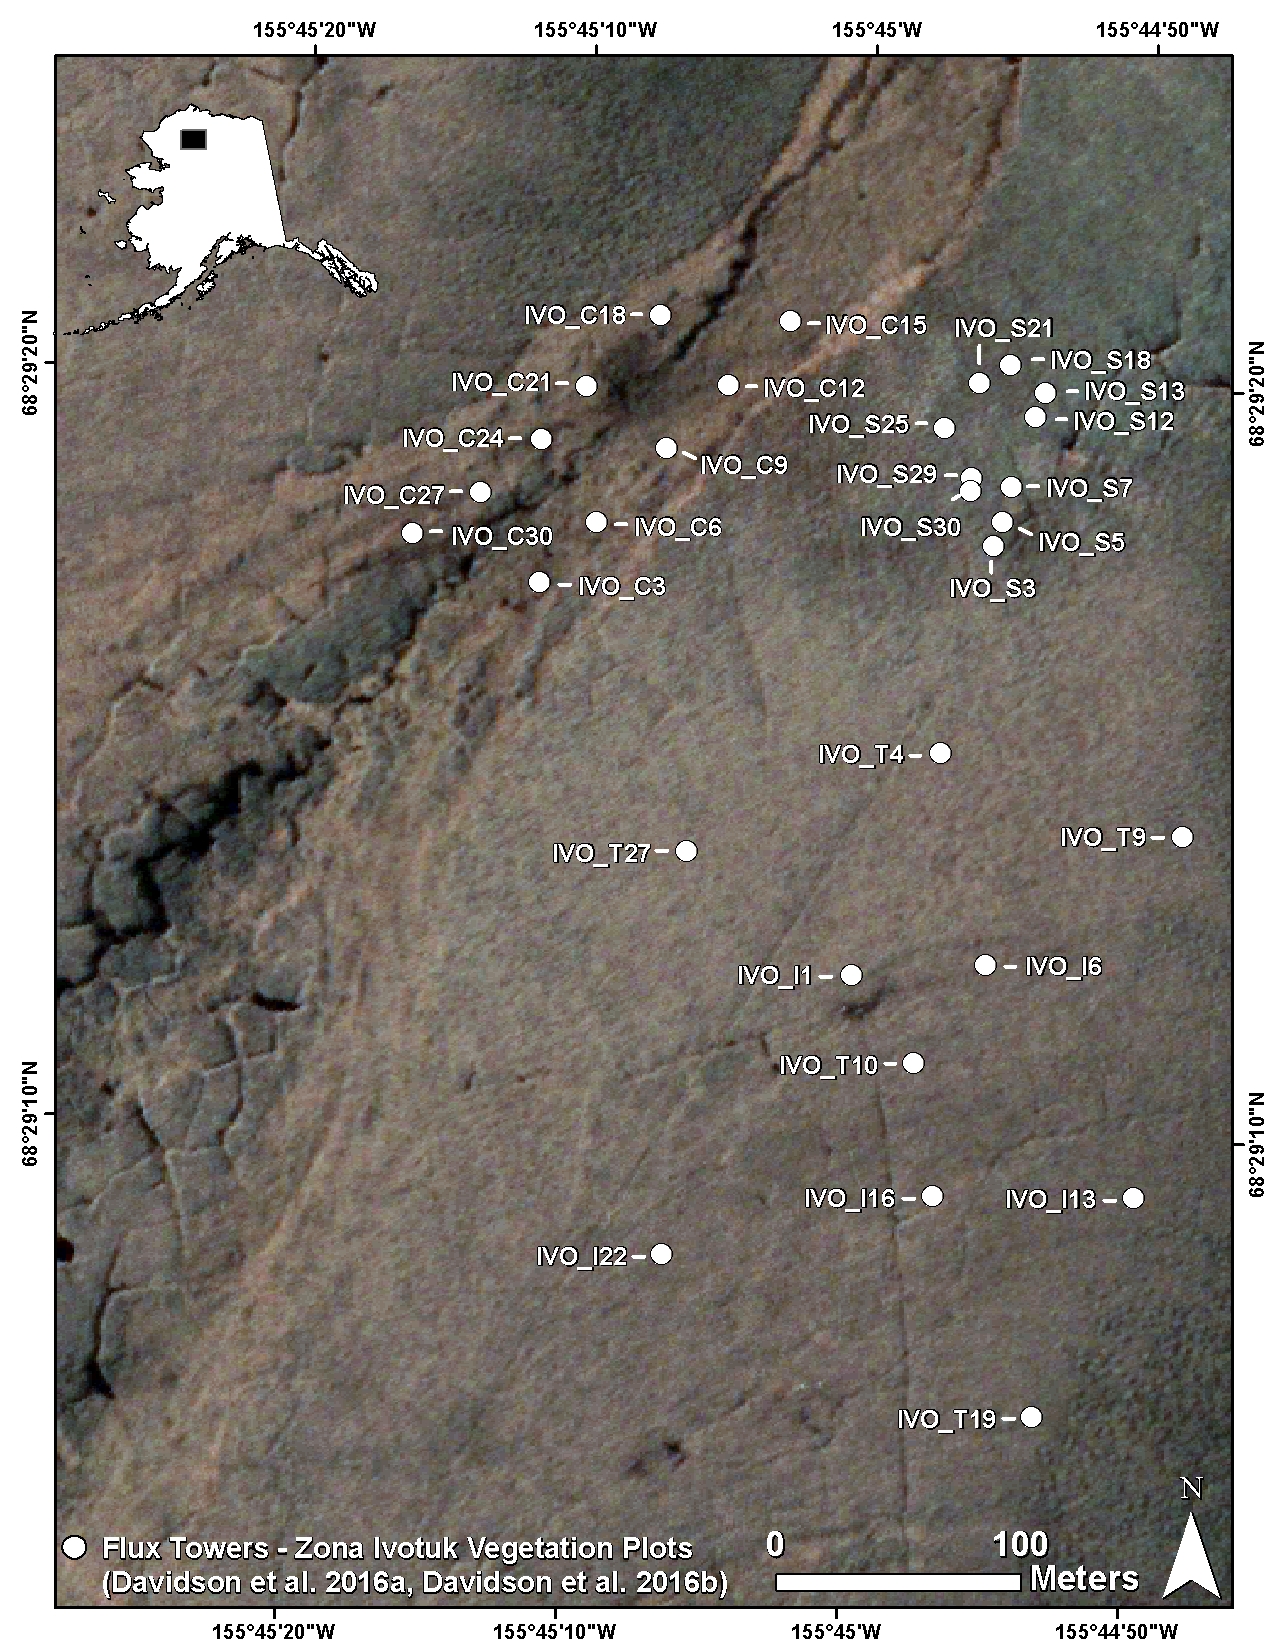
Figure 5: Location of the Ivotuk sites
Data Access
These data are available through the Oak Ridge National Laboratory (ORNL) Distributed Active Archive Center (DAAC).
Arctic Vegetation Plots in Flux Tower Footprints, North Slope, Alaska, 2014
Contact for Data Center Access Information:
- E-mail: uso@daac.ornl.gov
- Telephone: +1 (865) 241-3952
References
Davidson, S.J., V. L. Sloan, G. K. Phoenix, R. Wagner, J. P. Fisher, W. Oechel and D. Zona. 2016. Vegetation type dominates the spatial variability in CH4 Emissions across multiple arctic tundra landscapes. Ecosystems 19:1116-1132. https://doi.org/10.1007/s10021-016-9991-0
Davidson, S. J., M. J. Santos, V. Sloan, J. D. Watts, W. C. Oechel, and D. Zona. 2016. Mapping Arctic Tundra Vegetation Communities Using Field Spectroscopy and Multispectral Satellite Data in North Alaska, U.S.A. Remote Sensing. 8(12):978; https://doi.org/10.3390/rs8120978
Hultén, E. Flora of Alaska and Neighboring Territories; Stanford University Press: Palo Alto, CA, USA, 1968.
Vitt, D.H.; Marsh, J.E.; Bovey, R.B. Mosses, Lichens, and Ferns of Northwest North America; Lone Pine: Edmonton, AB, Canada, 1998.