Documentation Revision Date: 2019-01-18
Data Set Version: 1
Summary
The exact location and area of each study site was determined by the overlap of the imagery selected. Channel areas were defined by including contiguous pixels classified as non-vegetated in any of the years considered, including the main channel, side channels, and barren land. Narrow channels (< 60-m wide) and any areas affected by cloud cover were manually excluded.
There are 81 data files with this dataset: 74 files in GeoTIFF (.tif) format with the erosion and colonization data, five shapefiles with respective study area footprints, and two shapefiles with study area cloud masks. Shapefiles are compressed in *.zip format.
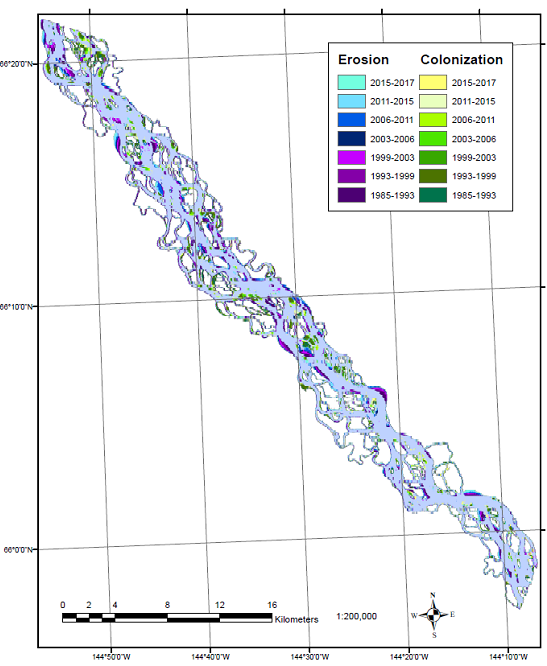
Figure 1. Riverbank erosion and vegetation colonization at the Yukon River 1 study area, located along the Middle Yukon River between Circle and Fort Yukon, Alaska, for multi-year intervals spanning the years 1985-2017.
Citation
Brown, D.R.N. 2019. ABoVE: Riverbank Erosion and Vegetation Changes, Yukon River Basin, Alaska, 1984-2017. ORNL DAAC, Oak Ridge, Tennessee, USA. https://doi.org/10.3334/ORNLDAAC/1616
Table of Contents
- Data Set Overview
- Data Characteristics
- Application and Derivation
- Quality Assessment
- Data Acquisition, Materials, and Methods
- Data Access
- References
Data Set Overview
This dataset provides a time series of riverbank erosion and vegetation colonization along reaches of the Yukon River (3 study areas), Tanana and Nenana Rivers (1 area), and Chandalar River (1 area) in interior Alaska over the period 1984-2017. The change data were derived from selected 30-m images from Landsat TM, Landsat ETM+, and Landsat Operational Land Imager (OLI) surface reflectance products. Image classification used the Normalized Differenced Vegetation Index (NDVI) with an NDVI threshold of 0.2 to differentiate vegetated from non-vegetated pixels. Images were assigned to one of seven or eight multiyear intervals, within the 1984-2017 overall range, for each study area. Time intervals vary by study site. Change detection identified shifts from one time interval to the next: changes from vegetated to non-vegetated classes were considered riverbank erosion and changes from non-vegetated to vegetated classes were considered vegetation colonization.
The exact location and area of each study site was determined by the overlap of the imagery selected. Channel areas were defined by including contiguous pixels classified as non-vegetated in any of the years considered, including the main channel, side channels, and barren land. Narrow channels (< 60-m wide) and any areas affected by cloud cover were manually excluded.
Project: Arctic-Boreal Vulnerability Experiment
The Arctic-Boreal Vulnerability Experiment (ABoVE) is a NASA Terrestrial Ecology Program field campaign based in Alaska and western Canada between 2016 and 2021. Research for ABoVE links field-based, process-level studies with geospatial data products derived from airborne and satellite sensors, providing a foundation for improving the analysis and modeling capabilities needed to understand and predict ecosystem responses and societal implications.
Acknowledgments
This research received funding from the NASA Terrestrial Ecology Program, grant number NNX15AT72A, and the National Science Foundation, grant number 1518563.
Data Characteristics
Spatial Coverage: Five study areas along reaches of the Yukon (three areas), Tanana and Nenana, and Chandalar Rivers in interior Alaska.
ABoVE Reference Locations:
Domain: Core ABoVE
State/territory: Alaska
Grid cell(s): Ah1Av0bh7bv4, Ah1Av0bh7bv5
Spatial resolution: 30 m
Temporal coverage:
| Dataset: 1984-08-12 to 2017-09-08 |
| Individual Study Areas |
| Chandalar River: 1984-2017 |
| Tanana and Nenana Rivers: 1986-2016 |
| Yukon River-1: 1985-2017 |
| Yukon River-2: 1984-2017 |
| Yukon River-3: 1985-2016 |
Temporal resolution: Variable multi-year intervals within the overall date range.
Study Areas (All latitude and longitude given in decimal degrees)
|
Site |
Westernmost Longitude |
Easternmost Longitude |
Northernmost Latitude |
Southernmost Latitude |
|---|---|---|---|---|
| Yukon River Basin, Alaska |
-161.4575 |
-143.305 |
68.135556 |
61.915 |
Data file information
There are 81 data files with this dataset. Seventy-four files provide vegetation colonization and erosion data in GeoTIFF (.tif) format. Seven shapefiles (compressed in .zip format) provide footprints of study areas and cloud masks.
Table 1. File names and descriptions
| Data File Names | Descriptions |
| site_colonization_YYYY-YYYY.tif | Vegetation colonization data where site = ChandalarRiver, TananaNenanaRivers, YukonRiver1, YukonRiver2, or YukonRiver3, and YYYY-YYYY is the temporal coverage of the data |
| site_erosion_YYYY-YYYY.tif | Erosion data where site= ChandalarRiver, TananaNenanaRivers, YukonRiver1, YukonRiver2, or YukonRiver3, and YYYY-YYYY is the temporal coverage of the data |
| site_channel.zip | Footprints of study areas in shapefile format, site= ChandalarRiver, TananaNenanaRivers, YukonRiver1, YukonRiver2, or YukonRiver3 |
| site_cloud.zip | Cloud masks (two files) in shapefile format where site = TananaNenanaRivers or YukonRiver3. |
| Companion File | |
| LandsatImagery_DatesSatellitesSensors.csv | This file provides the dates of imagery acquisition and the associated Landsat satellite/sensor for each study area |
Properties of the GeoTIFFs
Spatial Representation Type: Raster
Number of Bands: 1
Resolution: 30 m
Colonization Files:
No Data Value: 3
Classes:
0: no change
1: colonized
Erosion Files:
No Data Value: -128
Classes:
-1: eroded
0: no change
Spatial and coordinate system properties of the GeoTIFFS and the shapefiles: EPSG Projection (authority: ESRI): 102001
Shapefiles
The shapefiles (.shp) provide footprints of the five study areas that align with the analysis areas of the erosion and colonization GeoTIFF files: Chandalar River, Tanana and Neenana Rivers, and for the three individual Yukon River areas.
There are also two cloud masks provided in .shp format; one for the Tanana and Neenana River areas, and one the Yukon River study areas.
Shapefile Properties: Bands: 1, Scaling: 1, Map units: meters
Application and Derivation
Societal implications
The study was important to communities along the river study areas, and to environmental policies regarding climate change and effects. Community members report that channel change has affected access to subsistence resources, traveler safety, and local economies. Rural communities in the region are heavily reliant on reliable river travel for subsistence, travel to adjacent communities and traditional camps, and for barge delivery of commercial goods. The temporal variation in rates of riverbank erosion yielded important insight into hydroclimatic controls over erosion, and ultimately how the riverine landscape is influenced by climate change (Brown et al, in review).
Quality Assessment
Not provided.
Data Acquisition, Materials, and Methods
Study area
The study area is within the Alaskan portion of the Yukon River Basin. The descriptions of the basin herein were derived from the overview by Brabets et al. (2000). The majority of the basin has a continental subarctic climate. Basin-wide mean annual air temperatures are below < 0° C, with seasonal temperature extremes ranging from < - 50° C to > +33 °C. Annual precipitation averages ~480 mm, with snowfall accounting for about half of the annual precipitation. The region is typically composed of boreal forest vegetation, and is predominantly underlain by discontinuous permafrost, but also includes areas of sporadic and continuous permafrost.
The rivers of focus in this study include the Yukon River and two of its tributaries, the Tanana and Chandalar Rivers. Study sites were chosen near communities along the rivers. The Yukon River flows from northwestern Canada through interior Alaska into the Bering Sea, draining an area of ~855,000 km2. The Tanana River drains the north side of the glaciated Alaska Range, with a ~115,000 km2 basin underlain by discontinuous permafrost. The Chandalar River drains the south side of the Brooks Range. The Chandalar River basin is ~35,000 km2 and is underlain by continuous permafrost.

Figure 2. Locations of the study areas in the Yukon River Basin from provided Shapefiles. The Yukon 1 Study Area is easternmost.
Extended subfreezing temperatures reduce discharge in winter. In the Chandalar River, winter streamflow is negligible, whereas groundwater discharge maintains wintertime low flow in the Yukon and Tanana Rivers. River ice break-up is followed by a spring freshet characterized by a rise in streamflow from snowmelt. The Yukon and Chandalar Rivers both exhibit a snowmelt-dominated runoff pattern, where streamflow peaks with spring freshet and declines throughout the summer and fall, with secondary peaks occurring as a result of precipitation events. The hydrologic regime of the Tanana River is influenced by glacial meltwater, which causes a sustained increase in discharge throughout the summer before receding in the fall and is also influenced by precipitation events (Brown et al, in review).
Scene selection
Areas of riverbank erosion and vegetation colonization within channels were mapped and quantified over multiyear time intervals between 1984 and 2017. Landsat satellite imagery from Thematic Mapper (TM), Enhanced Thematic Mapper Plus (ETM+), and Operational Land Imager (OLI) sensors were acquired from the United States Geological Survey (USGS) (http://earthexplorer.usgs.gov). Multiple criteria were used for compiling imagery. Scenes with significant cloud cover, haze, or smoke were excluded, as were scenes with missing data due to scan-line corrector failure. Timing within the hydrologic year (October 1 – September 30), water levels, plant phenology, and snow cover was also a consideration. Ideally, images would be acquired towards the end of the hydrologic year in order to capture the majority of changes that occurred within that year; however, the scenes must be acquired before plant senescence or snowfall. Scenes with high water levels where flooding of vegetated areas was observed were excluded. From the compilation of all imagery meeting these criteria from 1984-2017, images were selected for change detection over multiple time periods. The number of time periods considered were maximized while keeping the length of the periods as consistent as possible. The magnitude of change over time also needed to appropriately match the spatial resolution of the imagery. Because the pixel size of 30-m is typically larger than the scale of most riverbank erosion within a year, multiple years of change were needed for adequate change detection. The number and length of intervals selected were constrained by the availability of suitable imagery (Brown et al, in review). Refer to the companion file LandsatImagery_DatesSatellitesSensors.csv for the Landsat image acquisition dates for each study area.
The exact location and area of each study site was determined by the overlap of the imagery selected. The channel areas were defined by including contiguous pixels that were classified as non-vegetated in any of the years considered, including the main channel, side channels, and barren land. Narrow channels (< 60-m wide) and any areas affected by cloud cover were manually excluded.
Image classification and change detection
Image classification was conducted using thresholds of NDVI products derived from atmospherically corrected surface reflectance products processed by the U.S. Geological Survey (USGS 2017). Pixels with NDVI ≥ 0.2 were classified as vegetated, and pixels with NDVI < 0.2 were classified as non-vegetated (Carlson and Ripley 1997). Areas of riverbank erosion were defined by all pixel-based changes from vegetated to non-vegetated classes within the channel area, including banks, islands, and bars. Conversely, areas of vegetation colonization were defined by pixel-based changes from non-vegetated to vegetated classes (Brown et al, in review). Geoprocessing for this project was conducted with ArcMap 10 (ESRI, Redlands, California).
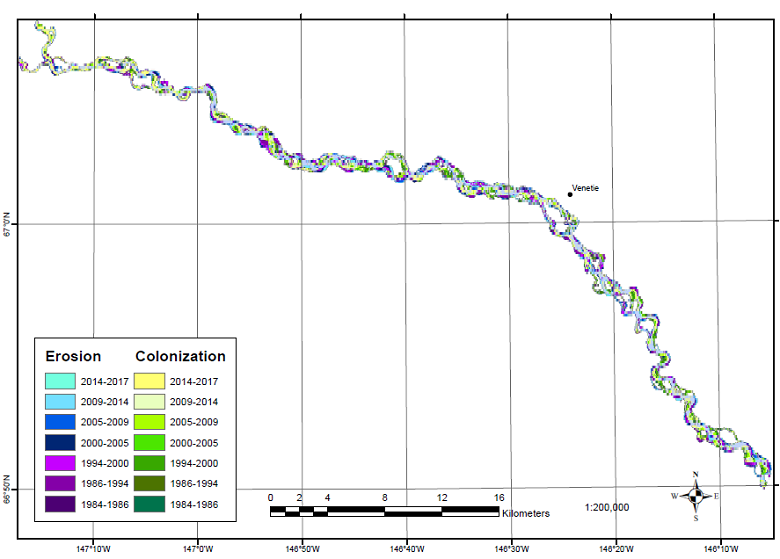
Figure 3. Riverbank erosion and vegetation colonization along the Chandalar River Study Area for multi-year intervals spanning the years 1984-2017.
Data Access
These data are available through the Oak Ridge National Laboratory (ORNL) Distributed Active Archive Center (DAAC).
ABoVE: Riverbank Erosion and Vegetation Changes, Yukon River Basin, Alaska, 1984-2017
Contact for Data Center Access Information:
- E-mail: uso@daac.ornl.gov
- Telephone: +1 (865) 241-3952
References
Brabets, T.P., B. Wang, and R.H. Meade, 2000. Environmental and hydrologic overview of the Yukon River basin, Alaska and Canada. USGS Water-Resources Investigations Report 99-4204.
Brown, D.R.N., Brinkman, T.J., Verbyla, D.L., Bolton, W.R., Hollingsworth, T.N., in review. Impacts of climate change on subarctic riverbank erosion. Environmental Research Letters.
USGS, 2017. Product guide: Landsat Surface Reflectance-derived Indices, Version 3.6, 31pp.