Documentation Revision Date: 2020-02-06
Dataset Version: 1
Summary
Daily air temperature data were from a National Oceanic and Atmospheric Administration (NOAA) weather station at Galena and water level data were also from a United States Geological Survey (USGS) water gauge station on the Yukon River at Galena. Leaf drop dates were estimated with the Normalized Differenced Vegetation Index (NDVI) using Moderate Resolution Imaging Spectroradiometer (MODIS) imagery.
There are two data files, daily and annual, in comma-separated (.csv) format with this dataset.
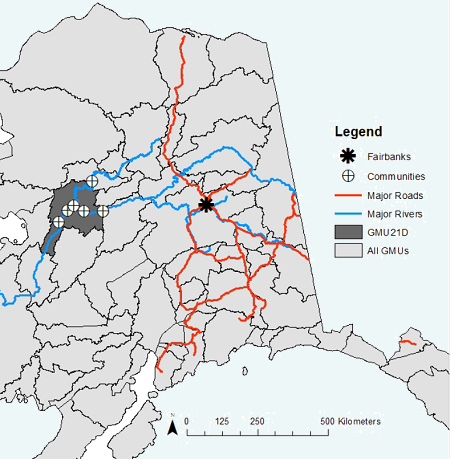
Figure 1. Map of study area communities. GMUs are Game Management Units and GMU21D is highlighted. From Hasbrouck et al., 2019, in process.
Citation
Hasbrouck, T., T.J. Brinkman, G. Stout, K. Kielland, and E. Trochim. 2019. ABoVE: Environmental Conditions During Fall Moose Hunting Seasons, Alaska, 2000-2016. ORNL DAAC, Oak Ridge, Tennessee, USA. https://doi.org/10.3334/ORNLDAAC/1739
Table of Contents
- Dataset Overview
- Data Characteristics
- Application and Derivation
- Quality Assessment
- Data Acquisition, Materials, and Methods
- Data Access
- References
Dataset Overview
This dataset provides daily and annual air temperature, river water level, and leaf drop dates coincident with the moose (Alces alces) hunting season (September) for the area surrounding the rural communities of Nulato, Koyukuk, Kaltag, Galena, Ruby, Huslia, and Hughes in interior Alaska, USA, over the period 2000-2016. The main objective of the study was to assess how the environmental conditions impacted the success of hunters who rely on moose as a subsistence resource.
Daily air temperature data were from a National Oceanic and Atmospheric Administration (NOAA) weather station at Galena and water level data were from a United States Geological Survey (USGS) water gauge station on the Yukon River also located at Galena. Leaf drop dates were estimated with the Normalized Differenced Vegetation Index (NDVI) using Moderate Resolution Imaging Spectroradiometer (MODIS) imagery.
Project: Arctic-Boreal Vulnerability Experiment
The Arctic-Boreal Vulnerability Experiment (ABoVE) is a NASA Terrestrial Ecology Program field campaign based in Alaska and western Canada between 2016 and 2021. Research for ABoVE links field-based, process-level studies with geospatial data products derived from airborne and satellite sensors, providing a foundation for improving the analysis and modeling capabilities needed to understand and predict ecosystem responses and societal implications.
Related Publication:
Hasbrouck, T.R., T.J. Brinkman, G. Stout, E. Trochim, and K. Kielland. Quantifying effects of environmental factors on moose harvest in Interior Alaska. Prepared for submission to Journal of Wildlife Biology (2019, in review).
Acknowledgements: This research was performed with support from NASA ABoVE, Grant NNX15AT72A.
Data Characteristics
Spatial Coverage: Areas surrounding the rural communities of Nulato, Koyukuk, Kaltag, Galena, Ruby, Huslia, and Hughes in interior Alaska
ABoVE Reference Locations:
Domain: Core ABoVE
State/territory: Alaska
Grid cells: Ah00Av00.Bh04Bv03, Ah00Av00.Bh05Bv03, Ah00Av00.Bh05Bv04
Spatial Resolution: Data are considered representative of entire study area.
Temporal Coverage: 2000-01-01 – 2016-12-31
Temporal Resolution: Daily and annual
Study Areas (All latitude and longitude given in decimal degrees)
|
Site |
Westernmost Longitude |
Easternmost Longitude |
Northernmost Latitude |
Southernmost Latitude |
|---|---|---|---|---|
|
Alaska |
-158.532715 |
-156.665039 |
64.932154 |
64.552452 |
Data File Information
There are two data files in comma-separated (.csv) format with this data set:
- daily_hunting_season_environmental_conditions.csv
- annual_hunting_season_environmental_conditions.csv
Table 1. Variables in the file daily_hunting_season_environmental_conditions.csv
Details:
- Missing values are represented as -9999.
- The coordinate bounding box is the same for all observations.
| Variable | Units | Description |
|---|---|---|
| year | YYYY | Year |
| month | Hunting season month (September) | |
| day | Day of month | Day of month – first 25 days of September. (1-25) |
| hunting_week | “hunting week” | Hunting week of season. These are 5-day weeks. (1-5) |
| leaf_drop_early_late | Code: 1 or 2 | Code for earlier than average leaf drop (1) or later than average leaf drop (2). |
| temp_max | Degrees C | Daily maximum air temperature |
| temp_min | Degrees C | Daily minimum air temperature |
| temp_mean | Degrees C | Daily mean air temperature |
| water_level | m.a.s.l. | Daily water level (meters above sea level) |
| latitude_n | Decimal degrees | Study area northernmost latitude |
| latitude_s | Decimal degrees | Study area southernmost latitude |
| longitude_e | Decimal degrees | Study area easternmost latitude |
| longitude_w | Decimal degrees | Study area westernmost latitude |
Table 2. Variables in the file annual_hunting_season_environmental_conditions.csv
Note that the coordinate bounding box is the same for all observations.
| Variable | Units | Description |
|---|---|---|
| year | YYYY | Year |
| high_temp_yr | Degrees C | Maximum air temperature of the year (January - December) |
| mean_max_temp_hunting_season | Degrees C | Mean of maximum air temperatures during week of peak harvest in September |
| mean_waterlevel_hunting_season | m.a.s.l. | Mean water level during week of peak harvest in September. (meters above sea level) |
| low_temp_hunting_season | Degrees C | Lowest temperature during entire hunting season |
| mean_temp_hunting_season | Degrees C | Mean temperature across entire hunting season |
| temp_range | Degrees C | Difference between high_temp_yr and low_temp_hunting_season |
| days_abv_10 | Number of days in year above 10.0 degrees C | |
| days_abv_15.5 | Number of days in year above 15.5 degrees C | |
| leaf_drop_doy | Julian day | Day of year of leaf drop |
| latitude_n | Decimal degrees | Study area northernmost latitude |
| latitude_s | Decimal degrees | Study area southernmost latitude |
| longitude_e | Decimal degrees | Study area easternmost latitude |
| longitude_w | Decimal degrees | Study area westernmost latitude |
Application and Derivation
This study could be used in decision making regarding climate change and environmental policies. The study area surrounded the rural community of Nulato in interior Alaska. Other communities within this area include Koyukuk, Kaltag, Galena, Ruby, Huslia, and Hughes. The communities are isolated and disconnected from the road system. In Nulato, 90% of households report using moose meat during the year (Brown et al. 2010). Hunters who rely on moose as a subsistence resource expressed concern that warmer air temperatures were altering moose behavior, delayed leaf drop was decreasing sightability, and low water levels were limiting access to hunting areas (Hasbrouck et al., 2019, in process).
Quality Assessment
Refer to Hasbrouck et al. (2019, in process) for details on the use of summary statistics for environmental variables and masking of water and handling of cloudy imagery for MODIS NDVI products.
Data Acquisition, Materials, and Methods
Study Area
The study area surrounded the rural community of Nulato in interior Alaska (64.72 N, 158.10 W). Other communities within this area include Koyukuk, Kaltag, Galena, Ruby, Huslia, and Hughes. Moose (Alces alces) hunting season is typically 1-25 September with some variation depending on location and hunt type (Hasbrouck et al., 2019, in process).
Study Design
The objective of this study was to assess how temperature, water levels, and leaf drop date impacted hunter success in Interior Alaska from 2000-2016.
- For the fine-scale daily analyses, water level (m elevation), and mean high temperature (°C) were examined during hunting week “blocks”: 1-5 Sept, 6-10 Sept, 11-15 Sept, 16-20 Sept, and 21-25 Sept. The 5-day block aligned with the frequency of day of leaf drop from remote sensing analysis.
- For the coarse scale annual analyses, leaf drop day of year, mean high temperature (°C), and mean water level (m elevation) was used. High temperature was used instead of mean temperature in order to capture the temperature hunters were likely to witness during daylight hunting hours.
Air Temperature
Daily air temperature data were from Galena, Alaska (60km east of Nulato) and acquired from the National Oceanic and Atmospheric Administration (NOAA 2018). High temperature was used during the hunting season and during the week of peak moose harvest within each year. For example, if peak harvest occurred on 16 September then the average temperature from 12-20 September was calculated.
Leaf Drop Data
Google Earth Engine (GEE) was used to analyze fall phenology from 2000-2016. Normalized Difference Vegetation Index (NDVI) was calculated from MODIS imagery from August 20 – September 29. NDVI was calculated using imagery from the Aqua Surface Reflectance Daily L2G dataset (MYD09GQ) and the Terra Surface Reflectance Daily L2G imagery (MOG09GQ) dataset by manipulating Band 1 (red, 0.62-0.67 µm) and Band 2 (near infrared, 0.841-0.876 µm). Water was masked using the Global Surface Water dataset. All pixels were summed and averaged across the landscape to determine the daily landscape average NDVI. Days with flawed imagery due to clouds received NDVI values that were interpolated from NDVI values from the day before and the day after the particular image.
For each year, the mean day of year (DOY) was flagged that exhibited NDVI below 0.6 as the date of peak leaf drop. The long-term mean date of leaf drop was calculated, and confidence intervals were used to identify years as “early” or “late” leaf drop years (Hasbrouck et al., 2019, in process).
Water Levels
Water level data were from the United States Geological Survey water gauge station on the Yukon River in Galena, Alaska (USGS, 2019). The gauging station records water level as meters above sea level. The mean water level during the hunting season and during the week of peak harvest within each year were considered. As an example, if peak harvest occurred on September 16 then the average water level was calculated from September 12-20. It was assumed that an increase or decrease in water level caused a similar shift in tributaries and acknowledged that this does not account for other factors that affect access into sloughs (e.g. riverbank erosion, sedimentation) (Hasbrouck et al., 2019, in process).
Data Access
These data are available through the Oak Ridge National Laboratory (ORNL) Distributed Active Archive Center (DAAC).
ABoVE: Environmental Conditions During Fall Moose Hunting Seasons, Alaska, 2000-2016
Contact for Data Center Access Information:
- E-mail: uso@daac.ornl.gov
- Telephone: +1 (865) 241-3952
References
Brown, C.L., A.R. Brenner, H. Ikuta, E.H. Mikow, B. Retherford, L.J. Slayton, A. Trainor, 2010. The harvest and uses of wild resources in Mountain Village, Marshall, Nulato, Galena, and Ruby, Alaska. Alaska Department of Fish and Game. Technical Paper Number 410.
Gorelick, N. et al. 2017. Google Earth Engine: Planetary-scale geospatial analysis for everyone. Remote Sensing of Environment 202: 18-27. https://doi.org/10.1016/j.rse.2017.06.031
Hasbrouck, T.R., T.J. Brinkman, G. Stout, E. Trochim, and K. Kielland. Quantifying effects of environmental factors on moose harvest in Interior Alaska. Prepared for submission to Journal of Wildlife Biology (2019, in review).
National Oceanic and Atmospheric Administration (NOAA). 2018. Climate data online search. https://www.ncdc.noaa.gov/cdo-web/search. Accessed 25 Oct 2018.
United Stated Geological Survey (USGS). 2019. USGS surface-water daily data for the nation. https://waterdata.usgs.gov/nwis/dv?referred_module=sw&search_criteria=huc2_cd&search_criteria=site_tp_cd&submitted_form=introduction. Accessed August 5th, 2019.