Documentation Revision Date: 2022-03-21
Dataset Version: 1
Summary
There are four data files in GeoTIFF (*.tif) format and four data files GeoPackage (*.gpkg) format included in this dataset. There are also six companion files in comma-separated values (*.csv).
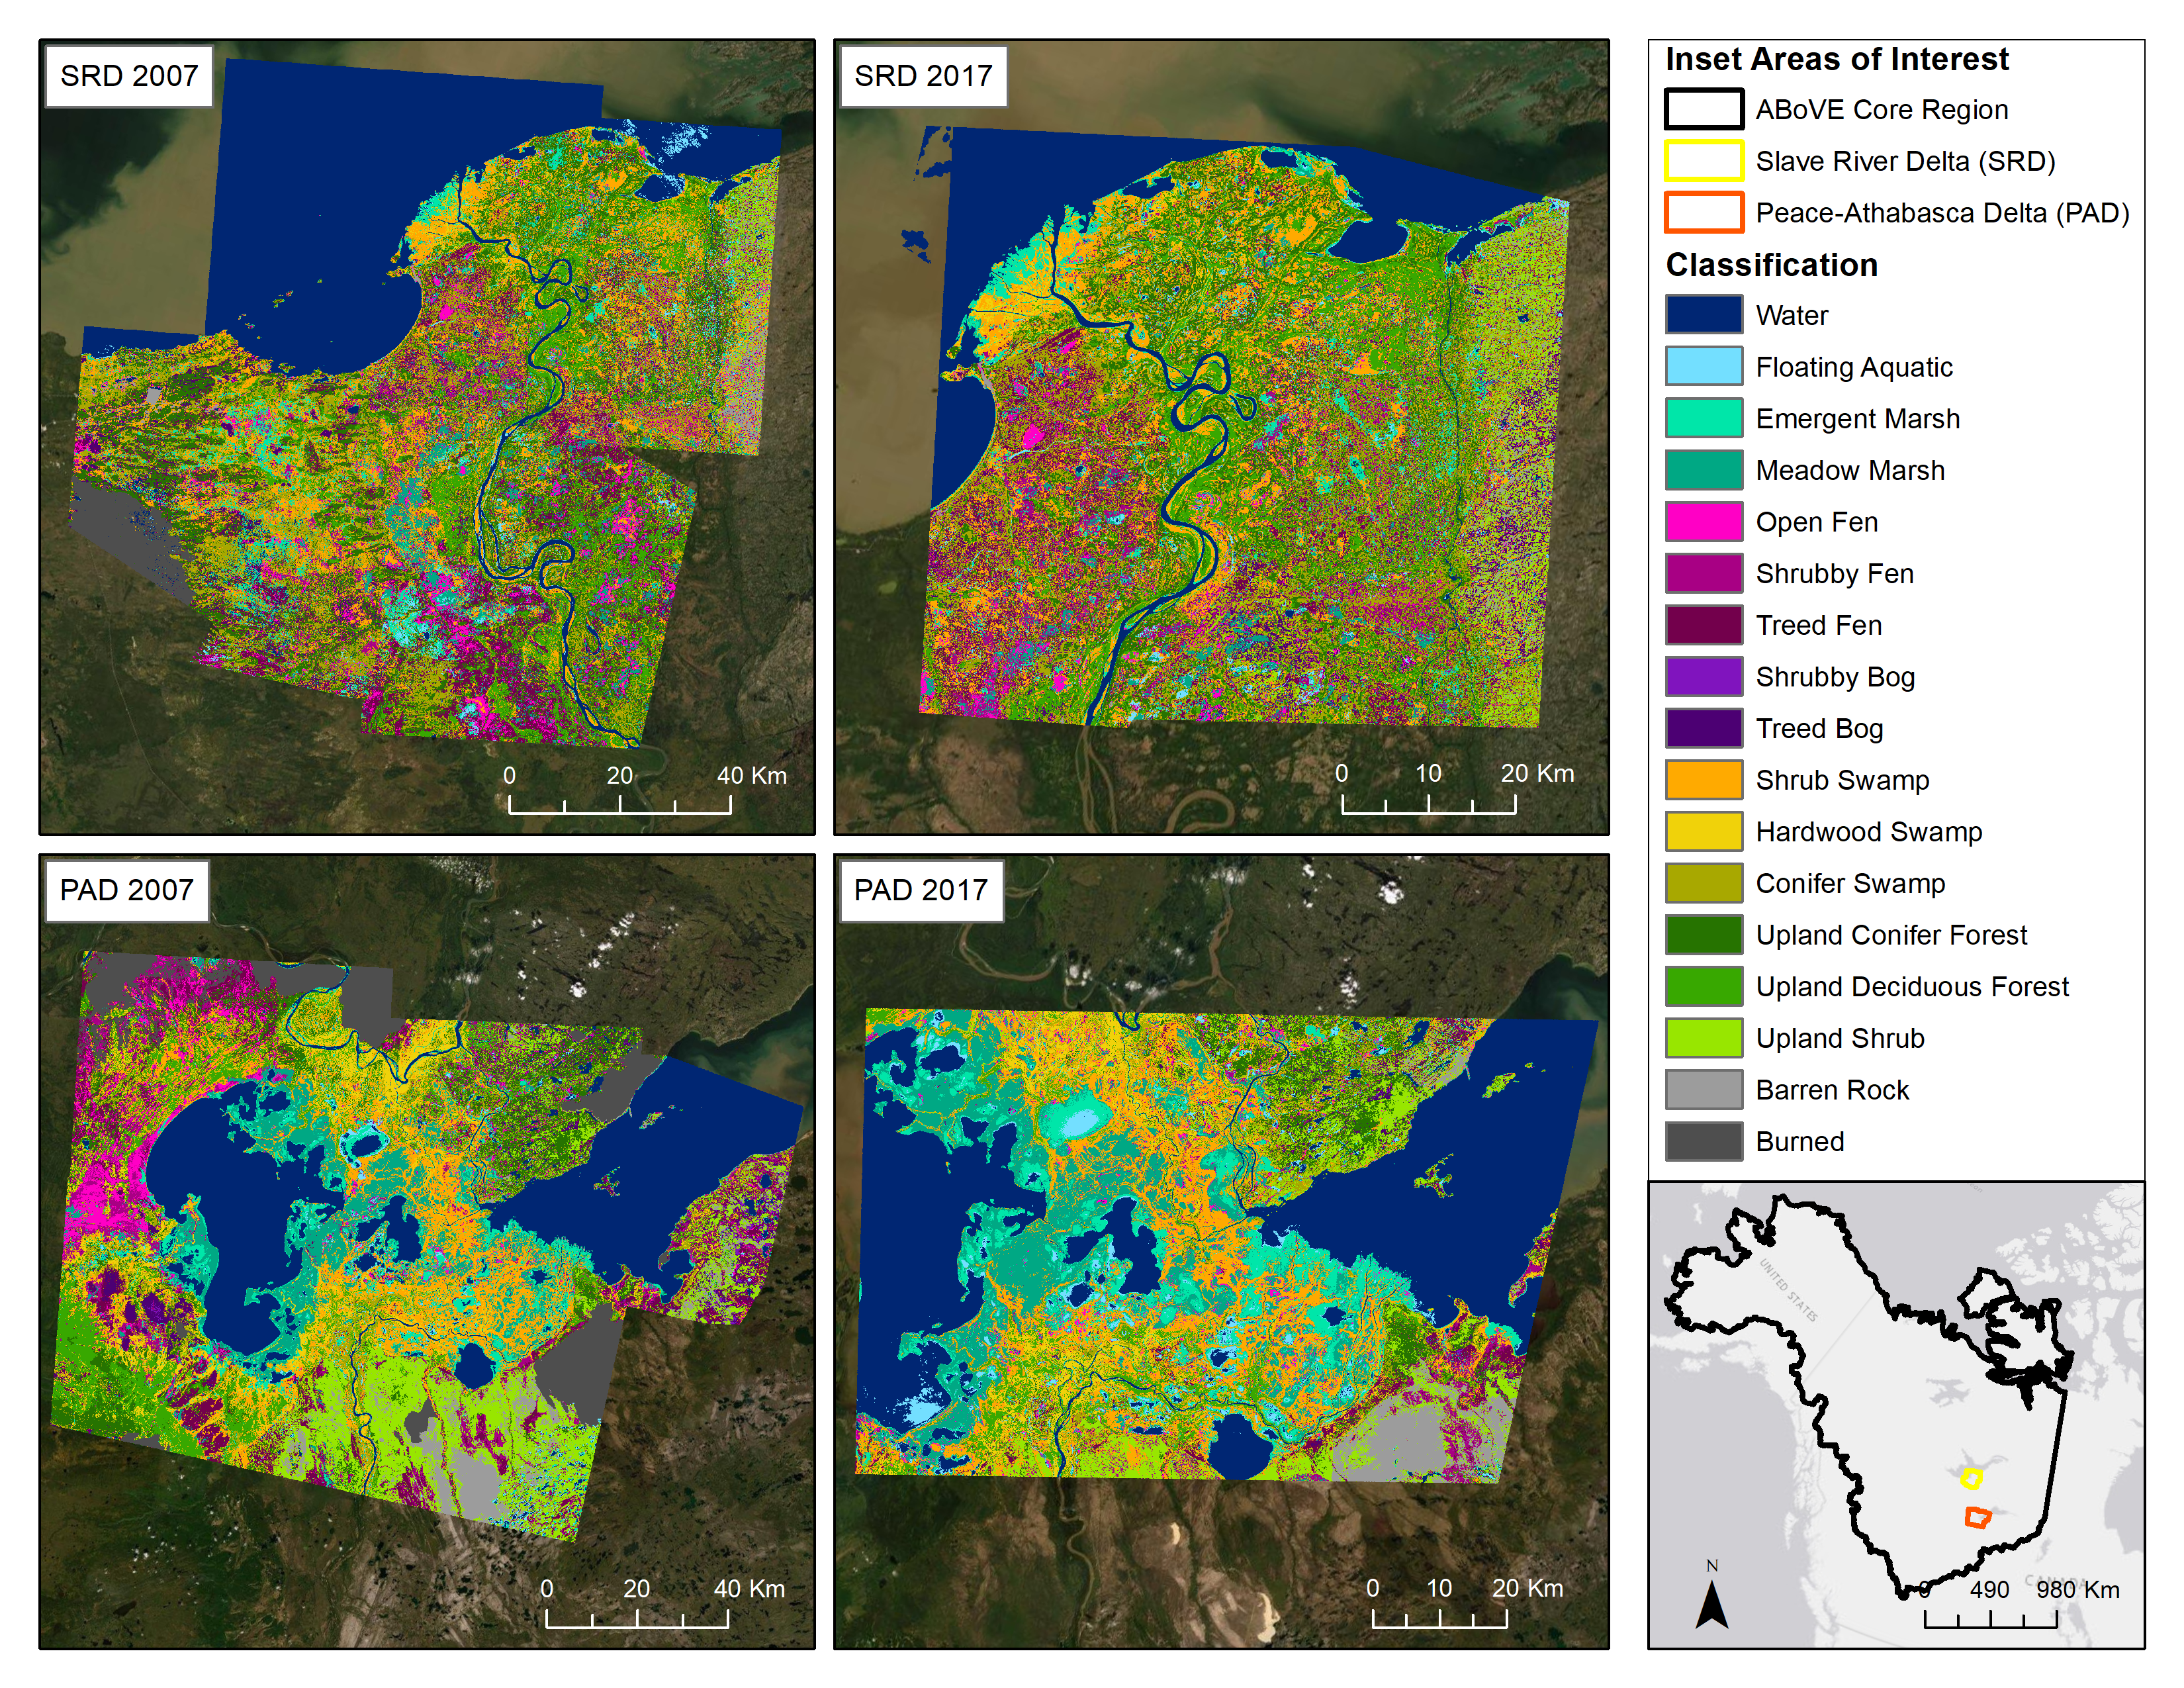
Figure 1. Classified wetland type maps for the Slave River Delta (SRD) and Peace-Athabasca Delta (PAD), Canada circa 2007 and circa 2017.
Citation
French, N.H.F., J.A. Graham, D.J.L. Vander Bilt, L.K. Jenkins, M.J. Battaglia, and L.L. Bourgeau-Chavez. 2022. ABoVE: Wetland Type, Slave River and Peace-Athabasca Deltas, Canada, 2007 and 2017. ORNL DAAC, Oak Ridge, Tennessee, USA. https://doi.org/10.3334/ORNLDAAC/1947
Table of Contents
- Dataset Overview
- Data Characteristics
- Application and Derivation
- Quality Assessment
- Data Acquisition, Materials, and Methods
- Data Access
- References
Dataset Overview
This dataset provides ecosystem-types for the Slave River Delta (SRD) and Peace-Athabasca Delta (PAD), Canada, for the time periods circa 2007 and circa 2017. The image resolution is 12.5 m with 0.2-hectare minimum mapping unit. Included are an 18-class modified Enhanced Wetland Classification (EWC) scheme for wetland, peatland, and upland areas. Classes were derived from a Random Forest classification trained on multi-seasonal moderate-resolution images and synthetic aperture radar (SAR) imagery sourced from aerial and satellite sensors, field data, and calculated indices. Indices included Height Above Nearest Drainage (HAND) and Topographic Position Index (TPI), both derived from a digital elevation model, to differentiate between land cover types. The c. 2007 remote sensing data were comprised of early and late growing season Landsat-5, ERS2, L-Band PALSAR from 2006 to 2010 and growing season Landsat thermal composites. The c. 2017 remote sensing data were comprised of early and late growing season Landsat-8 and L-Band PALSAR-2 from 2017 to 2019, Sentinel-1 June VV and VH mean and standard deviations, and growing season Landsat thermal composites. Elevation indices from multi-resolution TPI and HAND were created from the Japan Aerospace Exploration Agency Advanced Land Observing Satellite 30 m Global Spatial Data Model. Also included are the images used for classification and the classification error matrices for each map and time period. Data are provided in GeoTIFF and GeoPackage file formats.
Project: Arctic-Boreal Vulnerability Experiment
The Arctic-Boreal Vulnerability Experiment (ABoVE) is a NASA Terrestrial Ecology Program field campaign being conducted in Alaska and western Canada, for 8 to 10 years, starting in 2015. Research for ABoVE links field-based, process-level studies with geospatial data products derived from airborne and satellite sensors, providing a foundation for improving the analysis, and modeling capabilities needed to understand and predict ecosystem responses to, and societal implications of, climate change in the Arctic and Boreal regions.
Related Publication
Bourgeau-Chavez, L.L., S. Endres, R. Powell, M.J. Battaglia, B. Benscoter, M. Turetsky, E.S. Kasischke, and E. Banda. 2017. Mapping boreal peatland ecosystem types from multitemporal radar and optical satellite imagery. Canadian Journal of Forest Research 47(4):545–559. https://doi.org/10.1139/cjfr-2016-0192
Related Datasets
Bourgeau-Chavez, L.L., J.A. Graham, S. Endres, N.H.F. French, M. Battaglia, D. Hansen, and D. Tanzer. 2019. ABoVE: Ecosystem Map, Great Slave Lake Area, Northwest Territories, Canada, 1997-2011. ORNL DAAC, Oak Ridge, Tennessee, USA. https://doi.org/10.3334/ORNLDAAC/1695
Bourgeau-chavez, L.L., S. Endres, E. Banda, R.B. Powell, M.R. Turetsky, B. Benscoter, and E.S. Kasischke. 2015. NACP Peatland Landcover Type and Wildfire Burn Severity Maps, Alberta, Canada. ORNL DAAC, Oak Ridge, Tennessee, USA. https://doi.org/10.3334/ORNLDAAC/1283
Acknowledgments
This work was supported by NASA's ABoVE (grant 80NSSC19M0108).
Data Characteristics
Spatial Coverage: Slave River Delta (SRD) and Peace-Athabasca Delta (PAD), Canada
Spatial Resolution: 12.5 m pixel spacing with a 0.2 ha minimum mapping unit
Temporal Coverage: circa 2007 and circa 2017
Temporal Resolution: One-time estimates
Study Area: Latitude and longitude are given in decimal degrees.
| Site | Northernmost Latitude | Southernmost Latitude | Easternmost Longitude | Westernmost Longitude |
|---|---|---|---|---|
| Alberta & Northwest Territory, Canada | 61.7919 | 57.7746 | -109.6433 | -115.2915 |
Data File Information
There are four data files in GeoTIFF (*.tif) format and four data files GeoPackage (*.gpkg) format included in this dataset. There are also six companion files in comma-separated values (*.csv).
The files are generally named <loc><year>_<type>.<ext> (e.g., srd2007_classification.tif), where
<loc> is the sampling location ("pad" or "srd")
<year> is the sampling year ("2007" or "2017")
<type> is the type of data ("classification", "err-mat", or "training-validation"), and
<ext> is the file extension ("csv", "gpkg", or "tif").
Table 1. File names and descriptions.
| File Name | Description |
|---|---|
| Data Files | |
| <loc><year>_classification.tif | Ecosystem type map (see Table 2) for the sampling location <loc> and for the time period <year> |
| <loc><year>_training-validation.gpkg | Training and validation data for the sampling location <loc> and for the time period <year>; includes the ID number for each polygon (fid), the class type ID (type_id), and the assignment to whether the data were used for training or validation (0=training, 1=validation) |
| Companion Files | |
| imagery_<year>.csv | Sensor type and scene name of imagery used for an ecosystem type map for the time period <year> |
| <loc><year>_err-mat.csv | Classification error matrix for the sampling location <loc> for the time period <year> |
Data File Details
Missing values are represented by "0". The Coordinate Reference System is “Canada_Albers_Equal_Area_Conic” (EPSG:102001).
Table 2. Class codes and descriptions in files named <loc><year>_classification.tif that represent the ecosystem classes within the study area.
| Class Code | Class Description |
|---|---|
| 0 | No Data |
| 1 | Water |
| 11 | Floating Aquatic |
| 21 | Emergent Marsh |
| 22 | Meadow Marsh |
| 31 | Open Fen |
| 32 | Shrubby Fen |
| 33 | Treed Fen |
| 42 | Shrubby Bog |
| 43 | Treed Bog |
| 51 | Shrub Swamp |
| 52 | Hardwood Swamp |
| 53 | Conifer Swamp |
| 61 | Upland Conifer Forest |
| 62 | Upland Deciduous Forest |
| 63 | Upland Shrub |
| 71 | Barren Rock |
| 81 | Burned * |
* The Burned class identifies areas of historical fires that are currently undergoing post-fire successional revegetation.
Application and Derivation
This dataset provides wetland maps of the area a decade apart that can be used to better understand change and vulnerability in wetland habitat for waterfowl.
Quality Assessment
To train and validate the Random Forest classification, 2379 polygons, 1387 for 2007, and 992 for 2017, were created and classified using high-resolution satellite imagery and recent field data. 80% of the polygons were used for model training and 20% were used for validation. The final confusion matrix was generated using all reserved validation polygons from the 16 mapping tiles pooled together for testing on the smoothed classified final mosaic. Accuracy assessment based on field-sampled sites shows high overall accuracy (Table 3).
Table 3. The number of polygons used for training and validation and respective map accuracies according to sampling year and location.
| Year | Location | Training Polygons | Validation Polygons | Accuracy | ||
|---|---|---|---|---|---|---|
| Overall | Producer | User | ||||
| 2007 | PAD | 635 | 180 | 95.8% | 86.2% | 85.5% |
| SRD | 465 | 107 | 84.6% | 84.3% | 75.2% | |
| 2017 | PAD | 373 | 100 | 97.8% | 94.1% | 91.6% |
| SRD | 420 | 99 | 88.5% | 84.5% | 80.4% | |
Data Acquisition, Materials, and Methods
Multi-date, multi-sensor remote sensing data were acquired, processed, and stacked to create the wetland type maps. Each data source brings particular strengths to the analysis (Bourgeau-Chavez et al., 2017). Remote sensing data were collected for two seasons, early and late growing seasons to capture phenology changes, and also from multiple sensors to capture hydrology and structure. Data were acquired from the Alaska Satellite Facility (PALSAR, PALSAR2), Google Earth Engine (Landsat thermal composites, Sentinel-1), ESA Online Catalogue (ERS-2), and USGS Earth Explorer (Landsat-5 and 8) (Table 4). Synthetic aperture radar (SAR) data was processed using MapReady software. Elevation indices such as multi-resolution topographic position index (TPI) and height above nearest drainage (HAND) were created from the Japan Aerospace Exploration Agency Advanced Land Observing Satellite 30 m Global Spatial Data Model (GSDM).
Table 4. Details of data sources used to create the ecosystem-type maps.
| Data Source | Data Type and Number | Citation |
|---|---|---|
| ERS-2 | 17 images; early (June, July) and late growing (July-September) season for 2008–2010 | European Space Agency (ESA): European Remote Sensing Satellite 2 (ERS-2) Synthetic Aperture Radar (SAR) data, 2008-2010 (https://esar-ds.eo.esa.int/oads/access/) |
| GSDM | Topographic Position Index (TPI) and Height Above Nearest Drainage (HAND) created from JAXA ALOS 30 m GDSM | Japan Aerospace Exploration Agency (JAXA): ALOS World 3D 30 m DEM. V3.1, April 2020 (https://www.eorc.jaxa.jp/ALOS/en/index_e.htm) |
| Landsat-5 | 11 images; early (May, June) and late (July, August) growing season for 2006–2010 | U.S. Geological Survey (USGS): Landsat-5 imagery from 2006-2010 accessed through USGS Earth Explorer (https://earthexplorer.usgs.gov/) |
| Landsat-8 | 6 images; early (May, June) and late (August) growing season for 2017–2019 | USGS: Landsat-8 imagery from 2017-2019 accessed through USGS Earth Explorer (https://earthexplorer.usgs.gov/) |
| Landsat Thermal Composites | Growing season composite for each time period c. 2007 and c. 2017 | USGS: Landsat-5 and Landsat-8 Level-2 thermal imagery accessed through USGS Earth Explorer (https://earthexplorer.usgs.gov/) |
| L-Band PALSAR | 11 images; early (June, July) and late (August) growing season 2007-2010 | Alaska Satellite Facility (ASF) DAAC: ALOS PALSAR_Radiometric_Terrain_Corrected_high_res from 2007-2010; includes Material JAXA/METI 2007 (https://asf.alaska.edu) |
| L-Band PALSAR-2 | 7 images; June-August 2018 | JAXA: ALOS PALSAR-2 data 2018 (https://www.eorc.jaxa.jp/ALOS/) |
| Sentinel-1 | June VV and VH mean and standard deviation for year 2017 |
ESA: Copernicus Sentinel data 2017 accessed through Google Earth Engine (https://earthengine.google.com/) |
For each area of interest (AOI), data layers were resampled, reprojected, and clipped to align partially overlapping raster datasets of different resolutions and projections into a trimmed stacked composite within the area of mutual overlap. Landsat bands were opened within the AOI extent, cloud masked and filled with supplementary cloud-free Landsat scenes, then resampled and reprojected as needed. Thermal composites, elevation data, and SAR imagery were likewise resampled and reprojected as needed.
See Bourgeau-Chavez et al. (2017) for a detailed discussion of the techniques applied in this study.
Data Access
These data are available through the Oak Ridge National Laboratory (ORNL) Distributed Active Archive Center (DAAC).
ABoVE: Wetland Type, Slave River and Peace-Athabasca Deltas, Canada, 2007 and 2017
Contact for Data Center Access Information:
- E-mail: uso@daac.ornl.gov
- Telephone: +1 (865) 241-3952
References
Bourgeau-Chavez, L.L., S. Endres, R. Powell, M.J. Battaglia, B. Benscoter, M. Turetsky, E.S. Kasischke, and E. Banda. 2017. Mapping boreal peatland ecosystem types from multitemporal radar and optical satellite imagery. Canadian Journal of Forest Research 47(4):545–559. https://doi.org/10.1139/cjfr-2016-0192