Documentation Revision Date: 2023-10-18
Dataset Version: 1
Summary
There are 20 data files in cloud-optimized GeoTIFF (COG) format.
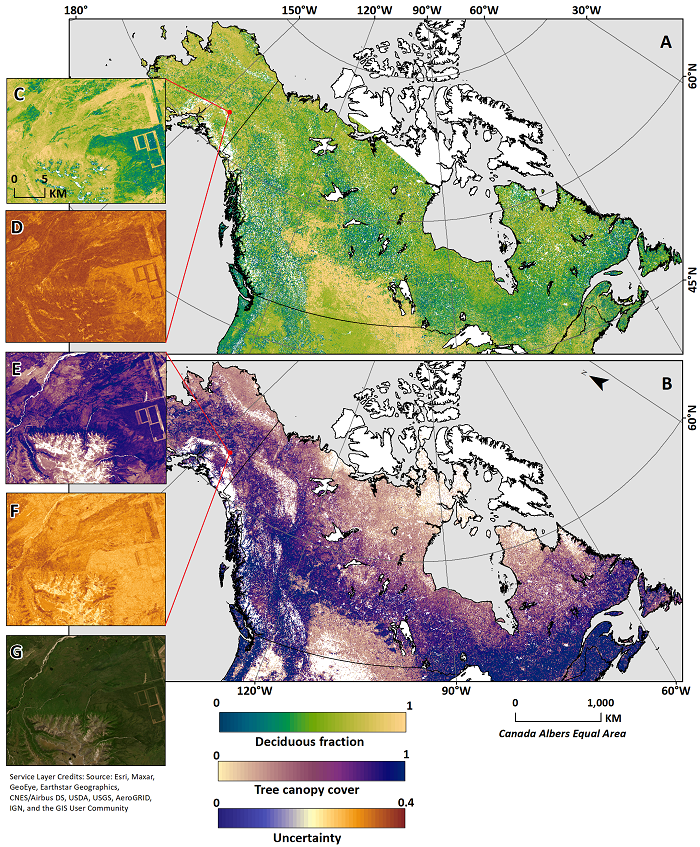
Figure 1. Deciduous fraction (A) and tree canopy cover layer (B) for boreal North America in 2015. Inset (C) depicts deciduous fraction for an area in southeast Alaska with the absolute value of per-pixel uncertainty (D). Similarly, tree canopy cover (E) and its uncertainty (F) are shown. High resolution imagery from ESRI (G) is provided as reference.
Citation
Massey, R., B.M. Rogers, L.T. Berner, S. Cooperdock, M.C. Mack, X.J. Walker, and S.J. Goetz. 2023. Deciduous Fractional Cover and Tree Canopy Cover for Boreal North America, 1992-2015. ORNL DAAC, Oak Ridge, Tennessee, USA. https://doi.org/10.3334/ORNLDAAC/2296
Table of Contents
- Dataset Overview
- Data Characteristics
- Application and Derivation
- Quality Assessment
- Data Acquisition, Materials, and Methods
- Data Access
- References
Dataset Overview
This dataset holds deciduous fraction and tree canopy cover at 30-m resolution over the North American boreal domain for 1992 to 2015. Deciduous fraction is the areal percentage of deciduous trees relative to all tree canopy cover within a pixel, and tree canopy cover is the areal percentage of a pixel that is covered by tree canopy. Deciduous fraction values are valid only for pixels with tree canopy cover >25 percent. Normalized difference vegetation index (NDVI)-based median-value image composites were derived from Landsat 5, 7, and 8 Collection 1 surface reflectance datasets for years 1987-1997, 1998-2002, 2003-2007, 2008-2012, and 2013-2018 to create composites for nominal years 1992, 2000, 2005, 2010, and 2015, respectively. These image composites were prepared for early spring, mid-summer, and mid-to-late fall seasons to identify key differences in deciduous and evergreen green-up amplitudes. Random Forest (RF) regression models were used to derive deciduous fraction and tree canopy cover from the image composites. These models were trained with data from in-situ samples across Alaska and Canada from a variety of studies. Seventy percent of the in-situ samples were used for training and 30% for validation. Per-pixel uncertainty for both deciduous fraction and tree canopy cover are included and were based on one standard deviation of output values across all decision trees in the RF regression. These datasets were developed as part of NASA's ABoVE project to capture forest composition changes over the North American boreal domain across the last several decades. The data are provided in GeoTIFF format.
Project: Arctic-Boreal Vulnerability Experiment (ABoVE)
The Arctic-Boreal Vulnerability Experiment (ABoVE) is a NASA Terrestrial Ecology Program field campaign being conducted in Alaska and western Canada, for 8 to 10 years, starting in 2015. Research for ABoVE links field-based, process-level studies with geospatial data products derived from airborne and satellite sensors, providing a foundation for improving the analysis, and modeling capabilities needed to understand and predict ecosystem responses to, and societal implications of, climate change in the Arctic and Boreal regions.
Related publication
Massey, R., B. Rogers, L. Berner, S. Cooperdock, M. Mack, X. Walker, and S. Goetz. 2023. Forest composition change and biophysical climate feedbacks across boreal North America, Nature Climate Change (2023).
Acknowledgments
This work was supported by NASA's Arctic Boreal Vulnerability Experiment (ABoVE) (grants NNX17AE44G, 80NSSC19M0112, and 80NSSC22K1247) and the NASA Carbon Cycle Science Program (NNX17AE13G).
Data Characteristics
Spatial Coverage: Boreal biome in North America (Alaska and Canada)
ABoVE Reference Locations
Domain: Core
State/Territory: Alaska and Canada
Grid cells: Ah000v000, Ah000v001, Ah001v000, Ah001v001, Ah002v000, Ah002v001, Ah002v002, Ah003v000,
Ah003v001, Ah003v002, Ah004v000, Ah004v001, Ah004v002, Ah005v001, Ah005v002
Spatial Resolution: 0.00027 degree (~30 m)
Temporal Coverage: 1992-01-01 to 2015-12-31
Temporal Resolution: 5 years (except 8 years for 1992-2000)
Study Area: All latitude and longitude are given in decimal degrees.
| Site | Northern Extent | Southern Extent | Eastern Extent | Western Extent |
|---|---|---|---|---|
| Canada, Alaska, and northernmost states in conterminous U.S. |
80.2500 | 39.9997 | -49.9998 | -179.9400 |
Data file information
There are 20 data files in cloud-optimized GeoTIFF (COG) format.
The file naming convention is <variable>_YYYY_<estimate>.tif, where
- <variable> = "deciduousfraction" or "treecanopycover"
- YYYY = nominal year (1992, 2000, 2005, 2010, or 2015)
- <estimate> = "prediction" or "uncertainty"
Table 1. File names and descriptions.
| File name | Unit | Description |
|---|---|---|
| deciduousfraction_YYYY_prediction.tif | percent | Areal percentage of deciduous trees relative to all tree canopy cover within a pixel. |
| deciduousfraction_YYYY_uncertainty.tif | percent | Uncertainty in predicted deciduous fraction based on standard deviation of leaves of the random forest regression model for estimating deciduous fraction. |
| treecanopycover_YYYY_prediction.tif | percent | Percent of pixel covered by tree canopy. |
| treecanopycover_YYYY_uncertainty.tif | percent | Uncertainty in predicted tree canopy cover based on standard deviation of leaves of the random forest regression model for tree canopy cover. |
GeoTIFF characteristics:
- Coordinate system: Geographic coordinates in WGS-84 datum (EPSG 4326)
- Pixel size: 0.00027 degree (or ~30 m)
- Units: Percent
- Number of bands: 1
User Note: Predictions of deciduous fraction are only valid for pixels with tree canopy cover >25%. The GeoTIFFs do not include no-data pixels. Per-pixel deciduous fraction does not depict vegetation cover but rather the dominance of deciduous versus evergreen vegetation, independent of the per-pixel canopy cover. See Section 5 and Massey et al. (2023) for related information.
Application and Derivation
These data describe and capture gradients in forest composition and cover not otherwise possible with coarser resolution or categorical map products. Whereas most past studies have focused on burned areas alone, these data help in assessing fine-scale biome-wide changes both within and outside of fire-disturbed areas. These spatially detailed, multi-temporal maps are also useful in assessment of the influence of forest compositional changes on albedo-driven radiative forcings.
Quality Assessment
For both deciduous fraction and tree canopy cover models, 70% of the samples were used for training and 30% for validation. One standard deviation of all samples in output leaves across all the decision trees in the random forest regression model was used as a measure of uncertainty. This dataset includes per-pixel uncertainty layers for both deciduous fraction and tree canopy cover.
Caveats: Although the deciduous fractional cover and tree canopy layers capture the variation in tree-based forest composition across the boreal domain, they do not specifically consider the understory component of the boreal forest because the forest inventories did not consider trees less than 1.5-m height. This understory vegetation component may contribute to the unexplained variance in the deciduous fraction model, and impact inferred patterns of post-fire succession. Another limitation of this analysis is the dependency on multi-spectral data to extrapolate deciduous fraction and tree canopy cover across the boreal domain. The regression model was trained on the spectral reflectance of tree-based deciduous fraction,and there may be locations where the spectral reflectance of shrubs and other vegetation types resembles that of the trees. Tree canopy cover of >25% was used as a masking layer to only include treed forest in our study, but locations with high shrub density may be modeled as having higher tree canopy cover than the threshold, making them difficult to exclude. However, the deciduous signal seen in canopy dominants could translate to vegetation <1.5m, particularly in early succession with small deciduous trees and shrubs. Although the training database includes only trees >1.5 m tall, the random forest model will return a high deciduous fraction value for a pixel even if it contains smaller trees with a spectral signature similar to deciduous canopy dominants.
Per-pixel deciduous fraction does not depict vegetation cover but rather the dominance of deciduous versus evergreen vegetation, independent of the per-pixel canopy cover. While 30-m spatial resolution is fine enough to represent homogeneous vegetation, this pixel size may include mixed vegetation types such as deciduous shrubs and evergreen trees. Such mixing in areas of lower tree canopy cover can result in some pixels having deciduous fraction greater than the percentage of tree cover (e.g. low tree cover but all deciduous).
See Massey et al. (2023) for additional details and discussion.
Data Acquisition, Materials, and Methods
The data were derived from Landsat data and Random Forest regression models trained with in-situ sample data. Landsat satellite data were from Landsat 5 TM, Landsat 7 ETM+, and Landsat 8 OLI sensors. Landsat 5, 7, and 8 Collection 1 surface reflectance (SR) datasets for years 1987–1997, 1998–2002, 2003–2007, 2008–2012, and 2013–2018 were used to derive normalized difference vegetation index (NDVI)-based median-value image composites for nominal years 1992, 2000, 2005, 2010, and 2015, respectively. These image composites were prepared for early spring, mid-summer, and mid to late fall seasons to identify key differences in deciduous and evergreen green-up amplitudes. The nominal 1992 Landsat data did not have complete coverage for Alaska.
While constructing the NDVI Landsat composites, only valid land pixels were used. Pixels with permanent ice cover or snow were excluded. Pixels with permanent waterbodies (lakes, rivers, streams) were identified using Pekel et al. (2016) and excluded. Excluded pixels were marked with a value of 0 for deciduous fraction and/or tree canopy cover.
The in-situ data used for modeling deciduous fraction included measurements from 27,494 ground samples from these studies:
- Cooperative Alaska Forest Inventory (CAFI) (Malone et al, 2009),
- Bonanza Creek Long Term Ecological Research (BNZ LTER) samples in Alaska (Alexander and Mack, 2017),
- Repeatedly-measured permanent sample plots from the Canadian provinces of Yukon, Northwest Territories, British Columbia, Alberta, Saskatchewan, Manitoba, and Ontario (Hayden et al., 1995),
- Ground sample plots from Northwest Territories (Marshall and Baltzer, 2015), and
- Canadian National Forest Inventory plot data for sites across Canada (Gillis et al., 2005).
Random Forest regression models were trained using the in-situ samples to derive the deciduous fraction and tree canopy cover predictions for each nominal year. The training samples were selected in a stratified random manner, with a stratum for each tree canopy cover level extracted from the global tree cover data for 2010 (Hansen et al, 2013).
Deciduous fraction values are valid only for pixels with tree canopy cover >25%. The permanent sample plots used as in-situ samples for deciduous fraction predominantly contain trees and have tree canopy cover of >25% in the tree canopy layers. Therefore, deciduous fraction pixel values are valid only when they meet that criteria.
See Massey et al. (2023) for additional details.
Data Access
These data are available through the Oak Ridge National Laboratory (ORNL) Distributed Active Archive Center (DAAC).
Deciduous Fractional Cover and Tree Canopy Cover for Boreal North America, 1992-2015
Contact for Data Center Access Information:
- E-mail: uso@daac.ornl.gov
- Telephone: +1 (865) 241-3952
References
Alexander, H.D., and M.C. Mack. 2017. Gap regeneration within mature deciduous forests of Interior Alaska: Implications for future forest change. Forest Ecology and Management 396:35–43. https://doi.org/10.1016/j.foreco.2017.04.005
Gillis, M.D., A.Y. Omule, and T. Brierley. 2005. Monitoring Canada’s forests: The National Forest Inventory. The Forestry Chronicle 81:214–221. https://doi.org/10.5558/tfc81214-2
Hansen, M.C., P.V. Potapov, R. Moore, M. Hancher, S.A. Turubanova, A. Tyukavina, D. Thau, S.V. Stehman, S.J. Goetz, T.R. Loveland, A. Kommareddy, A. Egorov, L. Chini, C.O. Justice, and J.R. G. Townshend. 2013. High-resolution global maps of 21st-century forest cover change. Science 342:850–853. https://doi.org/10.1126/science.1244693
Hayden, J., J. Kerley, D. Carr, T. Kenedi, and J. Hallarn. 1995. Ontario forest growth and yield program: field manual for establishing and measuring permanent sample plots. Ministry of Natural Resources, Ontario Forest Research Institute; Sault Ste. Marie, ON.
Malone, T., J. Liang, and E.C. Packee. 2009. Cooperative Alaska Forest Inventory. General Technical Report PNW-GTR-785. U.S. Department of Agriculture, Forest Service, Pacific Northwest Research Station. https://doi.org/10.2737/PNW-GTR-785
Marshall, K.E., and J.L. Baltzer. 2015. Decreased competitive interactions drive a reverse species richness latitudinal gradient in subarctic forests. Ecology 96:461–470. https://doi.org/10.1890/14-0717.1
Massey, R., B. Rogers, L. Berner, S. Cooperdock, M. Mack, X. Walker, and S. Goetz. 2023. Forest composition change and biophysical climate feedbacks across boreal North America, Nature Climate Change (2023).
Pekel, J.-F., A. Cottam, N. Gorelick, and A. S. Belward. 2016. High-resolution mapping of global surface water and its long-term changes. Nature 540:418–422. https://doi.org/10.1038/nature20584