Documentation Revision Date: 2018-08-07
Data Set Version: 1
Summary
There are 42 data files in this data set. This includes 20 snow density files and 20 snow depth files in NetCDF (.nc4) format, and two comma-separated files (.csv) with environmental covariate and sheep location data.

Figure 1. The western face of the Chigmit Mountains in Lake Clark National Park and Preserve, Alaska. White points are locations from multiple Dall sheep from March through 5 April 2006. The base heatmap depicts the relative, conditional probability of use on 1 April 2006 as predicted by the best model from our second, fine-scale analysis. Hotter colors correspond to higher relative probabilities of use by sheep. White asterisks denote SNOTEL stations. The two insets (a, b) were arbitrarily chosen to depict model predictions of space use along east-west and north-south gradients (from Mahoney et al., 2018).
Citation
Mahoney, P., G. Liston, B. Mangipane, and L.R. Prugh. 2018. ABoVE: Dall Sheep Response to Snow and Landscape Covariates, Alaska, 2005-2008. ORNL DAAC, Oak Ridge, Tennessee, USA. https://doi.org/10.3334/ORNLDAAC/1602
Table of Contents
- Data Set Overview
- Data Characteristics
- Application and Derivation
- Quality Assessment
- Data Acquisition, Materials, and Methods
- Data Access
- References
Data Set Overview
This dataset provides daily estimates of snow depth and snow density for the study area in Lake Clark National Park and Preserve (LCNPP), Alaska. The data were generated using SnowModel and used as snow covariates along with landscape covariates in modeling efforts to study Dall sheep movements in response to dynamic snow conditions. Thirty adult Dall sheep (12 male, 18 female) were captured and outfitted with global positioning system (GPS) collars programmed to acquire locations every seven hours. Given the individual sheep locations, their distances to land cover (e.g., shrub, forest, glacier), landscape characteristics (e.g., elevation, terrain ruggedness index (TRI), vector ruggedness measure (VRM), slope, and aspect), snow depth and density, MODIS normalized difference snow index (NDSI), and other covariates were determined and are provided in the environmental data file. The snow density and depth data are provided at 25-m, 100-m, 500-m, 2000-m, and 10000-m grid resolutions, at 1-day increments, and cover the period September 1, 2005 through August 31, 2008. The sheep, snow, and landscape data cover the years 2006, 2007, and 2008.
The study area was Lake Clark National Park and Preserve, Alaska (Lake Clark NPP), at the intersection of the Alaska and Aleutian Ranges along the Chigmit Mountains in south-central Alaska, and at the southern extent of the Dall sheep range.
Project: Arctic-Boreal Vulnerability Experiment
The Arctic-Boreal Vulnerability Experiment (ABoVE) is a NASA Terrestrial Ecology Program field campaign based in Alaska and western Canada between 2016 and 2021. Research for ABoVE links field-based, process-level studies with geospatial data products derived from airborne and satellite sensors, providing a foundation for improving the analysis and modeling capabilities needed to understand and predict ecosystem responses and societal implications.
Related Publication:
Mahoney, P.J, G.E. Liston, S. LaPoint, E. Gurarie, B. Mangipane, A.G. Wells, T.J. Brinkman, J.U.H. Eitel, M. Hebblewhite, A.W. Nolin, N. Boelman, and L.R. Prugh. 2018. Navigating snowscapes: scale-dependent responses of mountain sheep to snowpack properties. DOI: 10.1002/eap.1773 (In Review).
Acknowledgments:
This research received funding from the NASA Terrestrial Ecology Program, grant numbers NNX15AV92A, NNX15AU20A, and NNX15AU21A.
Data Characteristics
Spatial Coverage: Lake Clark National Park and Preserve, Alaska, USA
ABoVE Reference Locations:
Domain: Core ABoVE
State/territory: Alaska
Grid cell(s): Ahh0Avv1
Spatial resolution: Snow density and depth are provided at 25-m, 100-m, 500-m, 2000-m, and 10000-m grid resolutions. Sheep distances and covariates are point data.
Temporal coverage: Snow density and depth 2005-09-01 through 2008-08-31. Sheep distances and covariates are 2006-2008
Temporal resolution: Snow density and depth are daily. Sheep distances and covariates are every 7 hours.
Study Areas (All latitude and longitude given in decimal degrees)
| Site | Westernmost Longitude | Easternmost Longitude | Northernmost Latitude | Southernmost Latitude |
|---|---|---|---|---|
| Lake Clark National Park and Preserve, Alaska, USA | -154.525 | -153.034 | 61.0508 | 59.9828 |
Data File Information
This dataset contains 40 data files in NetCDF (*.nc4) format (20 snow density files and 20 snow depth files) and two files in comma-separated (*.csv) format.
NetCDF files
The *.nc4 files provide daily snow depth in cm and snow density in kg/m3 generated from SnowModel. Not all have the same temporal ranges within the years.
- 2005 files cover September through December
- 2006 and 2007 files cover the entire year
- 2008 files cover January through August.
File naming convention:
The files are named snow_density_{resolution}_{year}.nc4 or snow_depth_{resolution}_{year}.nc4
resolution can be 25m, 100m, 500m, 2000m, or 10000m, and year can be one of 2005 – 2008.
Projection information:
All files are in the Albers Conical Equal Area projection with a proj4 string: "+proj=aea +lat_1=55.0 +lat_2=65.0 +lat_0=50.0 +lon_0=-154.0 +x_0=0.0 +y_0=0.0 +ellps=GRS80 +datum=NAD83 +units=m +no_defs +towgs84=0,0,0".
Comma-separated files
There are two comma-separated files (*.csv):
- Dall_sheep_ssf.csv: This is the all-inclusive environmental data file, with over 800,000 observations derived from the individual sheep locations, with their distances to land cover (e.g., shrub, forest, glacier), landscape characteristics (e.g., elevation, terrain ruggedness index (TRI), vector ruggedness measure (VRM), slope, and aspect), snow depth and density, MODIS normalized difference snow index (NDSI), and other covariates as listed below. Covariates are scaled (centered by their means and divided by 1 standard deviation) from regression analyses.
- Dall_sheep_ssf_stdMets.csv: This file provides the mean, standard deviation, minimum, and maximum values for the covariates.
Variable descriptions:
Table 1. Variables in the file Dall_sheep_ssf.csv
User Notes:
- Distance refers to the proximity to said covariates (water, forest, etc.) from the animal’s location (or the random location in the case of Used = 0) as measured in meters.
- This data file contains all covariates that were used in some or all of the modeling efforts. Note that NDSI was not part of the fine-scale analysis (7-hr).
- The GPS latitude and longitude of individual sheep are not permitted to be shared and are not provided.
- Data not applicable are provided as -9999.
| Variable | Units/format | Description |
|---|---|---|
| animal_id | Animal ID | |
| gender | Sex of the individual | |
| ID_year | Individual year | |
| date | YYYY-MM-DD | Date |
| time | time (GMT) | |
| year | YYYY | Year location was taken |
| season | Season of location, (All winter, January - May) | |
| scale | Step scale (hours) used to characterize movement distributions and random availability | |
| stratum | Grouping metric for conditioning local availability to a single used point | |
| used | 0 or 1 | Whether a point was used (1) or randomly generated (0) |
| dbarren | m | Distance to barren ground cover (meters, derived from the NLCD) |
| dforest | m | Distance to all forest ground cover (meters, derived from the NLCD) |
| dscrub | m | Distance to scrub/shrub ground cover (meters, derived from the NLCD) |
| dglacier | m | Distance to glacier ground cover (meters, derived from the NLCD) |
| dwater | m | Distance to water ground cover (meters, derived from the NLCD) |
| ndsi_mxd | MODIS Normalized Snow Difference Index (Mosaic of MOD/MYD) | |
| ndsi_5dayFill | MODIS NDSI_mxd with 5-day fill | |
| ndsi_10dayFill | MODIS NDSI_mxd with 10-day fill | |
| snod_25m | cm | Snow depth (cm) measured on a 25-m grid |
| snod_100m | cm | Snow depth (cm) measured on a 100-m grid |
| snod_500m | cm | Snow depth (cm) measured on a 500-m grid |
| snod_2000m | cm | Snow depth (cm) measured on a 2000-m grid |
| snod_10000m | cm | Snow depth (cm) measured on a 10000-m grid |
| sden_25m | kg/m | Snow density (kg/m) measured on a 25-m grid |
| sden_100m | kg/m | Snow density (kg/m) measured on a 100-m grid |
| sden_500m | kg/m | Snow density (kg/m) measured on a 500-m grid |
| sden_2000m | kg/m | Snow density (kg/m) measured on a 2000-m grid |
| sden_10000m | kg/m | Snow density (kg/m) measured on a 10000-m grid |
| aspectF_25m | Discretized categories for aspect based on cardinal direction. Measured from a 25-m DEM. | |
| elev_25m | m | Elevation (meters) estimated from a digital elevation map on a 25-m grid |
| elope_25m | degrees | Slope (degrees) estimated from a digital elevation map on a 25-m grid |
| tri_25m | Terrain ruggedness index estimated from a digital elevation map on a 25-m grid | |
| vrm_25m | Vector ruggedness estimated from a digital elevation map on a 25-m grid | |
| descape_terr_25m | m | Distance to escape terrain (meters to slope > 50 degrees) measured on a 25-m grid. |
Table 2. Variables in the file Dall_sheep_ssf_stdMets.csv
This file provides the mean, stand deviation, minimum, and maximum values for the covariates, dbarren through descape_terr_25m, as listed in Table 1 above.
User notes:
- Statistics were estimated from data at the 7-hr scale, but applied to all scales when standardizing.
- Covariate units and descriptions are as listed in Table 1.
Companion Files
SnowModel_Dall_Sheep_Snowpack.pdf: Provides additional details on SnowModel.
Dall_Sheep_Snowpack.pdf: Provides this users guide in .pdf format.
Application and Derivation
Dall sheep are endemic to the mountainous regions of Alaska and northwestern Canada, where snow cover persists for eight to nine months of the year and is characterized by fine-scale heterogeneity associated with complex landscapes. They may be especially sensitive to changes in snow depth and density as they require year-round access to forage along alpine slopes and may often seek windblown patches with exposed forage or sufficiently shallow (or soft) snow to permit excavation.
Our approach illustrates a novel framework to understand how wildlife navigate changing snow scapes across multiple scales and may enhance wildlife managers’ ability to predict how climate change will affect the movements of valued game species such as Dall sheep (Mahoney et al., 2018).
Quality Assessment
SnowModel snow distributions were coarsely compared with MODIS Snow Cover. Observed and simulated snow distributions were qualitatively compared using Landsat imagery. Snow depths, air temperatures, and wind speeds were compared to empirical data from SNOTEL stations (Mahoney et al., 2018).
Data Acquisition, Materials, and Methods
Study Area
The study area was Lake Clark National Park and Preserve, Alaska (Lake Clark NPP), at the intersection of the Alaska and Aleutian Ranges along the Chigmit Mountains in south-central Alaska, and at the southern extent of the Dall sheep range. Lake Clark NPP is characterized by a diversity of elevation-dependent ecotypes, with boreal conifers (Picea glauca and P. mariana) and interspersed white birch (Betula neoalaskana) along south slopes and at lower elevations, as well as alder (Alnus virdis) along riparian corridors. Alpine tundra and barren ground dominate as elevation increases, transitioning into persistent snow cover and glaciers at the highest elevations.
Dall sheep are endemic to the mountainous regions of Alaska and northwestern Canada, where snow cover persists for eight to nine months of the year and is characterized by fine-scale heterogeneity associated with complex landscapes. They may be especially sensitive to changes in snow depth and density as they require year-round access to forage along alpine slopes and may often seek windblown patches with exposed forage or sufficiently shallow (or soft) snow to permit excavation. Their populations have declined by 21% range wide since 1990, with declines of more than 70% in some populations forcing emergency harvest closures (Mahoney et al., 2018).
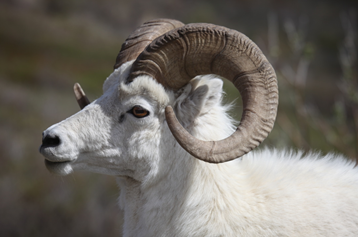
Figure 2. A male Dall Sheep (photo taken from NASA’s ABoVE Dall sheep project page- https://dallsheep.weebly.com/)
Methods
Models were evaluated to predict Dall sheep movement when incorporating snowscape and landscape metrics using snow depth and snow density data simulated from SnowModel, and MODIS derived NDSI data. The methods are briefly described below. For additional details, refer to Mahoney et al., 2018.
Dall sheep
Thirty adult Dall sheep (12 male, 18 female) were captured using helicopter net-gunning without chemical immobilization during three capture events from fall of 2005 through spring of 2008. Individuals were outfitted with a global positioning system (GPS) collar programmed to acquire locations every seven hours and released animals at the site of capture.
Snow covariates from SnowModel
Snow depth and snow density were simulated using SnowModel (Liston and Elder 2006a) at 1-day increments for the period the GPS collars were deployed (1 September 2005 through 31 August 2008; 1096 days) over a spatial domain that covered an 80-km by 120-km area in southwest Alaska. Model simulations were performed using a 25-m horizontal grid increment over the domain (3200 and 4800 grid cells in the x and y directions, respectively; or ~15 million grid cells). SnowModel is composed of four sub-models:
- EnBal- estimates surface energy exchanges (Liston , 2000),
- SnowPack-snow depth and water-equivalent evolution (Liston and Mernild 2012),
- SnowTran-3D- snow redistribution by wind (Liston 2007), and
- SnowAssim- assimilates both available field (i.e., weather stations) and remote sensing datasets (Liston and Hiemstra 2008).
Data inputs to SnowModel included empirical meteorological data from two remote automated weather stations (Port Alsworth and Stoney) and 25 grid points from NASA’s Modern Era Retrospective-Analysis for Research and Applications (MERRA-2; Gelaro et al. 2017) data product. SnowAssim was used to assimilate snow depth observations from the Port Alsworth and Lake Telaquana Snow Telemetry (SNOTEL) sites in the Lake Clark NPP region. In addition, observed and simulated snow distributions were qualitatively compared using Landsat imagery.
SnowModel Landscape covariates
Landscape covariates included topographic heterogeneity, characterized by deriving elevation, slope, aspect, vector ruggedness measure (VRM), terrain ruggedness index (TRI), and proximity to escape terrain (distance in meters to slopes > 60) from LANDFIRE and the United States Geological Survey National Elevation Dataset (NED, 30-m re-gridded to 25-m).
Proximity to glacier as an index of moisture continuum and forage accessibility and proximity to barren ground and shrubs were included given the importance of both in providing access to ground forage. Proximity to glacier, barren ground, and shrub land were derived from the USGS National Land Cover Database classification scheme on a 30-m grid (NLCD; Homer et al. 2015).
Refer to the companion file SnowModel_Dall_Sheep_Snowpack.pdf.
In addition to SnowModel outputs, estimates of normalized difference snow index (NDSI) on a 500-m grid were also used (MODIS snow cover data (MOD/MYD10A1, version 6), acquired through the National Snow and Ice Data Center. Since daily MODIS products suffer from cloud cover and mis-classification, resulting in large proportions of empty pixels within some regions, a two-step gap-filling procedure was implemented to increase the number of cloud-free observations. First, MODIS Terra (MOD10A1) was filled with Aqua observations (MYD10A1), then cloud-obscured or missing pixels were filled with the nearest high-quality measurement within buffers of 5 and 10 days (Mahoney et al., 2018).
Model evaluation- Step selection process
A Step-Selection Function (SSF; Fortin et al., 2005) was used to evaluate the influence of landscape metrics and time-varying snow conditions on Dall sheep resource selection from January through mid-May (i.e., winter). Movement distributions were derived for each individual during winter at eight step scales from seven hours through 896 hours (or approximately five weeks) using increments in proportion to our finest GPS fix rate (i.e., seven hours). Each distribution was composed of observed movements (i.e., empirical step lengths an turning angles) and used to generate five random displacements from ‘used’ locations at time tstep, and therefore local ‘availability’ at time tstep+1, at every step made by an individual for each of the eight step scales. Both observed (Used = 1) and random steps (Used = 0) were annotated with each of the spatial covariates described above. Conditional logistic regression was used to pair used locations with matched random locations. Animals were also clustered by year in order to account for the lack of independence between steps made by the same individual for a given winter.
Model selection
Simple second-order polynomials, models with non-linear coefficients, and models with elevation, either additively or as an interaction, to account for the confounding relationship between snow and elevation were evaluated. Scale-dependent models were run that included some variation of NDSI and SnowModel covariates using a subset of “thinned” data due to substantial missingness in the NDSI covariate (across all scales). The thinning operation was functionally equivalent to removing all NAs in NDSI (specifically NDSI_10dayFill) across all scales and using what remained. The reason for using the smaller dataset for comparison was that the model selection methods used (QIC) required the input dataset to be constant (i.e., the records present from one model to the next do not change).
Models were also evaluated for Dall sheep resource selection in response to SnowModel-simulated snow conditions (no NDSI) at the finest step scale (i.e., 7-hr) using all available data. Due to differences in body mass and height between the sexes that could affect the way each responds to fine-scale snow conditions, three distinct model sets were evaluated: males only, females only, and all individuals pooled. Models were included allowing non-linearities in response to snow metrics. Two- and three-way interactions were incorporated into the models based on combinations of snow depth, snow density, and elevation. Although three-way interactions add substantial complexity to the model sets, our biological justification for incorporating such complexity was to identify if selection for snow density changed with snow depth. In addition, it was anticipated that selection for snow conditions might change with elevation or that selection for elevation would change with snow conditions.
Refer to Mahoney et al., 2018 for additional details.
Data Access
These data are available through the Oak Ridge National Laboratory (ORNL) Distributed Active Archive Center (DAAC).
ABoVE: Dall Sheep Response to Snow and Landscape Covariates, Alaska, 2005-2008
Contact for Data Center Access Information:
- E-mail: uso@daac.ornl.gov
- Telephone: +1 (865) 241-3952
References
Fortin, D., H. L. Beyer, M. S. Boyce, D. W. Smith, T. Duchesne, and J. S. Mao. 2005. Wolves influence elk movements: Behavior shapes a trophic cascade in Yellowstone National Park. Ecology 86:1320-1330. https://doi.org/10.1890/04-0953
Homer, C. G., J. A. Dewitz, L. Yang, S. Jin, P. Danielson, G. Xian, J. Coulston, N. D. Herold, J. D. Wickham, and K. Megown. 2015. Completion of the 2011 National Land Cover Database for the conterminous United States-Representing a decade of land cover change information. Photogrammetric Engineering and Remote Sensing 81:345-354.
Liston, G. E., and S. H. Mernild. 2012. Greenland freshwater runoff. Part I: A runoff routing model for glaciated and nonglaciated landscapes (HydroFlow). Journal of Climate 25:5997-6014. https://doi.org/10.1175/JCLI-D-11-00591.1
Liston, G. E., and C. A. Hiemstra. 2008. A simple data assimilation system for complex snow distributions (SnowAssim). Journal of Hydrometeorology 9:989-1004. https://doi.org/10.1175/2008JHM871.1
Liston, G. E., R. B. Haehnel, M. Sturm, C. A. Hiemstra, S. Berezovskaya, and R. D. Tabler. 2007. Simulating complex snow distributions in windy environments using SnowTran-3D. Journal of Glaciology 53:241-256. https://doi.org/10.3189/172756507782202865
Liston, G. E., and K. Elder. 2006. A Distributed Snow-Evolution Modeling System (SnowModel). Journal of Hydrometeorology 7:1259-1276. https://doi.org/10.1175/JHM548.1
Liston, G. E., J. G. Winther, O. Bruland, H. Elvehøy, K. Sand, and L. Karlöf. 2000. Snow and blue-ice distribution patterns on the coastal Antarctic Ice Sheet. Antarctic Science 12:69-79. https://doi.org/10.1017/S0954102000000109
Mahoney, P.J, G.E. Liston, S. LaPoint, E. Gurarie, B. Mangipane, A.G. Wells, T.J. Brinkman, J.U.H. Eitel, M. Hebblewhite, A.W. Nolin, N. Boelman, and L.R. Prugh. 2018. Navigating snowscapes: scale-dependent responses of mountain sheep to snowpack properties. DOI: 10.1002/eap.1773 ( In Review).