Documentation Revision Date: 2024-04-24
Dataset Version: 1
Summary
There are 2,049 data files in cloud optimized GeoTIFF (COG) format.

Figure 1. Maximum PM2.5 concentration maps for May and June of 2001-2015.
Citation
Chen, D., M. Billmire, N.H.F. French, T.V. Loboda, and A.E. Bredder. 2023. Simulated Fine Particulate Matter (PM2.5) Estimates over Alaska, 2001-2015. ORNL DAAC, Oak Ridge, Tennessee, USA. https://doi.org/10.3334/ORNLDAAC/2157
Table of Contents
- Dataset Overview
- Data Characteristics
- Application and Derivation
- Quality Assessment
- Data Acquisition, Materials, and Methods
- Data Access
- References
Dataset Overview
The dataset provides simulated PM2.5 concentration estimates over Alaska, U.S. PM2.5 (particulate matter with diameter <= 2.5 µm) concentrations in air (µg m-3) are gridded at 0.1-degree resolution for May to September for the years 2001 through 2015. The data were created in a modeling process utilizing the Wildland Fire EMissions Inventory System (WFEIS), the Arctic-Boreal Vulnerability Experiment (ABoVE) Wildfire Date of Burning (WDoB) dataset (Loboda et al., 2017), and multiple models including the Hybrid Single-Particle Lagrangian Integrated Trajectory (HYSPLIT) model.
Project: Arctic-Boreal Vulnerability Experiment
The Arctic-Boreal Vulnerability Experiment (ABoVE) is a NASA Terrestrial Ecology Program field campaign based in Alaska and western Canada between 2016 and 2021. Research for ABoVE links field-based, process-level studies with geospatial data products derived from airborne and satellite sensors, providing a foundation for improving the analysis and modeling capabilities needed to understand and predict ecosystem responses and societal implications.
Related Publication
Chen, D., M. Billmire, C.P. Loughner, A. Bredder, N.H. F. French, H.C. Kim, and T.V. Loboda. 2023. Simulating spatio-temporal dynamics of surface PM2.5 emitted from Alaskan wildfires. Science of The Total Environment 898:165594. https://doi.org/10.1016/j.scitotenv.2023.165594
Related Dataset
Loboda, T.V., J.V. Hall, and A. Baer. 2017. ABoVE: Wildfire Date of Burning within Fire Scars across Alaska and Canada, 2001-2019. ORNL Distributed Active Archive Center. https://doi.org/10.3334/ORNLDAAC/1559
Acknowledgement
This project was supported by NASA's Terrestrial Ecology ABoVE Program (grant 80NSSC19M0106).
Data Characteristics
Spatial Coverage: Alaska, U.S.
ABoVE Reference Locations
Domain: Core ABoVE
State/Territory: Alaska
Grid cells: Ah000v000, Ah000v001, Ah000v002, Ah001v000, Ah001v001, Ah001v002, Ah002v000, Ah002v001
Spatial Resolution: 0.10 degree
Temporal Coverage: 2001-05-10 to 2015-09-28
Temporal Resolution: Daily
Study Area: Latitude and longitude are given in decimal degrees.
| Site | Westernmost Longitude | Easternmost Longitude | Northernmost Latitude | Southernmost Latitude |
| Alaska | -178 | -128 | 71 | 51 |
Data File Information
There are 2,049 data files in cloud optimized GeoTIFF (.tif) format with this dataset.
The file naming convention is PM25_simulation_YYYYMMDD_V2.tif, where
- YYYY = year
- MM = month
- DD = day of month
GeoTIFF characteristics
- Coordinate system: geographic coordinates (longitude, latitude), WGS 84 datum, EPSG:4326
- Spatial resolution: 0.10 degree
- Pixel values: simulated concentration of PM2.5 particulate pollutants in air; units = micrograms m-3
- Dimensions: 200 rows x 500 columns
- Data type: Float32
- There are no pixels with missing (nodata) values.
User Note: The GeoTIFFs extend over the ocean to the west and south of Alaska, and these over-ocean pixels are not marked with a no_data value.
Application and Derivation
This is the first dataset of PM2.5 emissions from Alaska wildfires over 2001-2015. This dataset can be used to compare with other PM2.5 datasets. Additionally, this dataset can be used for exposure assessment in health studies, with particular use in assessing rural populations where ground-based monitors are sparse.
Quality Assessment
These simulation data were compared with Environmental Protection Agency air quality monitoring stations and MODIS aerosol optical depth (AOD) product (MCD19A2) (Lyapustin et al., 2018).
Some methodological considerations and biases:
- The injection height in the HYSPLIT dispersion model was set to a single value (1,000 m).
- Simulated concentrations were averaged across the 0.1 degree x 0.1-degree grid (horizontally) and to 500 m (vertically, averaging height).
- There may be propagated uncertainty from meteorological inputs.
- Only homogeneous chemistry was considered in the simulation. Specifically, the simulations do not include wet or dry deposition.
- This dataset sought to simulate only wildfire-derived emissions from Alaska fires. However, intercomparison analysis using regulatory-grade station-recorded PM2.5 concentrations include all sources of PM2.5, including emissions from other fires. As a result, this dataset generally has lower values when compared to air quality monitoring stations in years when fire activity is low.
The full discussion of limitations and uncertainty are included in Chen et al. (2023).
Data Acquisition, Materials, and Methods
This dataset provides fire-induced simulated PM2.5 concentration estimates in a 0.1-degree grid over Alaska for May to September of the years 2001 through 2015. The burned area dataset in the Arctic-Boreal Vulnerability Experiment (ABoVE) Wildfire Date of Burning product (WDoB) (Loboda et al., 2017) was used as the burned area input. Due to its capability to ingest WDoB, the Wildland Fire Emissions Inventory System (WFEIS; wfeis.mtri.org; French et al., 2014) was chosen to estimate PM2.5 emissions, and the Hybrid Single-Particle Lagrangian Integrated Trajectory (HYSPLIT; Stein et al., 2015) model was used to estimate spatial movement and dispersion of the emissions.
WFEIS provided a geospatial implementation of the Seiler and Crutzen (1980) method for emission estimation, which takes into account burned area, fuel loading, and the fraction of consumed fuel.
Burned area: The burned area dataset in the ABoVE WDoB product (Loboda et al., 2017) was used as the burned area input.
Fuel loading: Fuel loading within the burned areas was determined using the LANDFIRE 30-m Existing Vegetation Type (EVT) basemaps where EVTs are mapped to Fuel Characteristic Classification System (FCCS) fuelbeds (https://www.landfire.gov/fccs.php). The EVT maps were intersected with burned areas to identify the distribution of fuel loading within burns.
Fraction of consumed fuel (fuel consumption and fuel moisture): WFEIS uses the US Forest Service Pacific Northwest (PNW) Research Station’s Consume (v5.0) software to calculate fuel consumption. Spatially explicit fuel distribution and temporally specific fuel moisture estimates corresponding to the timing and location of fire events, as determined by WDoB, were used as inputs to the Consume software. Moisture inputs to WFEIS are from the Global Fire Weather Database daily MERRA-2 bias-corrected precipitation product (Field et al., 2015).
HYSPLIT
HYSPLIT was used to estimate movement and spatial dispersion of the PM2.5 emissions. Key input data included meteorology from North American Regional Reanalysis (NARR) dataset (Mesinger et al., 2006). To parameterize other components of HYSPLIT runs, a series of parameter values established in previous studies were adopted (Table 2). The values of particle diameter and density were adopted from Rolph et al. (2009). The resolution was set to 0.10 degree, a resolution believed to be where most wildfire smoke plumes can be resolved. The grid extent was large enough to prevent undersampling of the number of particles in the output concentration grid. Injection height was set to 1,000 m since this height is a reasonable medium-level injection height based on previous research on boreal wildfire smoke. Averaging height was set to 500 m to prevent undersampling of the number of particles within the output concentration grid. All other parameters were set to the default values.
Table 2. Parameters used for the HYSPLIT models. AGL = above ground level
| Output Resolution | Injection Height (AGL) | Averaging Height (AGL) | Particle Diameter | Particle Density |
|---|---|---|---|---|
| 0.10 degree | 1,000 m | 500 m | 0.8 µm | 2 g cm-3 |
Because the HYSPLIT simulations were run at 0.1 degree, the estimated fire emission data acquired during the previous step (since they were produced at higher spatial resolutions) were aggregated to produce cumulative emissions for each 0.1-degree grid cell where emissions were estimated daily. This approach resulted in a total of 69,508 emission sources identified between May 1 and September 30 during 2001-2015 across Alaska. For each emission source, a separate HYSPLIT model was initiated and run through September 30 of that year. The single-source simulation outputs of all HYSPLIT models were totalled per grid cell per day, leading to the daily PM2.5 concentration maps for the state of Alaska for May-September of 2001 to 2015.
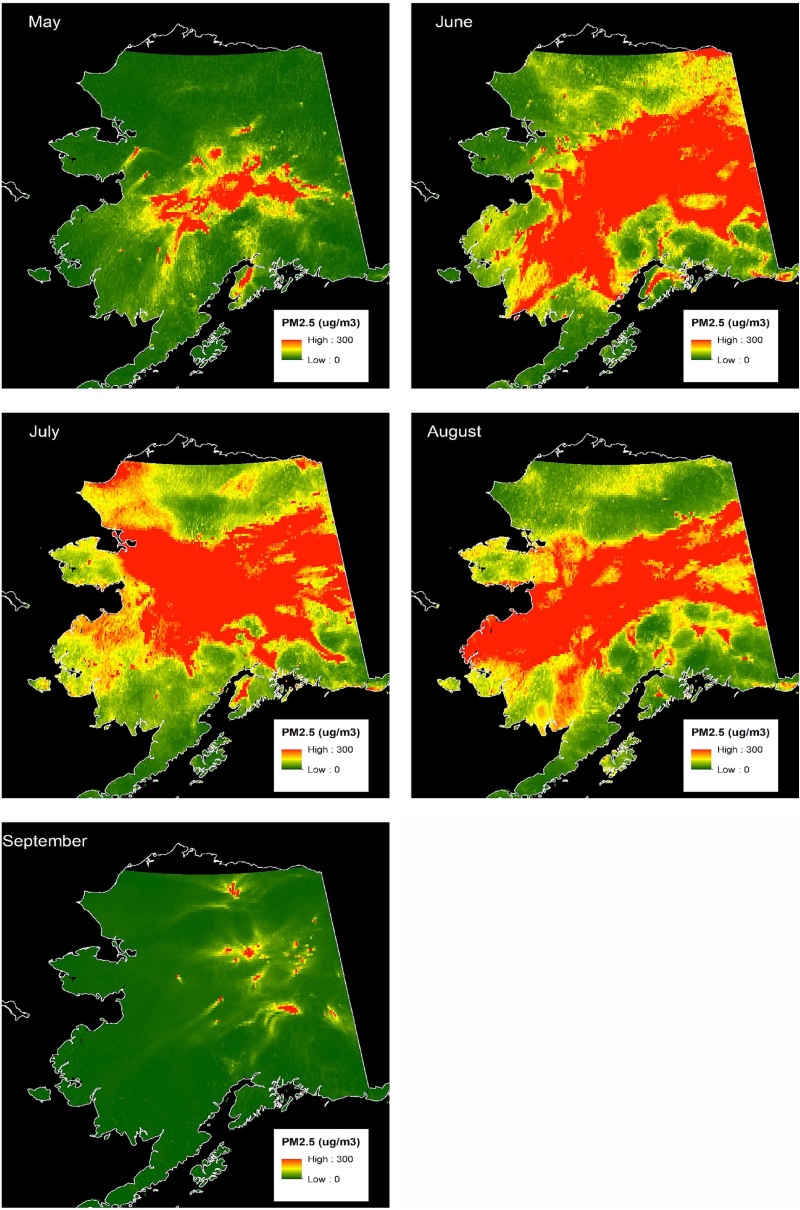
Figure 2. Mean concentrations of PM2.5 pollutants from wildfires for months of May to September for 2001-2015. Source: Chen et al. (2023).
Data Access
These data are available through the Oak Ridge National Laboratory (ORNL) Distributed Active Archive Center (DAAC).
Simulated Fine Particulate Matter (PM2.5) Estimates over Alaska, 2001-2015
Contact for Data Center Access Information:
- E-mail: uso@daac.ornl.gov
- Telephone: +1 (865) 241-3952
References
Chen, D., Billmire, M., Loughner, C.P., Bredder, A., French, N.F., Kim, H.C., Loboda, T.V. 2023. Simulating spatio-temporal dynamics of surface PM2.5 emitted from Alaskan wildfires. Science of the Total Environment 898:165594. https://doi.org/10.1016/j.scitotenv.2023.165594
Field, R.D., A.C. Spessa, N.A. Aziz, A. Camia, A. Cantin, R. Carr, W.J. de Groot, A.J. Dowdy, M.D. Flannigan, K. Manomaiphiboon, F. Pappenberger, V. Tanpipat, and X. Wang. 2015. Development of a Global Fire Weather Database. Natural Hazards and Earth System Sciences 15:1407–1423. https://doi.org/10.5194/nhess-15-1407-2015
French, N.H. F., D. McKenzie, T. Erickson, B. Koziol, M. Billmire, K.A. Endsley, N.K. Yager Scheinerman, L. Jenkins, M.E. Miller, R. Ottmar, and S. Prichard. 2014. Modeling Regional-Scale Wildland Fire Emissions with the Wildland Fire Emissions Information System*. Earth Interactions 18:1–26. https://doi.org/10.1175/EI-D-14-0002.1
Loboda, T.V., J.V. Hall, and A. Baer. 2017, December 27. ABoVE: Wildfire Date of Burning within Fire Scars across Alaska and Canada, 2001-2019. ORNL Distributed Active Archive Center. https://doi.org/10.3334/ORNLDAAC/1559
Lyapustin, A., and Y. Wang. 2018. MCD19A2 MODIS/Terra+Aqua Land Aerosol Optical Depth Daily L2G Global 1km SIN Grid V006. NASA EOSDIS Land Processes Distributed Active Archive Center. https://doi.org/10.5067/MODIS/MCD19A2.006
Mesinger, F., G. DiMego, E. Kalnay, K. Mitchell, P.C. Shafran, W. Ebisuzaki, D. Jovic, J. Woollen, E. Rogers, E.H. Berbery, M.B. Ek, Y. Fan, R. Grumbine, W. Higgins, H. Li, Y. Lin, G. Manikin, D. Parrish, and W. Shi. 2006. North American Regional Reanalysis. Bulletin of the American Meteorological Society 87:343–360. https://doi.org/10.1175/bams-87-3-343
Rolph, G.D., R.R. Draxler, A.F. Stein, A. Taylor, M.G. Ruminski, S. Kondragunta, J. Zeng, H.-C. Huang, G. Manikin, J.T. McQueen, and P.M. Davidson. 2009. Description and verification of the NOAA Smoke Forecasting System: the 2007 fire season. Weather and Forecasting 24:361–378. https://doi.org/10.1175/2008WAF2222165.1
Seiler, W. and P.J. Crutzen. 1980. Estimates of gross and net fluxes of carbon between the biosphere and the atmosphere from biomass burning. Climatic Change 2:207–247. https://doi.org/10.1007/BF00137988
Stein, A.F., R.R. Draxler, G.D. Rolph, B.J. B. Stunder, M.D. Cohen, and F. Ngan. 2015. NOAA’s HYSPLIT atmospheric transport and dispersion modeling system. Bulletin of the American Meteorological Society 96:2059–2077. https://doi.org/10.1175/bams-d-14-00110.1