Documentation Revision Date: 2019-04-10
Dataset Version: 1
Summary
The primary data product is a lake area timeseries for all lakes with a maximum area >0.01 km2. These estimates were created by (1) classifying all images into water/land, (2) tracking changes in lake area by calculating the total water contained within each lake object in a 60 m buffered mask, (3) using a supervised machine learning classification algorithm to remove poor quality observations, and (4) applying a 10-day median filter.
There are 473 total data files of three file types: four lake area timeseries files in .csv format, four .shp files of lake locations and area metrics, and 465 .tif files of buffered lake masks used to track changes in lake area. A companion .kmz file shows the image tiles at the four study areas.
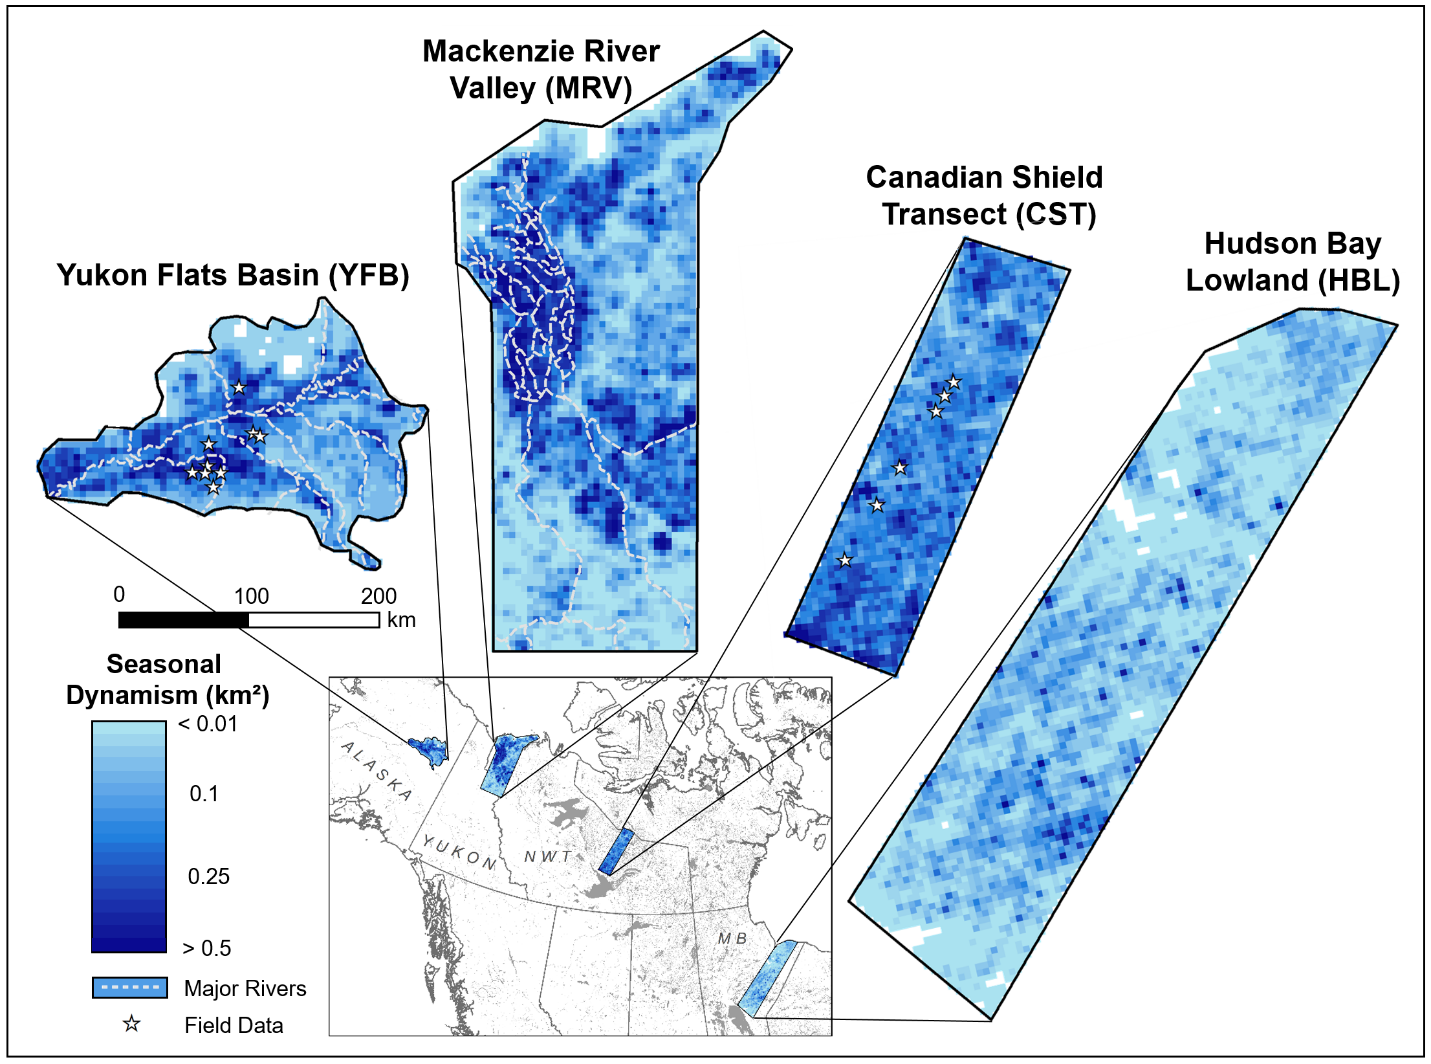
Figure 1. Gridded maps of lake dynamism (seasonal maximum minus seasonal minimum lake area, km2) for the study areas derived from CubeSat imagery. White dashed lines show major river systems. Stars indicate locations of in-situ lake level measurements used for validation. From Cooley et al. (2019).
Citation
Cooley, S.W., L.C. Smith, J.C. Ryan, L.H. Pitcher, and T.M. Pavelsky. 2019. Timeseries of Arctic-Boreal Lake Area Derived from CubeSat Imagery, 2017. ORNL DAAC, Oak Ridge, Tennessee, USA. https://doi.org/10.3334/ORNLDAAC/1667
Table of Contents
- Dataset Overview
- Data Characteristics
- Application and Derivation
- Quality Assessment
- Data Acquisition, Materials, and Methods
- Data Access
- References
Dataset Overview
This dataset provides near-daily lake area timeseries for 85,358 lakes across four study areas in Northern Canada and Alaska, USA, between May 1 and October 1, 2017. These lake area estimates were produced using digital images from newly developed Planet Labs CubeSats, small satellites with a 4-band (blue, green, red, near-infrared) camera payload. In constellation, CubeSats collected imagery at very high spatial (3-5m) and temporal (near-daily) resolution. From the imagery, each lake's mean, minimum, and maximum areas and seasonal dynamism were derived. The dataset covers four Arctic-Boreal regions: the Yukon Flats Basin (YFB) in eastern interior Alaska, and the Mackenzie River Valley (MRV), Canadian Shield Transect (CST), and Hudson Bay Lowland (HBL) in Canada.
The primary data product is a lake area timeseries for all lakes with a maximum area >0.01 km2. These estimates were created by (1) classifying all images into water/land, (2) tracking changes in lake area by calculating the total water contained within each lake object in a 60 m buffered mask, (3) using a supervised machine learning classification algorithm to remove poor quality observations, and (4) applying a 10-day median filter.
Project: Arctic-Boreal Vulnerability Experiment
The Arctic-Boreal Vulnerability Experiment (ABoVE) is a NASA Terrestrial Ecology Program field campaign based in Alaska and western Canada between 2016 and 2021. Research for ABoVE links field-based, process-level studies with geospatial data products derived from airborne and satellite sensors, providing a foundation for improving the analysis and modeling capabilities needed to understand and predict ecosystem responses and societal implications
Related Publication:
Cooley, S.W., Smith, L.C., Ryan, J.C., Pitcher, L.H. and Pavelsky, T.M. 2019. Arctic-Boreal lake dynamics revealed using CubeSat imagery. Geophysical Research Letters, 46. https://doi.org/10.1029/2018GL081584
Acknowledgements:
This work was funded by NASA ABoVE grant NNX17AC60A.
Data Characteristics
Spatial Coverage: Study areas across Northern Canada and Alaska, USA
ABoVE Reference Locations:
Domain: Core and Extended regions
State/territory: Alaska, USA; Canada
Grid cell(s): ABoVE grid level C tile IDs for each of the four study areas are provided in a companion file. There are 701 level C grid tiles.
Spatial Resolution: 3.125 m
Temporal Coverage: May - October, 2017
Temporal Resolution: daily
Study Area: (all latitudes and longitudes given in decimal degrees)
| Site | Westernmost Longitude | Easternmost Longitude | Northernmost Longitude | Southernmost Longitude |
|---|---|---|---|---|
| Yukon Flats Basin (YFB) | -149.1208528 | -142.6388861 | 67.49692778 | 65.31843611 |
| Mackenzie River Valley (MRV) | -135.59365 | -129.6447639 | 70.3105 | 65.74845556 |
| Canadian Shield Transect (CST) | -114.6404083 | -110.4991444 | 65.57464444 | 62.29700556 |
| Hudson Bay Lowland (HBL) | -97.53031944 | -90.24840833 | 57.37728611 | 52.81486111 |
Data File Information:
There are 473 total data files of three file types: four lake area timeseries files in .csv format, four .shp files of lake locations and area metrics, and 465 *.tif files of buffered lake masks used to track changes in lake area. A companion .kmz file shows the image tiles in the four study areas.
Table 1. Data file descriptions
| File name | Description |
|---|---|
| YFB_ Lake_Time_Series.csv | Daily timeseries of lake areas in Yukon Flats Basin (YFB) study area. 8,854 lakes total. |
| MRV_ Lake_Time_Series.csv | Daily timeseries of lake areas in Mackenzie River Valley (MRV) study area. 37,957 lakes total. |
| CST_ Lake_Time_Series.csv | Daily timeseries of lake areas in Canadian Shield Transect (CST) study area. 21,560 lakes total. |
| HBL_ Lake_Time_Series.csv | Daily timeseries of lake areas in Hudson Bay Lowland (HBL) study area. 16,987 lakes total. |
| Yukon_Flats_Basin_Lakes.zip | Shapefile with lake centroids and lake metrics calculated from the YFB lake timeseries. |
| Mackenzie_River_Valley_Lakes.zip | Shapefile with lake centroids and lake metrics calculated from the MRV lake timeseries. |
| Canadian_Shield_Transect_Lakes.zip | Shapefile with lake centroids and lake metrics calculated from the CST lake timeseries. |
| Hudson_Bay_Lowland_Lakes.zip | Shapefile with lake centroids and lake metrics calculated from the HBL lake timeseries. |
|
site-buffered_mask_tilename.tif Example: Yukon_Flats_Basin-buffered_mask_0769609.tif |
Buffered lake masks are used to track changes in lake area. Lake masks were created through a multi-step process involving classification of imagery. There is a GeoTIFF mask file for each 25 km x 25 km Planet Labs image tile – 465 total. File naming convention, where:
See Table 4 for respective study area UTM Zones. |
| Companion Files | |
| CubeSat_Buffered_Mask_Tiles.kmz | The .kmz file shows the outline of each 25 km x 25 km Planet Labs image tile – 465 total, at the 4 study areas. Each tile is identified by number along with the corresponding site-buffered_mask_tilename.tif file name. |
| ABoVE_grid_level_C_tile_IDs.csv | ABoVE grid level C tile IDs for each of the four study areas are provided in a companion file. There are 701 level C grid tiles. |
Data File Details & Properties:
SITE_Lake_Time_Series.csv. User Note: Most daily values for a lake are “NaN”, indicating that no image of the lake was captured on that day so no area could be derived.
Table 2. SITE_Lake_Time_Series.csv File structure
| Column name | Units/format | Description |
|---|---|---|
| Date | yyyy-mm-dd | Image date. May 1 – October 1, 2017. There are 154 rows. |
|
Lake_1 Lake_2 Lake_3 ... Lake_xxxxx |
Lake area in m2 | Column names are the lake IDs and the values are the respective lakes' area. The total number of lakes/columns for each study area is provided in a table below. |
The total number of lakes/columns for each study area and mean number of observations per lake.
| Study area | Number of lakes/columns | Mean number of valid area observations per lake. |
|---|---|---|
| Yukon Flats Basin | 8,854 | 37 |
| Mackenzie River Valley | 37,957 | 21 |
| Canadian Shield Transect | 21,560 | 32 |
| Hudson Bay Lowland | 16,987 | 31 |
Shapefiles: SITE_Lakes.zip
Four shapefiles (.zip), one for each study area, provide the location of the centroid of each lake and also provide seven metrics calculated from the lake area timeseries data.
User Notes: Depending on the shape of the lake, a lake’s centroid may not be contained within the lake itself. Lake IDs were assigned based on a 60 m buffered lake mask for each image tile. In some areas multiple lakes may thus be contained within the same lake ID if they are less than 60 m apart. To clarify exactly which areas are included in the lake area timeseries, use the lake masks *.tif files.
Table 3. Shapefile Attributes
| Variable | Description |
|---|---|
| X | Longitude of lake centroid (in WGS84) |
| Y | Latitude of lake centroid (in WGS84) |
| Tile | Number of the Planet Labs image grid tile containing that lake |
| ID | Lake ID number |
| Number_Observations | Number of valid area observations received by that lake between May 1 and October 1, 2017 |
| Mean_Area | Mean area of the lake (in m2) over the seasonal timeseries |
| Maximum_Area | Seasonal maximum observed lake area (m2) |
| Minimum_Area | Seasonal minimum observed lake area (m2) |
| Dynamism | The lake’s seasonal dynamism (m2), calculated as seasonal maximum minus seasonal minimum lake area |
| Percent_Dynamism | Seasonal dynamism divided by its maximum lake area (%) |
| Rchange | Rchange (stylized as RΔ in the manuscript) refers to the mean lateral distance (in m) between the lake’s maximum and minimum lake boundaries. |
GeoTIFF Files: site-buffered_mask_tilename.tif
Each file is 8000 x 8000 pixels (25 km x 25 km) with a resolution of 3.125 m per pixel
Each lake within the mask is assigned a unique integer that corresponds to the ID number in the SITE_Lake_Time_Series.csv file and lake centroid .shp file.
Table 4. GeoTIFF file details for each Study Area
| Study area | Number of mask files/image tiles | Projection details | EPSG |
|---|---|---|---|
| Yukon Flats Basin Lakes | 79 | WGS84_UTM_Zone_6N; WGS84_UTM_Zone_7N | 32606; 32607 |
| Mackenzie River Valley Lakes | 145 | WGS84_UTM_Zone_8N; WGS84_UTM_Zone_9N | 32608; 32609 |
| Canadian Shield Transect Lakes | 75 | WGS84_UTM_Zone_11N; WGS84_UTM_Zone_12N | 32611; 32612 |
| Hudson Bay Lowland Lakes | 166 | WGS84_UTM_Zone_14N; WGS84_UTM_Zone_15N | 32614; 32615 |
Companion File Details
The CubeSat_Buffered_Mask_Tiles.kmz file shows the outline of each 25 km x 25 km Planet Labs image tile – 465 total tiles – within the 4 study areas. Each tile is identified by number along with the corresponding site-buffered_mask_tilename.tif file name.
The file ABoVE_grid_level_C_tile_IDs.csv provides the ABoVE grid level C tile IDs for each of the four study areas.
Application and Derivation
The Arctic-Boreal region contains the highest density of lakes on Earth, and variability in lake extent serves as a useful indicator of diverse climatic and physiographic processes. Observing fine-scale changes has traditionally been difficult owing to the coarse spatial and temporal resolution of available satellite imagery, but CubeSats (mini satellites) allow for daily monitoring of lake area at 3-m resolution.
The high temporal resolution of this dataset enables mapping the full seasonal progression of lake area, and the high spatial resolution enables observation of fine-scale (<10 m) fluctuations along lake margins that were previously difficult to quantify with coarser resolution satellites. In total, this dataset contains > 2.2 million individual observations of lake area. Fluctuations in Arctic-Boreal lakes reflect climate change and regulate freshwater methane and CO2 emissions. This dataset will allow one to explore temporal dynamics of Arctic-Boreal lakes and improve estimates of trace gas flux.
The CubeSat-derived lake tracking method used to produce this dataset was specifically developed for large-scale applications. Therefore, the intended use of this dataset is for assessment of large-scale patterns in lake area dynamics rather than examination of individual lake timeseries. While it may still be useful for this purpose, the authors suggest caution when interpreting individual lake timeseries (Cooley et al. 2019).
Quality Assessment
Uncertainty values for individual lake area observation are not available as quantifying individual error over such a large dataset is very difficult. However, a summary of uncertainty values is provided. The machine learning observation filtering method used on images to remove poor quality lake area observations performs at 96-99% accuracy (depending on the study area), therefore inclusion of poor quality data is likely to be minimal. An uncertainty analysis was performed on lake metrics calculated from each timeseries. In brief, the normalized RMSE values for the lake metrics reported (namely mean lake area, maximum lake area, minimum lake area and seasonal dynamism) range from 1,248 m2 to 23,135 m2, or 0.6-3.6% of the maximum lake areas. A full discussion of sources of uncertainty can be found in the corresponding manuscript (Cooley et al., 2019).
Data Acquisition, Materials, and Methods
This dataset covers four Arctic-Boreal regions: the Yukon Flats Basin (YFB) in eastern interior Alaska, and the Mackenzie River Valley (MRV), Canadian Shield Transect (CST), and Hudson Bay Lowland (HBL) in Canada. These sites were chosen to cover diverse physiographic and climatic terrains and are co-located with targeted areas of NASA’s Arctic-Boreal Vulnerability Experiment (ABoVE).
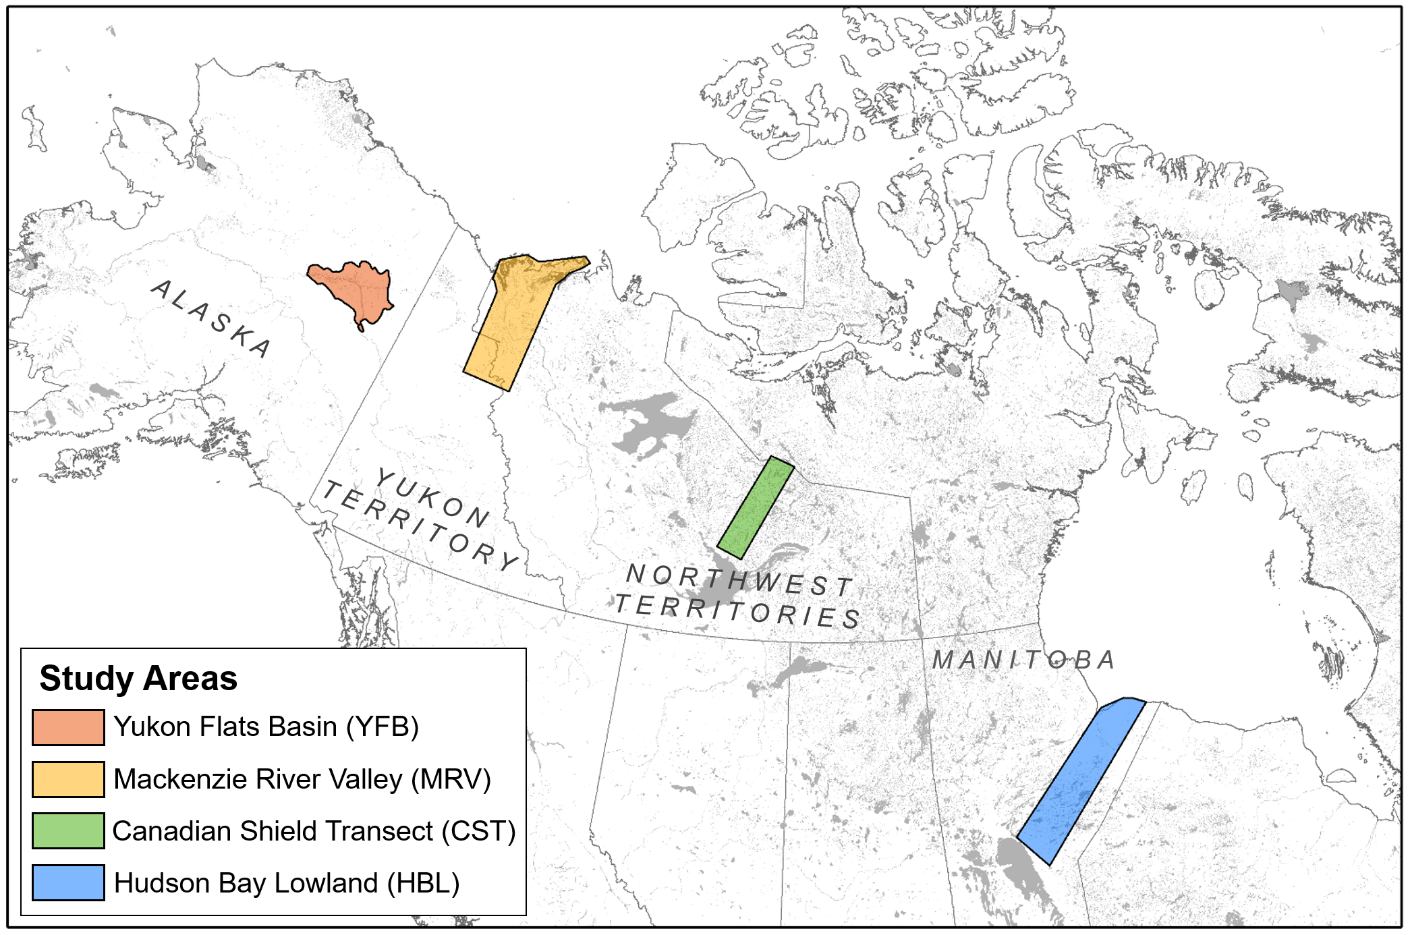
Figure 2. Location of four study areas within the ABoVE study domain.
The primary products of the dataset are the lake area timeseries created from near-daily CubeSat (Planet Team, 2018) imagery for all lakes with a maximum area >0.01 km2. These timeseries are created by (1) classifying all images into water/land based on a local Normalized Difference Water Index (NDWI) histogram threshold, (2) tracking changes in lake area calculating the total water contained within each lake object in a 60 m buffered mask, (3) using a supervised machine learning classification algorithm to remove poor quality observation, and (4) applying a 10 day median filter. A complete description of the methods can be found in Cooley et al. (2019).
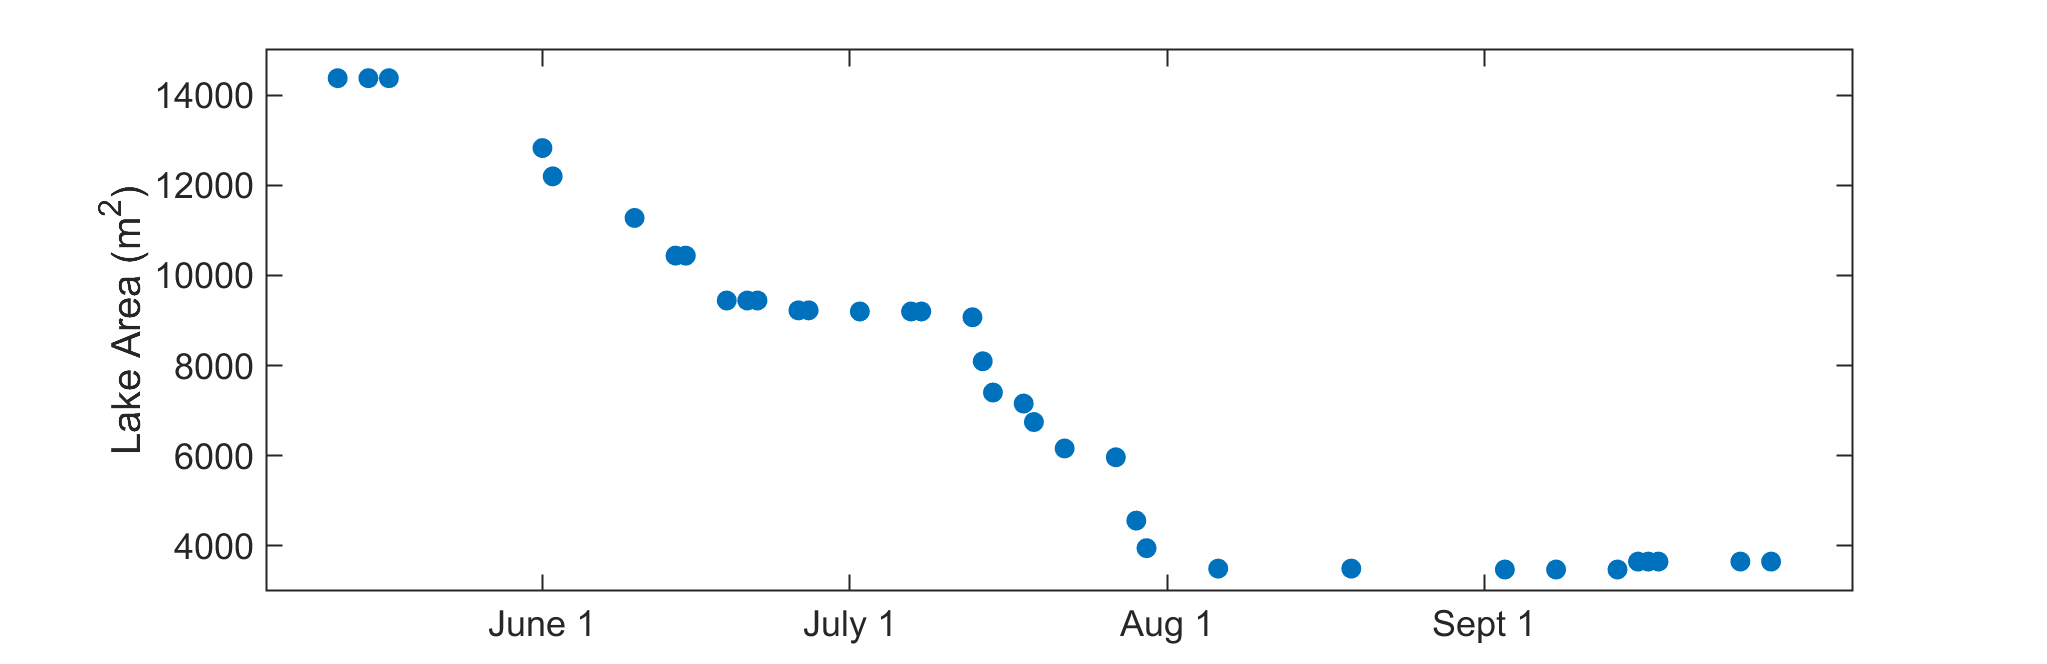
Figure 3. Example of an individual lake area timeseries between May 1 and October 1, 2017.
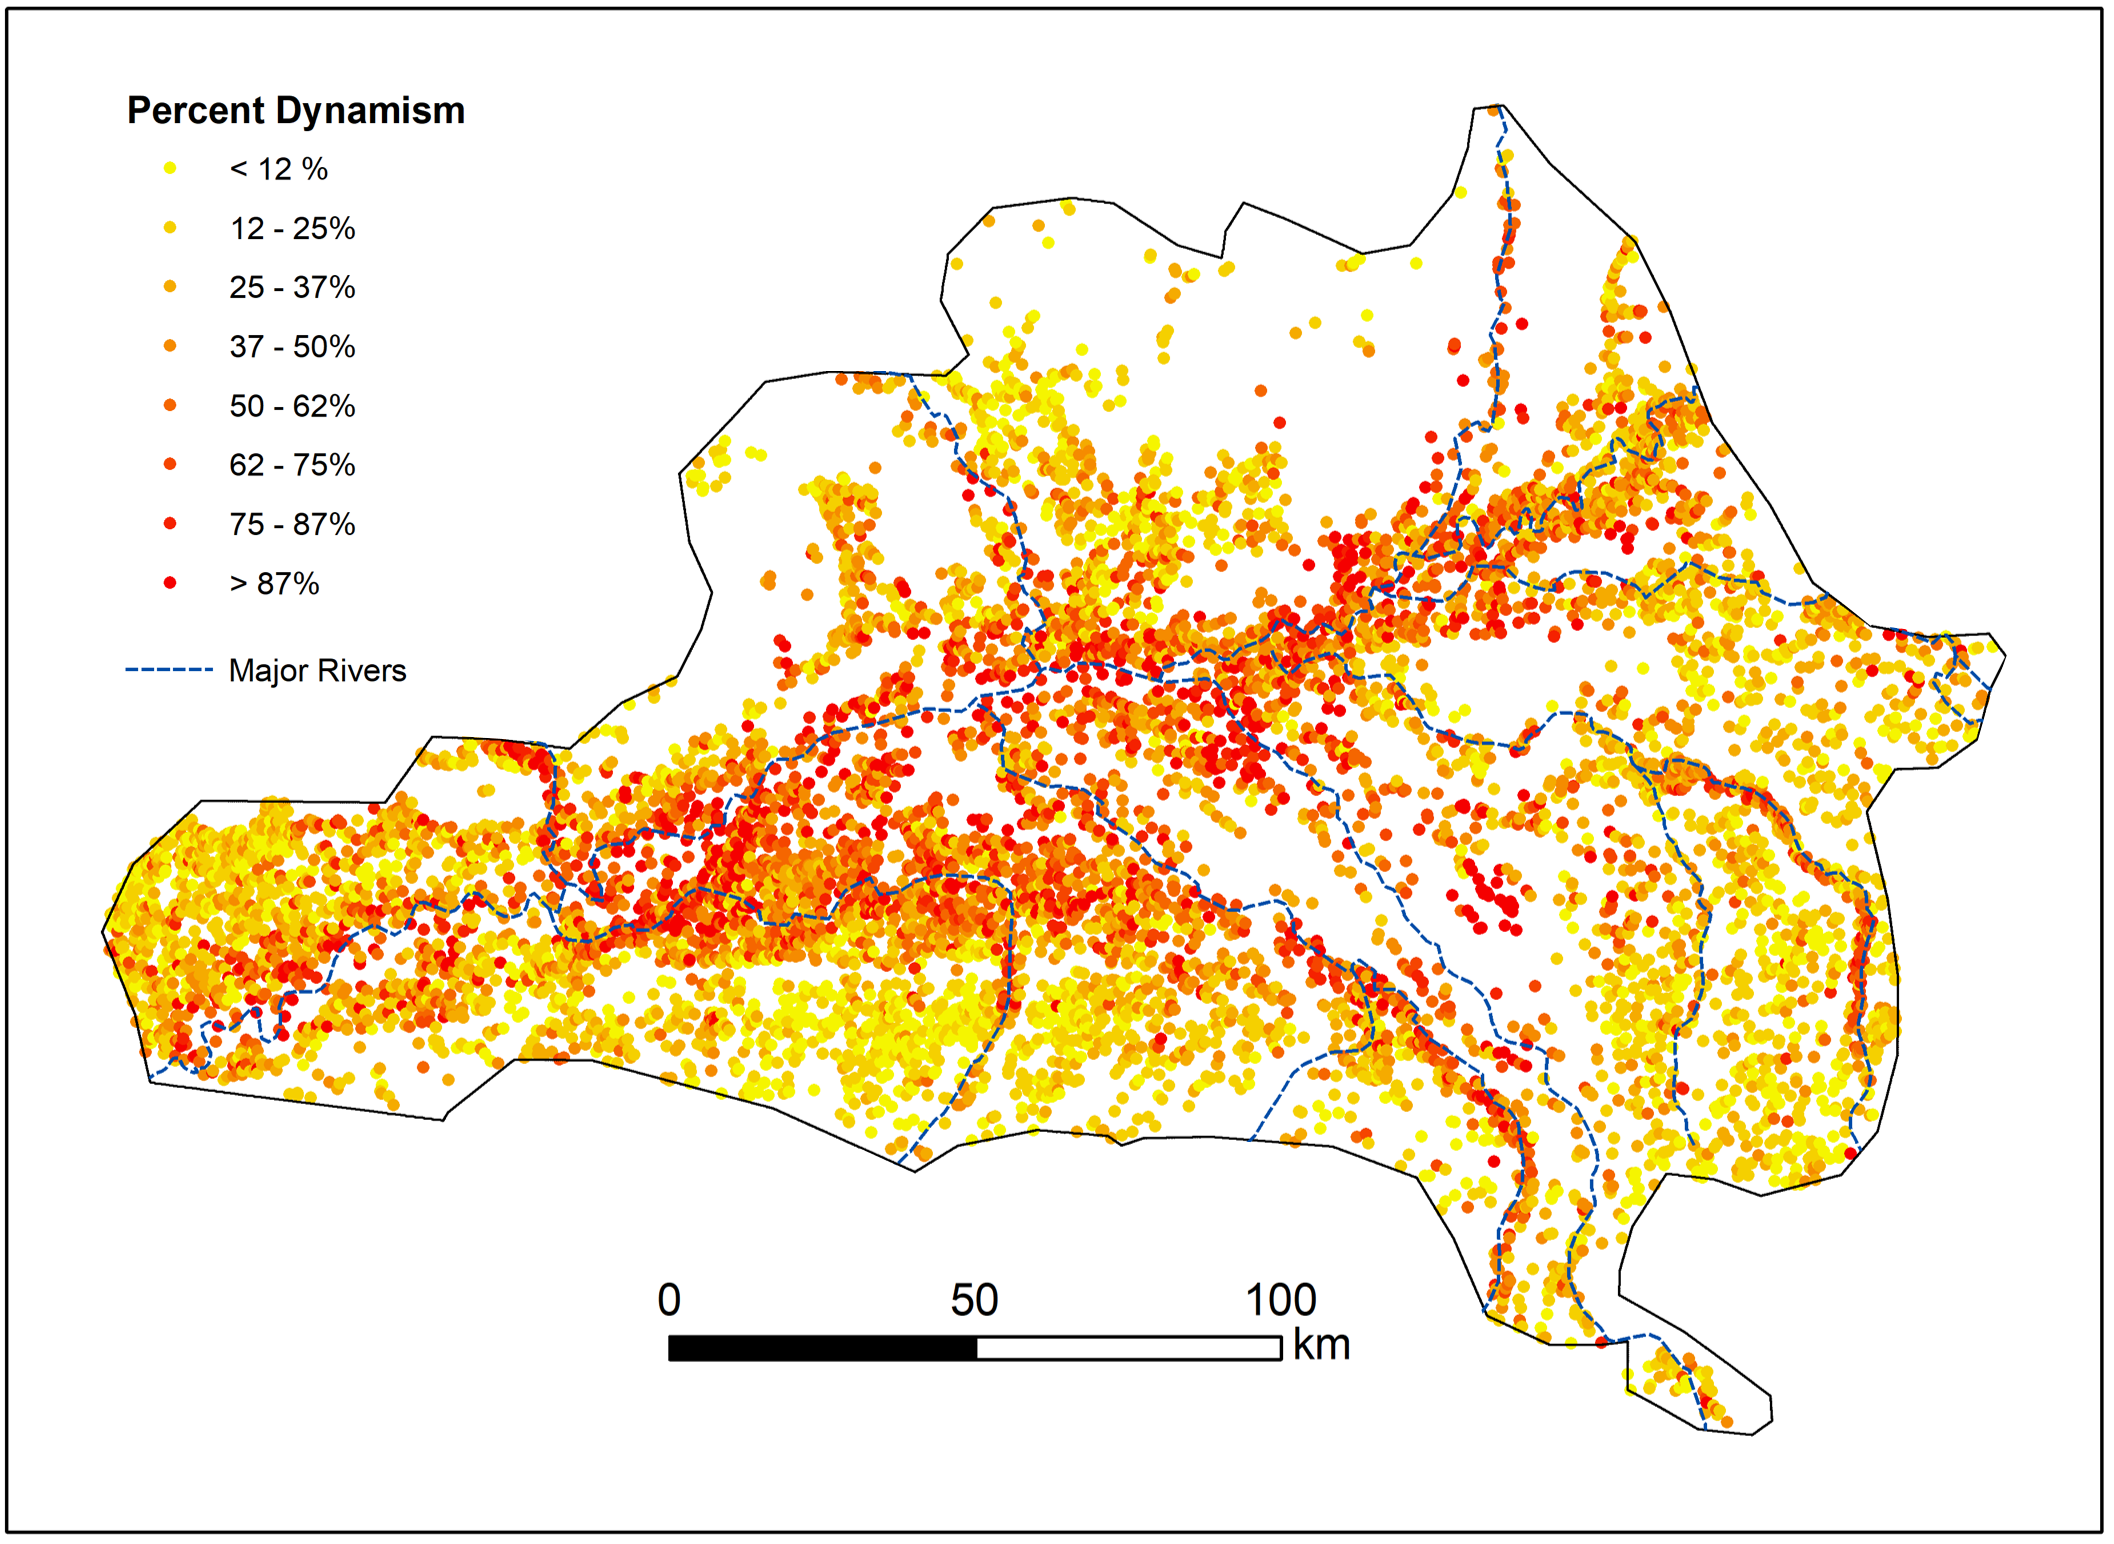
Figure 4. Lake centroid shapefile for the Yukon Flats Basin, Alaska. Each lake is represented by an individual circle (not to scale) and is colored by the lake’s percent dynamism (maximum – minimum seasonal lake area, divided by the maximum lake area). The Yukon River and its major tributaries are shown as blue dashed lines.
Changes in lake area extent were measured by applying a 60 m buffered lake mask to the classified images. This object-based method of lake tracking reduces the impact of geolocation error (Planet CubeSat’s stated geolocation accuracy is ~10m) and enables efficient detection given the large data volumes. Buffered lake masks were created through a multi-step process involving initial classification of all imagery between June 1 and July 15, 2017. The final mask is defined as all areas classified as water in at least 30% of images and is then buffered by 60 m. Each mask was manually checked to ensure that all lakes were included and all rivers were removed. Given the large size of the dataset, it is possible that some lakes have been missed or some small rivers reaches accidentally included. Lake area masks are not intended to represent the actual maximum boundary of a given lake; rather they represent each lake’s early season (typically maximum) extent plus an additional 60 m buffer. Additionally, the mask tiles overlap, so overlapping areas were removed to ensure that water bodies are not included in multiple masks.
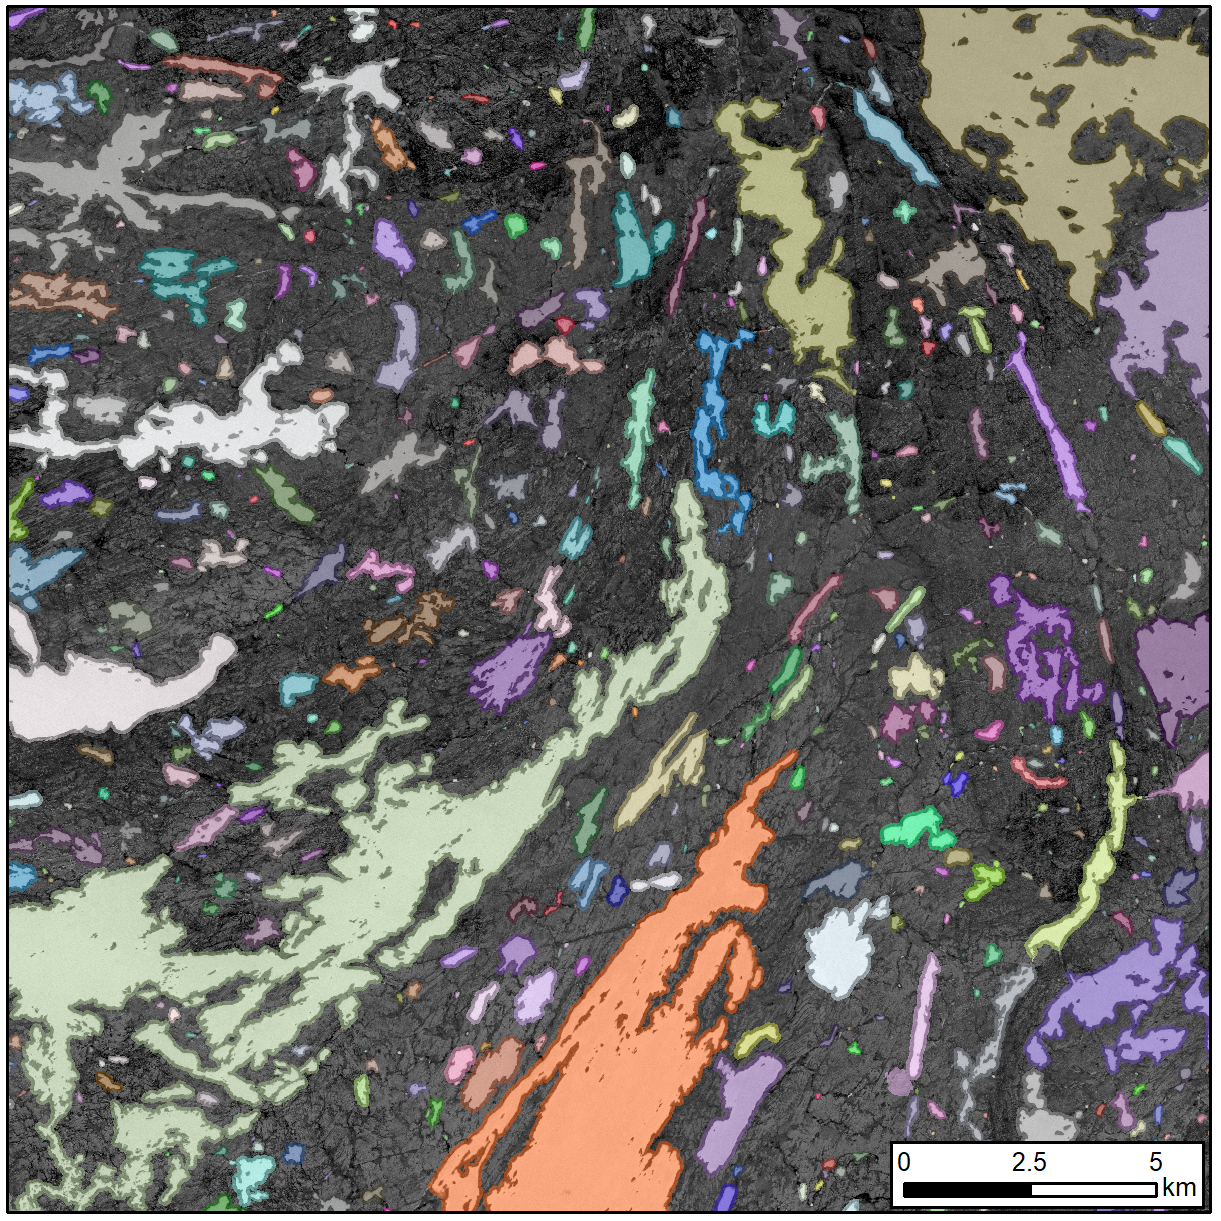
Figure 5. Example of a buffered lake mask, overlaid on an Normalized Difference Water Index (NDWI) image where lakes are white. Notice the 60 m buffered extending out from the lake margins.
The CubeSat-derived lake tracking method used to produce this dataset was specifically developed for large-scale applications. Therefore, the intended use of this dataset is for assessment of large-scale patterns in lake area dynamics rather than examination of individual lake timeseries. While it may still be useful for this purpose, the authors suggest caution when interpreting individual lake timeseries.
Data Access
These data are available through the Oak Ridge National Laboratory (ORNL) Distributed Active Archive Center (DAAC).
Timeseries of Arctic-Boreal Lake Area Derived from CubeSat Imagery, 2017
Contact for Data Center Access Information:
- E-mail: uso@daac.ornl.gov
- Telephone: +1 (865) 241-3952
References
Cooley, S.W., Smith, L.C., Ryan, J.C., Pitcher, L.H. and Pavelsky, T.M. 2019. Arctic-Boreal lake dynamics revealed using CubeSat imagery. Geophysical Research Letters, 46. https://doi.org/10.1029/2018GL081584
Planet Team. (2018). Planet application program interface: In space for life on Earth. San Francisco, CA. Retrieved from https://www.planet.com