Documentation Revision Date: 2024-02-29
Dataset Version: 1
Summary
The high latitudes cover ~20% of Earth’s land surface. This region is facing many changes in thermal, moisture and vegetation properties, driven by a warming climate. This dataset holds results from an analysis of remote sensing-informed records of key ecosystem indicators. The results can improve understanding of landscape-level changes measured using non-parametric trend detections and Getis-Ord Gi* spatial hotspot assessments.
This dataset holds 217 files: 206 cloud optimized GeoTIFFs, 10 shapefiles in compressed Zip archives, and one file in comma separated values (CSV) format.
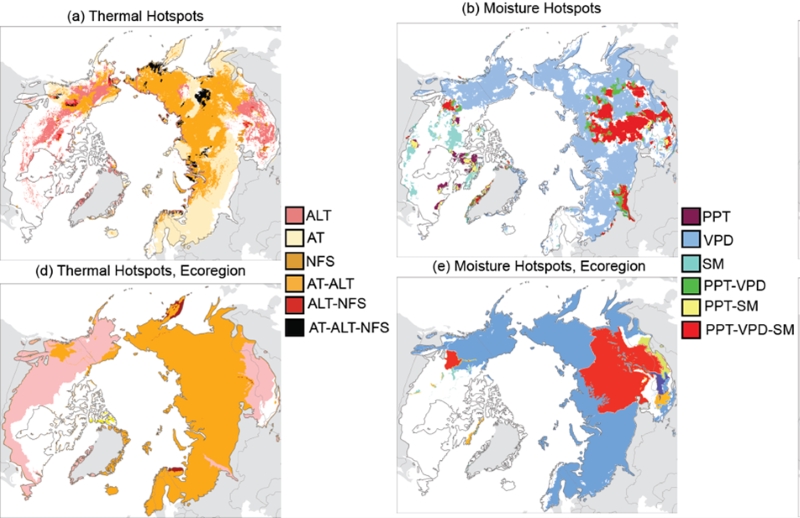
Figure 1. Multivariate change hotspot maps for the 1997 to 2020 period, according to select directional changes in thermal, moisture, and vegetation indicators. Thermal indicator includes: average increase in annual air temperature (AT, degrees C); increase in annual non-frozen season (NFS, days); and increase in annual active layer thickness (ALT, m). Moisture indicator includes: decrease in annual precipitation (PPT, mm); increase in annual vapor pressure deficit (VPD, kPa); and a decrease in annual non-frozen season soil moisture (SM, cm3 cm-3). Panels (a) and (b) show identified change based on pixel-level analyses; (d) and (e) show indicator change across individual ecoregions.
Citation
Watts, J.D., S. Potter, B.M. Rogers, A-M. Virkkala, G. Fiske, K. Arndt, A. Burrell, S. Natali, K. Butler, B. Gerlt, J. Grayson, T.A. Shestakova, J. Du, and Y. Kim. 2023. Trends of Thermal, Wetness, and Vegetative Change in the Circumpolar Arctic. ORNL DAAC, Oak Ridge, Tennessee, USA. https://doi.org/10.3334/ORNLDAAC/2322
Table of Contents
- Dataset Overview
- Data Characteristics
- Application and Derivation
- Quality Assessment
- Data Acquisition, Materials, and Methods
- Data Access
- References
Dataset Overview
This dataset provides estimates of trends in temperature, moisture, and vegetation changes over the circumpolar Arctic. Time series trends were measured by the Theil-Sen slope and associated p-values for a variety of variables including 2-meter air temperature, precipitation, soil moisture, non-frozen season days, permafrost active layer thickness, snow cover, vapor pressure deficit, land surface water fraction, normalized difference vegetation index (NDVI), and vegetation optical depth. Trends were measured annually and over specific seasons of spring (March to May), summer (June to August), autumn (September to November) and winter (December to February), and for the 1980-2020 and 1997-2020 time periods, depending on the variable and original data availability. Emerging hotspots of change were identified for the same variables and seasons, but only over the 1997-2020 period. In addition, a multivariate ranking was used to create combined hotspot layers to show areas of substantial changes in the thermal environment, moisture, and vegetation; these themes reflect landscape changes considered to be detrimental (e.g., a threat) to ecosystems and human populations. Ancillary files provide the boundaries of study regions, Brown permafrost regions, and a land cover product.
Project: ABoVE
The Arctic-Boreal Vulnerability Experiment (ABoVE) is a NASA Terrestrial Ecology Program field campaign being conducted in Alaska and western Canada, for 8 to 10 years, starting in 2015. Research for ABoVE links field-based, process-level studies with geospatial data products derived from airborne and satellite sensors, providing a foundation for improving the analysis, and modeling capabilities needed to understand and predict ecosystem responses to, and societal implications of, climate change in the Arctic and Boreal regions.
Related Publication:
Watts, J.D., S. Potter, B.M. Rogers, A.-M. Virkkala, G.Fiske, K.A. Arndt, A. Burrell, K. Butler, B. Gerlt, J. Grayson, T.A. Shestakova, J. Du, Y. Kim, F.-J. Parmentier, and S.M. Natali. 2024. Regional hotspots of change in northern high latitudes informed by observations from space. ESS Open Archive. https://doi.org/10.22541/au.170497370.03373595/v1
Related Datasets:
Related data are available on the ABoVE Project page.
Acknowledgements:
This work was supported by the NASA Terrestrial Ecology Program’s Arctic-Boreal Vulnerability Experiment (ABoVE) program (grant 80NSSC22K1245).
Data Characteristics
Spatial Coverage: Circumpolar Arctic
ABoVE Reference Locations
Domain: Core ABoVE
Cells: All "A" cells in the core ABoVE domain
Spatial Resolution: nominally 10 km
Temporal Coverage: 1980-01-01 to 2020-12-31
Temporal Resolution: Single estimates for each of two periods: 1980-2020 and 1997-2020
Study Areas: Latitude and longitude are given in decimal degrees.
| Site | Westernmost Longitude | Easternmost Longitude | Northernmost Latitude | Southernmost Latitude |
|---|---|---|---|---|
| Circumpolar Arctic | -180 | 180 | 90 | 30 |
Data File Information
This dataset holds 217 files: 206 cloud optimized GeoTIFFs, 10 shapefiles in compressed Zip archives, and one file in comma separated values (CSV) format.
GeoTIFF
The GeoTIFF files include estimates of change trends (Theil-Sen slope), statistical significance of slope estimates (pvalue), and hotspots of change for 12 remotely sensed indicators of change.
The file naming convention for most GeoTIFFs is <indicator>_<year1>_<year2>_<month1>_<month2>_<metric>.tif, where
- <indicator> = abbreviation for remotely sensed indicator variable (see Table 1).
- <year1> and <year2> = the beginning and ending years, respectively, of the period analyzed.
- <month1> and <month2> = the beginning and ending months, respectively, of the analysis period during the years studied. "1_12, annual period; "3_5", March to May (spring), "6_8", June to August (summer), "9_11", September to November (autumn ); and "12_2", December to February (winter).
- <metric> = "slope", "pvalue", or "hotspot" (see Table 2).
Twelve GeoTIFFs hold estimates of hotspots derived from a multivariate ranking of related indicators. The naming convention for these files is 1997_2020_<month1>_<month2>_<theme>_combined_hotspot.tif, where
- <theme> = "moisture", "thermal", or "vegetation"
The file land_cover.tif includes the distribution of tundra, boreal forest, boreal wetlands, and grass/shrub covers.
The nominal spatial resolution for the GeoTIFFs is 10,000 m (10 km).
Shapefiles
The shapefiles hold vector polygons of regions within the circumpolar study area. The file naming convention is <region>_shapefile.zip, where <region> =
- "arctic_domain", entire study area;
- "eurasia", Europe and Asia portions of the Arctic; "north_america", North American portion of the Arctic;
- "boreal", circumpolar boreal zone,
- "boreal_ea"; boreal region of Europe and Asia; "boreal_north_america", boreal region of North America;
- "tundra", circumpolar tundra;
- "tundra_eurasia", tundra region of Europe and Asia; "tundra_north_america", tundra region of North America
The brown_permafrost_shapefile.zip holds polygons denoting types of permafrost from Brown et al. (2002). Attributes of this file are included in the companion file Brown_permafrost_attributes.pdf.
User Note: The coordinate reference system (CRS) varies among the GeoTIFFs and shapefiles. The file CircumArctic_Trends_Hotspots_file_CRS.csv lists each file's CRS by EPSG code and proj4 string.
Files with EPSG 3410 are in NSIDC's EASE-Grid. Users should ensure that their spatial data software properly recognizes this EPSG code and/or its proj4 string. Please refer to EPSG.org or A Guide to EASE Grids (NSIDC, 2023) for a detailed definition of this CRS. Brodzik et al. (2012) provide more information about the EASE grids. A list of tools compatible with EASE grids is available from NSIDC.
Companion files
This dataset includes 14 companion files. The text files provide labels for the pixel values for the 1997_2020_<month1>_<month2>_<theme>_combined_hotspot.tif and land_cover.tif files that can be used to build legends for GIS layers. The file Brown_permafrost_attributes.pdf holds CRS and attribute information for brown_permafrost_shapefile.zip.
Table 1: Remotely sensed indicators of landscape-level change with associated theme.
| Abbreviation | Indicator | Units | Source |
|---|---|---|---|
| Thermal theme | |||
| ALT | Active layer thickness, annual maximum | m | Kim et al. (2017, 2021) |
| nfs | Non-frozen season | d | |
| tmean | Air temperature 2-m above land surface | degree C | Hall et al. (2001, 2002); Muñoz-Sabater et al. (2021) |
| Moisture theme | |||
| FW | Percent cover of surface water on land | percent | Du et al. (2017); Jones and Kimball (2021) |
| ppt | Monthly or annual average precipitation | m | Hall et al. (2001, 2002); Muñoz-Sabater et al. (2021) |
| SM | Soil moisture (volumetric) | m3 m-3 | |
| Snow | Percent snow cover | percent | |
| VPD | Vapor pressure deficit | kPa | |
| Vegetation theme | |||
| NDVI | Normalized difference vegetation index | 1 | Pinzon and Tucker (2014) |
| NTC | Percent cover of non-tree area | percent | Hansen & Song (2018) |
| TC | Percent cover of surface water on land | percent | |
| VOD | Vegetation optical depth | 1 | Moesinger et al. (2020) |
Table 2. Description of trend metrics.
| Metric | Units | Description |
|---|---|---|
| hotspot | 1 | Emerging hotspot value for years and months analyzed. Values: -3 (99% confidence of cold spot), -2 (95% confidence of cold spot), -1 (90% confidence of cold spot), 0 (no change), +1 (90% confidence of hotspot), +2 (95% confidence of hotspot), +3 (99% confidence of hotspot) |
| pvalue | 1 | Statistical significance of Theil-Sans slope |
| slope | (unit) y-1 | Theil-Sen slope for the indicator (Table 1). Magnitude is the unit of the indicator (Table 1) per year. For example, the unit for ALT_*_slope.tif is meters per year (m y-1). |
Table 3. Definition of pixel values in 1997_2020_<month1>_<month2>_moisture_combined_hotspot.tif.
| Pixel value | Hotspot drivers |
|---|---|
| 1 | Precipitation |
| 2 | Vapor pressure deficit |
| 3 | Soil moisture |
| 4 | Precipitation and Vapor pressure deficit |
| 5 | Precipitation and Soil moisture |
| 6 | Precipitation, Vapor pressure deficit, and Soil moisture |
Table 4. Definition of pixel values in 1997_2020_1_12_thermal_combined_hotspot.tif.
| Pixel value | Hotspot drivers |
|---|---|
| 1 | Active layer thickness |
| 2 | Air temperature |
| 3 | Non-frozen season length |
| 4 | Active layer thickness and Air temperature |
| 5 | Active layer thickness and Non-frozen season length |
| 6 | Active layer thickness, Non-frozen season length, and Air Temperature |
Table 5. Definition of pixel values in 1997_2020_3_5_thermal_combined_hotspot.tif., 1997_2020_9_11_thermal_combined_hotspot.tif, and 1997_2020_12_2_thermal_combined_hotspot.tif
| Pixel value | Hotspot drivers |
|---|---|
| 1 | Air temperature |
| 2 | Non-frozen season length |
| 3 | Air Temperature and Non-frozen season length |
Table 6. Definition of pixel values in 1997_2020_<month1>_<month2>_vegetation_combined_hotspot.tif.
| Pixel value | Hotspot drivers |
|---|---|
| 1 | Normalized difference vegetation index (NDVI) |
| 2 | Vegetation optical depth (VOD) |
| 3 | NDVI and VOD |
Table 7. Vegetation types in land_cover.tif.
| Pixel value | Vegetation type |
|---|---|
| 17, 18, 45, 47, 49, 62-64 | Boreal forest |
| 65, 60, 61 | Boreal wetland |
| 65 | Grass/shrub |
| All other values | Tundra |
Application and Derivation
These data are useful for examining how specific variables relating to climate, and more specifically thermal, moisture and vegetation have changed over time dating back to 1980 over the circumpolar arctic.
Quality Assessment
No quality assessment is provided. See Watts et al. (2024) for details of the associated research.
Data Acquisition, Materials, and Methods
Trends in temperature, moisture, and vegetation over the circumpolar Arctic were estimated from remotely sensed data products (Table 8). Data from 12 indicators were aggregated to quantify seasonal and annual trends.
The ERA5 2-m air temperature (tmean), precipitation (ppt) and vapor pressure deficit (VPD) records at monthly temporal resolution were aggregated to provide yearly grid cell averages (tmean, VPD) and totals (ppt) across annual (all months), as well as the spring (March-May), summer (June-August), and autumn (September-November) seasons each year. For air temperature, winter (December-February) averages were included.
The AMSR surface fractional water (FW) records were aggregated to averages for the spring (when flooding is typically more rampant), summer and autumn periods.
The non-frozen season (NFS) length was derived from the SMMR/SSMI/SSMIS Land Surface Freeze/Thaw State record using the “Combined” FT product (Kim et al., 2017, 2021), which uses information from morning and afternoon satellite passes. To identify the timing (i.e., day of year) and duration of annual surface frozen season for each grid cell, a “80% rule” moving window approach developed by Kim et al. (2012) for the northern hemisphere was applied. This approach identifies the primary date of annual surface thaw as the first day when 12 out of 15 consecutive days are classified as non-frozen (thawed) by the FT algorithm between January through June. The primary date of annual surface freeze is the first day when 12 out of 15 days are classified as frozen within the September through December period. Similarly, the 80% rule 15-day moving window approach was used to identify the first and last dates of annual snow cover within the ERA5 snow cover product. Annual surface non-frozen season length (NFS) was calculated for each grid cell (using each product’s native grid) as the total days between the identified thaw and freeze dates and identified snow-off and snow-on dates; NSF was also calculated for spring and autumn periods.
The annual and seasonal depths of soil thaw (ALT) for permafrost regions were estimated directly from the ESA CCI permafrost active layer thickness product. Soil moisture (SM) only included estimates over the annual non-winter period (spring through autumn).
For percent snow cover (SC), autumn, winter, and spring SC was calculated from the total pixel snow covered area as indicated by the ERA5 records for the given periods. SC was calculated per pixel, averaged by month, then averaged over the season. To assess annual SC within a domain, total seasonal coverages were summed.
For GIMMS3g normalized difference vegetation index (NDVI) and Vegetation Optical Depth Climate Archive (VODCA) vegetation optical depth (VOD) records, the grid cell data were aggregated to annual non-frozen season and to compute spring, summer and autumn averages for each year (excluding pixels where snow was present). Annual observations of per-pixel percent tree cover (TC) and non-tree cover (NTC) were obtained directly from the VCF5KYR v001 records.
Table 8. Description of remote sensing and model-based climate products used to identify regional changes in terrestrial properties across the Arctic-boreal permafrost zone. Key indicators of ecosystem condition were included to represent thermal state, landscape moisture, and vegetation. Observation frequency listed is native to the product
| Product | Indicator Description | Spatial Resolution | Temporal Period | Observation Frequency |
|---|---|---|---|---|
| Thermal theme | ||||
| ERA51 | Land Surface Air Temperature (tmean, °Celsius) | 0.1 degree | 1959 – 2020 | Monthly Average |
| SMMR; SSM/I; SSMIS2 | Land Surface Non-frozen State (NFS, binary) | 25 km | 1979 – 2020 | Daily |
| ESA CCI CRDP V.23 | Permafrost Active Layer Thickness (ALT, m) | 926 m | 1997 – 2019 | Annual Maximum |
| Moisture theme | ||||
| ERA51 | Precipitation (ppt, mm) | 0.1 degree | 1959 – 2020 | Monthly Total |
| Snow Cover (SC, percent) | Daily | |||
| Vapor Pressure Deficit (VPD, kPa) | Monthly Average | |||
| Near-surface Soil Moisture, depth 0-7 cm (SM, m3 m-3) | Monthly | |||
| AMSR-E; AMSR24 | Land Surface Water Fraction (FW, percent) | 25 km | 2003 – 2020 | Daily |
| Vegetation theme | ||||
| GIMMs3g5 | NDVI (unitless) | 0.08 degree | 1982 – 2020 | 15-day |
| VODCA6 | Ku-band Vegetation Optical Depth (VOD, unitless) | 0.25 degree | 1988 – 2017 | Daily |
| VCF5KYR v001 (AVHRR/MODIS)7 | Tree & Non-Tree Cover Fraction (TC and NTC, percent) | 0.05 degree | 1982 – 2016 | Annual |
Sources: 1Hall et al. (2001, 2002) and Muñoz-Sabater et al. (2021).; 2Kim et al. (2017, 2021); 3Obu et al. (2021); 4Du et al. (2017), Jones and Kimball (2021); 5Pinzon and Tucker (2014); 6Moesinger et al. (2020); 7Hansen & Song (2018).
Trend analysis
To identify trends in these indicators, a non-parametric Mann-Kendall test was applied that detects monotonic upward or downward trends. The ZYP package in R (https://cran.r-project.org/package=zyp, version 0.10-1.1) was used, which provides z-scores and associated p-values. Where statistically significant trends were detected, the rate of change was measured by the Theil-Sen estimator of slope (median-based) for each time series. This approach was applied according to region-based averages over:
- the full circumpolar Arctic domain, which encompasses northern North America (NA) and Eurasia (EA) zones;
- individual NA and EA zones;
- NA and EA zones separated according to tundra and boreal land cover. This approach has been used in past assessments of high latitude change. To detect finer grained patterns, this approach was applied to time series for individual pixels. This step revealed more localized changes that may not be reflected in Indicator averages over large regions.
These trends and their statistical significance are recorded in *_slope.tif and *_pvalue.tif files, respectively.
Change spot analysis
Unlike the Mann-Kendall approach, change spot analysis uses neighborhood-based statistics to detect significant clusters of change. Environmental Science Research Institute (ESRI; https://www.esri.com/) ArcGIS Pro version 2.9 software and the ESRI Emerging Hotspot Analysis (EHA; https://pro.arcgis.com/en/pro-app/2.8/tool-reference/space-time-pattern-mining/emerginghotspots.htm) algorithm was used for this purpose. To identify change “hotspots”, the EHA first applies a Getis-Ord Gi* spatial statistic, which examines each pixel within the context of the neighboring pixels. A pixel surrounded by neighboring high or low values is more likely to be a hot or cold change spot, respectively. The Getis-Ord Gi* statistic outputs z-scores and p-values and a hotspot bin classification. These hot and cold spot classifications are then evaluated with a Mann-Kendall trend test (Mann, 1945), which itself results in a z-score and p-value for each pixel within the temporal data. These z-scores and p-values are then used to determine the confidence of an emerging hot or cold spot. Output values range of values from -3 (99% confidence of a cold spot), -2 (95% confidence of a cold spot) -1 (90% confidence of a cold spot), 0 (no significant change), 1 (90% confidence of a hotspot), 2 (95% confidence of a hotspot), and 3 (99% confidence of a hotspot).
An EHA was first run on individual input Indicator variables according to annual and seasonal (winter, spring, summer, autumn) periods. The results are show in the *_hotspot.tif files.
A multivariate hotspot ranking was applied based on Thermal, Wetness, and Vegetation change scenario themes (see Table 8) for the period of 1997 to 2020. These themes reflect landscape changes considered to be detrimental (e.g., a threat) to ecosystems and human populations. The Thermal multivariate ranking was based on increasing air temperature (tmean), increasing non-frozen season length (NFS), and increasing active layer thickness (ALT). The Moisture multivariate ranking measures decreasing precipitation (ppt), increasing vapor pressure deficit (VPD) and decreasing soil moisture (SM). The vegetation ranking indicates decreasing NDVI and decreasing vegetation optical density (VOD. The authors acknowledge that in some low-lying regions (e.g., the Alaska Yukon-Kuskokwim Delta) an increase in precipitation may be detrimental if it contributes to local flooding, but “decreasing precipitation” was considered as having an undesired impact on the region because of its overall influence on drought and ecosystem susceptibility to fire.
For the ranking scheme, a score of “1” to pixels was applied to pixels where only an individual Indicator showed a hotspot according to the selected change scenarios. A score of “2” was assigned to pixels when two Indicators showed hotspots of change. A score of “3” was assigned to pixels where three Indicators showed hotspots of change (Tables 3-6). The theme-based multivariate hotspot rankings are included in the 1997_2020_<month1>_<month2>_<theme>_combined_hotspot.tif files.
Ancillary files include shapefiles of ecoregion boundaries from Olson et al. (2001) that represent the Circumpolar Arctic, North America, Eurasia, Boreal region, Tundra region, North American Boreal, North American Tundra, Eurasia Boreal and Eurasia Tundra. Permafrost categories were from Brown et al. (2002). The land cover product land_cover.tif was developed from merged vegetation cover from the Circumpolar Arctic Vegetation Map (CAVM; Walker et al., 2005) and the ESA CCI-LC 2010 Epoch land cover (Kirches et al., 2014).
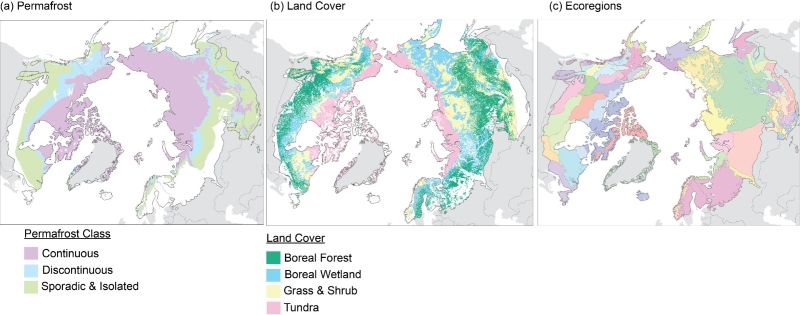
Figure 2. Maps showing the (a) spatial distribution of permafrost categories (continuous, discontinuous, sporadic/isolated; Brown et al., 2002), (b) land cover classes (Watts et al., 2024), and (c) delineations of the 58 ecoregions within the Arctic-boreal region (Olson et al., 2001).
See Watts et al. (2024) for details of the associated research.
Data Access
These data are available through the Oak Ridge National Laboratory (ORNL) Distributed Active Archive Center (DAAC).
Trends of Thermal, Wetness, and Vegetative Change in the Circumpolar Arctic
Contact for Data Center Access Information:
- E-mail: uso@daac.ornl.gov
- Telephone: +1 (865) 241-3952
References
Brodzik, M.J., B. Billingsley, T. Haran, B. Raup, and M.H. Savoie. 2012. EASE-Grid 2.0: Incremental but Significant Improvements for Earth-Gridded Data Sets. ISPRS International Journal of Geo-Information 1:32–45. https://doi.org/10.3390/ijgi1010032
Brown, J., O. Ferrians, J.A. Heginbottom, and E. Melnikov. 2002. Circum-Arctic Map of Permafrost and Ground-Ice Conditions, Version 2. NSIDC. https://doi.org/10.7265/skbg-kf16
Du, J., J.S. Kimball, L.A. Jones, Y. Kim, J. Glassy, and J.D. Watts. 2017. A global satellite environmental data record derived from AMSR-E and AMSR2 microwave Earth observations. Earth System Science Data 9:791–808. https://doi.org/10.5194/essd-9-791-2017
Hall, D.K., G.A. Riggs, and V.V. Salomonson. 2001. Algorithm Theoretical Basis Document (ATBD) for the MODIS Snow and Sea Ice-Mapping Algorithms. https://modis-snow-ice.gsfc.nasa.gov/?c=atbd
Hall, D.K., G.A. Riggs, V.V. Salomonson, N.E. DiGirolamo, and K.J. Bayr. 2002. MODIS snow-cover products. Remote Sensing of Environment 83:181–194. https://doi.org/10.1016/S0034-4257(02)00095-0
Hansen, M., and X.-P. Song. 2018. Vegetation Continuous Fields (VCF) Yearly Global 0.05 Deg. NASA EOSDIS Land Processes Distributed Active Archive Center. https://doi.org/10.5067/MEaSUREs/VCF/VCF5KYR.001
Jones, L., and J. Kimball. 2010. Daily Global Land Surface Parameters Derived from AMSR-E, Version 1. NASA National Snow and Ice Data Center Distributed Active Archive Center. http://dx.doi.org/10.5067/JIKQZ6WO5C5M
Kim, Y., J.S. Kimball, J. Glassy, and J. Du. 2017. An extended global Earth system data record on daily landscape freeze–thaw status determined from satellite passive microwave remote sensing. Earth System Science Data 9:133–147. https://doi.org/10.5194/essd-9-133-2017
Kim, Y., J. S. Kimball, J. Du, and J. Glassy. 2021. MEaSUREs Global Record of Daily Landscape Freeze/Thaw Status, Version 5. NASA National Snow and Ice Data Center Distributed Active Archive Center; Boulder, Colorado USA. https://doi.org/10.5067/LJ6SLXNJB2CQ
Kirches, G., C. Brockmann, M. Boettcher, M. Peters, S. Bontemps, C. Lamarche, M. Schlerf, M. Santoro, and P. Defourny. 2014. Land Cover CCI, Product User Guide, version 2. European Space Agency (ESA). https://www.esa-landcover-cci.org/?q=webfm_send/84
Mann, H.B. 1945. Non-parametric tests against trend, Econometrica 13:163-171.
Moesinger, L., W. Dorigo, R. de Jeu, R. van der Schalie, T. Scanlon, I. Teubner, and M. Forkel. 2020. The global long-term microwave Vegetation Optical Depth Climate Archive (VODCA). Earth System Science Data 12:177–196. https://doi.org/10.5194/essd-12-177-2020
Muñoz-Sabater, J., E. Dutra, A. Agustí-Panareda, C. Albergel, G. Arduini, G. Balsamo, S. Boussetta, M. Choulga, S. Harrigan, H. Hersbach, B. Martens, D.G. Miralles, M. Piles, N.J. Rodríguez-Fernández, E. Zsoter, C. Buontempo, and J.-N. Thépaut. 2021. ERA5-Land: a state-of-the-art global reanalysis dataset for land applications. Earth System Science Data 13:4349–4383. https://doi.org/10.5194/essd-13-4349-2021
NSIDC. 2023. A guide to EASE grids. National Snow and Ice Data Center; Boulder, Colorado. https://nsidc.org/data/user-resources/help-center/guide-ease-grids
Obu, J., S. Westermann, C. Barboux, A. Bartsch, R. Delaloye, G. Grosse, B. Heim, G. Hugelius, A. Irrgang, A.M. Kääb, C. Kroisleitner, H. Matthes, I. Nitze, C. Pellet, F.M. Seifert, T. Strozzi, U. Wegmüller, M. Wieczorek, and A. Wiesmann. 2021. ESA Permafrost Climate Change Initiative (Permafrost_cci): Permafrost active layer thickness for the Northern Hemisphere, v3.0. NERC EDS Centre for Environmental Data Analysis. http://dx.doi.org/10.5285/67a3f8c8dc914ef99f7f08eb0d997e23
Olson, D.M., E. Dinerstein, E.D. Wikramanayake, N.D. Burgess, G.V.N. Powell, E.C. Underwood, J.A. D'amico, I. Itoua, H.E. Strand, J.C. Morrison, C.J. Loucks, T.F. Allnutt, T.H. Ricketts, Y. Kura, J.F. Lamoreux, W.W. Wettengel, P. Hedao, K.R. Kassem. 2001. Terrestrial Ecoregions of the World: a new map of life on Earth: A new global map of terrestrial ecoregions provides an innovative tool for conserving biodiversity. BioScience 51:933-938. https://doi.org/10.1641/0006-3568(2001)051[0933:TEOTWA]2.0.CO;2
Pinzon, J., and C. Tucker. 2014. A Non-Stationary 1981–2012 AVHRR NDVI3g Time Series. Remote Sensing 6:6929–6960. https://doi.org/10.3390/rs6086929
Walker, D.A., M.K. Raynolds, F.J. A. Daniëls, E. Einarsson, A. Elvebakk, W.A. Gould, A.E. Katenin, S.S. Kholod, C.J. Markon, E.S. Melnikov, N.G. Moskalenko, S.S. Talbot, B.A.Yurtsev, and the other members of the CAVM Team. 2005. The Circumpolar Arctic vegetation map. Journal of Vegetation Science 16:267-282. https://doi.org/10.1111/j.1654-1103.2005.tb02365.x
Watts, J.D., S. Potter, B.M. Rogers, A.-M. Virkkala, G.Fiske, K.A. Arndt, A. Burrell, K. Butler, B. Gerlt, J. Grayson, T.A. Shestakova, J. Du, Y. Kim, F.-J. Parmentier, and S.M. Natali. 2024. Regional hotspots of change in northern high latitudes informed by observations from space. ESS Open Archive. https://doi.org/10.22541/au.170497370.03373595/v1