Documentation Revision Date: 2020-08-10
Dataset Version: 1
Summary
Needle-level ChlF was collected using an Optisciences OS-30p+ pulse amplitude modulated (PAM) fluorometer with leaf clips. Sampling was conducted during daylight hours with six observation periods over each of the two days at the Alaska site and seven observation periods over each of the two days at the Idaho site. Sampled foliage was allowed to acclimate to ambient light and temperature between instantaneous sampling events.
There is one data file with this dataset in comma-separated (.csv) format.
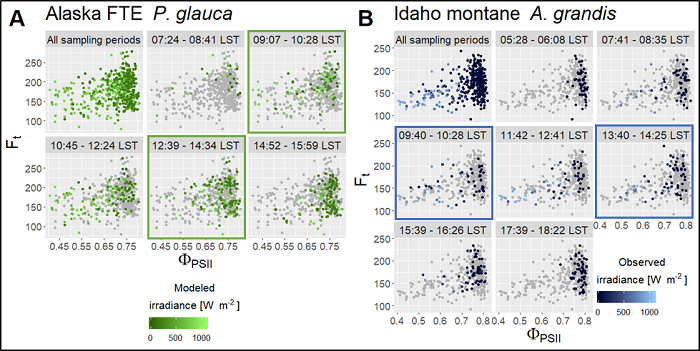
Figure 1. Relationship between the quantum yields of fluorescence (Ft) and photosystem II (Fv/Fm) sampled P. glauca needles in Alaska (A) and A. grandis needles in Idaho (B). Modeled (A) and observed (B) irradiance is indicated in coloration of points; grey points in individual sampling period panels show observations from all periods for reference. Plots of sampling periods aligned with timing of satellite overpasses are outlined in green (A) and blue (B) boxes, respectively (Maguire et al., 2020).
Citation
Maguire, A.J., J. Eitel, K. Griffin, S.C. Schmiege, S.G. Bruner, N. Boelman, and W. Weygint. 2020. ABoVE: Needle-Level Chlorophyll Fluorescence, Alaska and Idaho, USA, 2017 and 2019. ORNL DAAC, Oak Ridge, Tennessee, USA. https://doi.org/10.3334/ORNLDAAC/1785
Table of Contents
- Dataset Overview
- Data Characteristics
- Application and Derivation
- Quality Assessment
- Data Acquisition, Materials, and Methods
- Data Access
- References
Dataset Overview
This dataset provides the results of in situ measurements of needle-level chlorophyll fluorescence (ChlF) obtained from a pulse amplitude modulated (PAM) fluorometer from evergreen needleleaf forested sites one in Alaska and one in Idaho. Measured light-adapted minimal fluorescence (Ft) is reported as the quantum yield of fluorescence and light-adapted variable fluorescence over maximal fluorescence (Fv/Fm) and is reported as the quantum yield of photosystem II. Also reported for both sites are two modeled irradiance products: (1) the top-of-canopy instantaneous irradiance (W/m2) and (2) needle-level irradiance (W/m2) that was modeled to account for shadow casting and canopy orientation in modulating direct radiation. Both products were modeled to be contemporaneous with ChlF observations. At the Idaho site only, needle-level irradiance (W/m2) was measured in situ with a handheld pyranometer. The Alaska field site is located in the northern latitudinal forest-tundra ecotone (FTE) near the Dalton Highway in Northern Alaska. Thirty-six Picea glauca (white spruce) trees were sampled on 2017-07-07 to 2017-07-08. The Idaho field site is located in a montane forest near McCall, Idaho. Ten selected Abies grandis (grand fir) trees were sampled on 2019-07-05 to 2019-07-06. Measurement of needle-level ChlF occurred during clear-sky conditions such that the canopies experienced a broad range of variability in sunlit-shading patterns across the day during these near-solstice periods.
Needle-level ChlF was collected using an Optisciences OS-30p+ pulse amplitude modulated (PAM) fluorometer with leaf clips. Sampling was conducted during daylight hours with six observation periods over each of the two days at the Alaska site and seven observation periods over each of the two days at the Idaho site. Sampled foliage was allowed to acclimate to ambient foliage between instantaneous sampling events.
Project: Arctic-Boreal Vulnerability Experiment
The Arctic-Boreal Vulnerability Experiment (ABoVE) is a NASA Terrestrial Ecology Program field campaign based in Alaska and western Canada between 2016 and 2021. Research for ABoVE links field-based, process-level studies with geospatial data products derived from airborne and satellite sensors, providing a foundation for improving the analysis and modeling capabilities needed to understand and predict ecosystem responses and societal implications.
Related Publication
Maguire, A.J., J.U.H. Eitel, K.L. Griffin, T.S. Magney, N.T. Boelman, S.G. Bruner, J. Jennewein, J.E. Jensen, R.A. Long, S.C. Schmiege, L.A. Vierling, and W. Weygint. 2020. On the functional relationship between fluorescence and photochemical yields in complex canopies: Implications for interpreting large-scale solar-induced fluorescence measurements (in process).
Acknowledgments
This study was supported by the NASA ABoVE Terrestrial Ecology Program (grant NNX15AT86A), and the NASA FINESST Program (grant 80NSSC19K1341).
Data Characteristics
Spatial Coverage: Alaska, USA, near the Dalton Highway, and a montane forest near McCall, Idaho, USA
ABoVE Reference Locations
Domain: Core ABoVE
State/Territory: Alaska
Grid Cells: Ch046v022
Spatial Resolution: Point
Temporal Coverage: 2017-07-07 to 2017-07-08 at the Alaska site; 2019-07-05 to 2019-07-06 at the Idaho site.
Temporal Resolution: One-time measurements every 2-4 hours each of the 2-day sampling events
Study Area: Latitude and longitude are given in decimal degrees.
| Site | Westernmost Longitude | Easternmost Longitude | Northernmost Latitude | Southernmost Latitude |
|---|---|---|---|---|
| Full extent | -149.754 | -116.067 | 67.99472 | 44.90611 |
| Near Dalton Highway, Alaska | -149.754 | -149.754 | 67.99472 | 67.99472 |
| Near McCall, Idaho | -116.0667 | -116.0667 | 44.90611 | 44.90611 |
Data File Information
There is one data file in comma-separated (.csv) format with this dataset: needle_chlor_fluor.csv. This file provides needle leaf fluorescence yield, photosystem II yield, observed irradiance, modeled leaf-level irradiance, and modeled top-of-canopy irradiance made on spruce and fir needles at sites in Alaska and Idaho, USA.
Table 1. Variables in the data file
| Variable | Units | Description |
|---|---|---|
| site | Alaska or Idaho | |
| latitude | decimal degrees | Latitude of site |
| longitude | decimal degrees | Longitude of site |
| tree_ID | Unique tree identification | |
| leaf_ID | Unique leaf identification | |
| date | YYYY-MM-DD | Measurement date |
| time | YYYY-MM-DD HH:MM:SS | Time of measurement |
| Ft_yield | arbitrary units | Light-adapted minimal fluorescence (Fo): needle-level chlorophyll fluorescence (fluorescence yield) measured with a fluorometer |
| PSII_yield | unitless index | The ratio of variable to maximal fluorescence (Fv/Fm) as photosystem II yield (ΦPSII) |
| E_observed | W/m2 | Observed irradiance measured only at the Idaho site using a handheld PYR solar radiation sensor at sampled A. grandis needles |
| E_modeled | W/m2 | Modeled irradiance contemporaneous with ChlF observations |
| E_TOC | W/m2 | Calculated top-of-canopy irradiance contemporaneous with ChlF observations |
Application and Derivation
Though a strong correlation between SIF and GPP has been affirmed in previous work, these data support the mechanistic constraints on the light reactions of photosynthesis that govern ChlF. Few studies consider the role of irradiance modulated by complex canopies in driving a nonlinear relationship between the quantum yields of fluorescence and photochemistry. This dataset contributes to research that interprets remotely sensed SIF retrievals observed across a range of canopy irradiance.
Quality Assessment
The modeling approach correctly assigned 70% of the observations from Alaska and 80% of the observations from Idaho. This approach performed better for correctly classifying observations as NPQ-limited (78%) than as PQ-limited (57%); however, for the Idaho site this approach performed notably better for correctly classifying observations as PQ-limited (97%) than as NPQ-limited (60%). Interestingly, if using modeled irradiance to classify fluorescence observations from the Idaho site, this approach correctly assigned 86% of the observations as PQ-limited, whereas it correctly assigned only 25% of the observations as NPQ-limited (for an overall accuracy of 59%) See Maguire et al. (2020) for details.
Data Acquisition, Materials, and Methods
Study Area
Field data were collected at two evergreen needleleaf sites: the latitudinal forest-tundra ecotone (FTE) near the Dalton Highway, Alaska, USA (730 m elevation) on July 7-8, 2017 and a montane forest near McCall, Idaho, USA (1,595 m elevation) on July 5-6, 2019. The Alaska site is dominated by white spruce (Picea glauca), whereas the Idaho site has an understory of grand fir (Abies grandis) with an overstory of ponderosa pine (Pinus ponderosa) and Douglas fir (Pseudotsuga menziesii). During sampling average daily temperature was 18.0° C and 17.0° C for the Alaska and Idaho sites, respectively. Average daily soil moisture for the Idaho site was 0.11. Soil moisture data are not available for the Alaska site.
Needle-level Chlorophyll Fluorescence Measurements
Sampling of needle-level chlorophyll fluorescence occurred during clear-sky conditions such that the canopies experienced a broad range of variability in sunlit-shading patterns across the day during these near-solstice periods. Four groups of needles on each of 36 P. glauca study trees (n = 144) and six groups of needles on each of 10 A. grandis study trees (n = 60), distributed along the periphery of tree crowns, were selected at the Alaska site and the Idaho site, respectively.
In situ ChlF was measured for each group of needles using an Optisci OS30p+, a pulse amplitude modulated (PAM) fluorometer employing a red actinic light (Opti-Sciences, Inc. Hudson, New Hampshire, USA) at a saturating light intensity of 3500 μmol m−2 s−1. Sampled needles were marked to enable repeated measurement and leaf clips were removed in between each measurement to allow for foliage to adapt to ambient light conditions. P. glauca needles were sampled six times during daylight hours across the two sampling days; A. grandis needles were sampled six times during daylight hours on the first day and once again shortly after sunrise on the second day. Referred to as two measured parameters, the ratio of variable to maximal fluorescence (Fv/Fm) and light-adapted minimal fluorescence (Fo), as photosystem II yield (ΦPSII) as fluorescence yield (Ft), respectively (Genty et al., 1989).
Observed Irradiance (Idaho Site Only)
A handheld PYR solar radiation sensor (Meter, Inc., Pullman, WA) was used to measure irradiance at sampled A. grandis needles from the Idaho site, concurrent with ChlF measurement. The instrument measures incoming radiation across the 360–1120 nm spectrum at a resolution of 1 W m-2. In situ observations of irradiance were not collected at the Alaska site.
Remote Sensing Data for Modeling Needle-level Irradiance
In 2011, airborne Lidar data (8 points m-2) were acquired over a 6 km x 1.5 km footprint in the Brooks Range of Alaska (Hubbard et al., 2011), covering the extent of the in situ ChlF sampling locations. Despite the temporal difference in the acquisition of the ChlF and Lidar datasets, it was assumed that the Lidar surveys appropriately represent canopy structure at the time of ChlF sampling due to slow vegetation growth rates (Jensen et al., 2020).
Contemporaneous with field sampling in Idaho in 2019, terrestrial Lidar data (>1 point cm-2) were collected for a 150 m x 150 m footprint covering the extent of the in situ ChlF sampling locations and surrounding vegetation that may obscure direct solar exposure. Sampled needles were labeled such that Lidar scanning would enable visual determination of locations in the resulting point cloud. This sampling enabled sub centimeter precision when determining the coordinates of each sampling location.
A rasterized digital canopy surface model (DSM) of the Alaska site was interpolated from the airborne Lidar dataset at 0.5 m resolution using the R package "lidR" (Roussel et al., 2017). A DSM of the Idaho site was interpolated from the terrestrial Lidar dataset at 0.10 m resolution using the R packages "akima" (Akima et al., 2016).
Sampled trees at the Alaska site were identified using an individual tree detection algorithm and validated with field measurements. DSM pixels collocated with sampled needles were manually selected using canopy height value and directional location within tree crown boundaries. The sample population was limited to pixels with canopy height value 1.0–3.0 m, as a reasonable approximation of sampling height (1.5 m). Similarly, pixels were only retained in the sample population that could be identified as exclusively corresponding to a given cardinal direction (e.g., for crowns composed of a two-by-two pixel square, no sampling locations from that crown could be unambiguously assigned to a single unique pixel). If multiple pixels fit the criteria for a given sampling location all pixels were selected and the average irradiance was used. Following this approach, coordinates of 89 P. glauca sampling locations were approximated.
Sampled trees at the Idaho site were identified from labels affixed to tree boles visible in terrestrial lidar data. Coordinates of sampling locations were extracted by manually selecting terrestrial lidar returns in the point cloud. Coordinates of all 60 A. grandis sampling locations were unambiguously determined (Maguire et al., 2020).
Modeled Irradiance
The R package ‘insol’ (Corripio, 2003, 2015) was used to model instantaneous irradiance for sampling locations using the DSMs, geographic location, and atmospheric and surface reflectance parameters, the latter of which were interpolated from satellite remote sensing datasets (Levelt et al., 2006; Mesinger et al., 2006; “North American Regional Reanalysis (NARR),” n.d.). This approach enables estimation of direct and diffuse solar irradiance through two steps: (1) top-of-canopy (TOC) direct and diffuse irradiance were calculated based on atmospheric conditions and solar geometry; (2) TOC direct irradiance modulated by canopy surface, accounting for the surface aspect of individual DSM pixels (based on neighborhood analysis) relative to the normal of the incident solar angle. Next, the DSM was used to simulate shadow casting. Direct irradiance for pixels classified as shaded was nullified, hence shaded pixels were effectively only TOC diffuse radiation. Non-zero direct irradiance values were added to TOC diffuse irradiance to yield modeled irradiance for each sampling location (Maguire et al., 2020).
Data Access
These data are available through the Oak Ridge National Laboratory (ORNL) Distributed Active Archive Center (DAAC).
ABoVE: Needle-Level Chlorophyll Fluorescence, Alaska and Idaho, USA, 2017 and 2019
Contact for Data Center Access Information:
- E-mail: uso@daac.ornl.gov
- Telephone: +1 (865) 241-3952
References
Akima, H., A. Gebhardt, T. Petzold, and M. Maechler. 2016. Package “akima.” http://cran.r-project.org/package=akima
Corripio, J.G. 2015. Package "insol." https://CRAN.R-project.org/package=insol
Corripio, J.G. 2003. Vectorial algebra algorithms for calculating terrain parameters from DEMs and solar radiation modelling in mountainous terrain. International Journal of Geographical Information Science, 17(1):1–23. https://doi.org/10.1080/713811744
Genty, B., Briantais, J.M., and N.R. Baker. 1989. The relationship between the quantum yield of photosynthetic electron transport and quenching of chlorophyll fluorescence. Biochimica et Biophysica Acta (BBA) - General Subjects, 990(1):87–92. https://doi.org/10.1016/S0304-4165(89)80016-9
Hubbard, T.D., R.D. Koehler, and R.A. Combellick. 2011. High-resolution lidar data for Alaska infrastructure corridors. Alaska Division of Geological & Geophysical Surveys. http://doi.org/10.14509/22722
Jensen, J.L.R. 2020. Despite the temporal difference in the acquisition of the ChlF and Lidar datasets, it was assumed that the Lidar surveys appropriately represent canopy structure at the time of ChlF sampling due to slow vegetation growth rates. In preparation.
Levelt, P. F., G.H.J van den Oord, M.R. Dobber, A. Mälkki, H. Visser, J. de Vries, J., et al. 2006. The ozone monitoring instrument. IEEE Transactions on Geoscience and Remote Sensing, 44(5):1093–1101. http://ieeexplore.ieee.org/lpdocs/epic03/wrapper.htm?arnumber=1624601
Maguire, A.J., J.U.H. Eitel, K.L. Griffin, T.S. Magney, R.A. Long, L.A. Vierling, et al. 2020. On the functional relationship between fluorescence and photochemical yields in complex evergreen needleleaf canopies. Geophysical Research Letters, 46:e2020GL087858. https://doi.org/10.1029/2020GL087858
Mesinger, F., G. DiMego, E. Kalnay, K. Mitchell, P.C. Shafran, W. Ebisuzaki, et al. 2006. North American Regional Reanalysis. Bulletin of the American Meteorological Society, 87(3):343–360. https://doi.org/10.1175/BAMS-87-3-343
North American Regional Reanalysis (NARR). (n.d.). Retrieved March 20, 2018. https://www.ncdc.noaa.gov/data-access/model-data/model-datasets/north-american-regional-reanalysis-narr
Roussel, J.R., D. Auty, F. De Boissieu, and A.S. Meador. 2017. Package "lidR." https://CRAN.R-project.org/package=lidR