Documentation Revision Date: 2024-10-31
Dataset Version: 1
Summary
This dataset holds 60 NetCDFs and three files in cloud optimized GeoTIFF (COG) format.
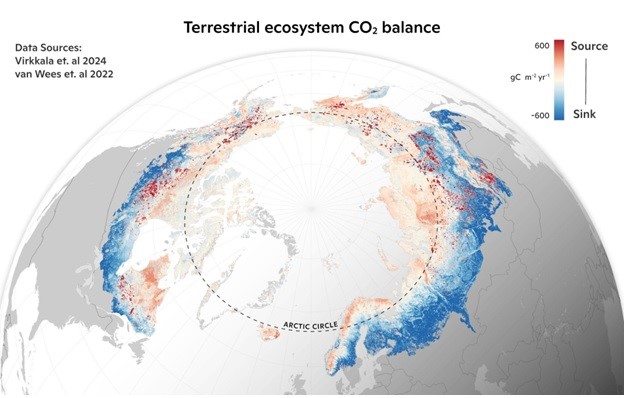
Figure 1. Annual average terrestrial net ecosystem exchange (NEE) and direct fire emissions from 2002-2020 showing areas with net CO2 sinks (i.e. areas taking up CO2 from the atmosphere) and net CO2 sources (i.e. releasing net CO2 emissions to the atmosphere) (Virkkala et al., 2024).
Citation
Virkkala, A-M., B.M. Rogers, J.D. Watts, K. Arndt, S. Potter, I. Wargowsky, and S. Natali. 2024. Machine learning-based Arctic-boreal terrestrial ecosystem CO2 fluxes, 2001-2020. ORNL DAAC, Oak Ridge, Tennessee, USA. https://doi.org/10.3334/ORNLDAAC/2377
Table of Contents
- Dataset Overview
- Data Characteristics
- Application and Derivation
- Quality Assessment
- Data Acquisition, Materials, and Methods
- Data Access
- References
Dataset Overview
This dataset provides gridded estimates of gross primary productivity (GPP), ecosystem respiration (Reco), and net ecosystem CO2 exchange (NEE) across the circumpolar terrestrial Arctic-boreal region at a 1-km spatial resolution. Monthly CO2 flux data from 2001 to 2020 were generated using terrestrial eddy covariance and chamber CO2 flux observations, combined with geospatial meteorological, remote sensing, topographical and soil data, all within a random forest modeling framework. Aggregated average annual NEE, average annual NEE with direct fire emissions added based on the GFED product, and temporal trends in annual NEE rasters over 2002-2020 are also included.
Project: Arctic-Boreal Vulnerability Experiment
The Arctic-Boreal Vulnerability Experiment (ABoVE) is a NASA Terrestrial Ecology Program field campaign being conducted in Alaska and western Canada for 8 to 10 years, starting in 2015. Research for ABoVE links field-based, process-level studies with geospatial data products derived from airborne and satellite sensors, providing a foundation for improving the analysis, and modeling capabilities needed to understand and predict ecosystem responses to, and societal implications of, climate change in the Arctic and Boreal regions.
Related Publication:
Virkkala, A.-M., B.M. Rogers, J.D. Watts, K.A. Arndt, S. Potter, I. Wargowsky, E.A.G. Schuur, C. See, M. Mauritz, J. Boike, S.M. Bret-Harte, E.J. Burke, A. Burrell, N. Chae, A. Chatterjee, F. Chevallier, T.R. Christensen, R. Commane, H. Dolman, B. Elberling, C.A. Emmerton, E.S. Euskirchen, L. Feng, M. Goeckede, A. Grelle, M. Helbig, D. Holl, J. Järveoja, H. Kobayashi, L. Kutzbach, J. Liu, In. Liujkx, E. López-Blanco, K. Lunneberg, I. Mammarella, M.E. Marushchak, M. Mastepanov, Y. Matsuura, T. Maximov, L. Merbold, G. Meyer, M.B. Nilsson, Y. Niwa, W. Oechel, S.-J. Park, F.-J.W. Parmentier, M. Peichl, W. Peters, R. Petrov, W. Quinton, C. Rödenbeck, T. Sachs, C. Schulze, O. Sonnentag, V. St. Louis, E.-S. Tuittila, M. Ueyama, A. Varlagin, D. Zona, and S.M. Natali. 2024. Wildfires offset the increasing but spatially heterogeneous Arctic-boreal CO2 uptake. Nature Climate Change (in review). Preprint at https://doi.org/10.1101/2024.02.09.579581
Related Dataset:
Virkkala, A-M., S. Natali, B.M. Rogers, J.D. Watts, K. Savage, S.J. Connon, M.E. Mauritz-tozer, E.A.G. Schuur, D.L. Peter, C. Minions, J. Nojeim, R. Commane, C.A. Emmerton, M. Goeckede, M. Helbig, D. Holl, H. Iwata, H. Kobayashi, P. Kolari, E. Lopez-blanco, M.E. Marushchak, M. Mastepanov, L. Merbold, M. Peichl, O. Sonnentag, T. Sachs, M. Ueyama, C. Voigt, M. Aurela, J. Boike, G. Celis, N. Chae, T. Christensen, S. Bret-Harte, S. Dengel, H. Dolman, C. Edgar, B. Elberling, S.E. Euskirchen, A. Grelle, J. Hatakka, E.R. Humphreys, J. Jaerveoja, A. Kotani, L. Kutzbach, T. Laurila, A. Lohila, I. Mammarella, Y. Matsuura, G. Meyer, M.B. Nilsson, S.F. Oberbauer, S.J. Park, F.J.W. Parmentier, R. Petrov, A.S. Prokushkin, S. Zyrianov, C. Schulze, V.L. St.louis, E.S. Tuittila, J.P. Tuovinen, W. Quinton, A. Varlagin, D. Zona, and V.I. Zyryanov. 2021. The ABCflux Database: Arctic-Boreal CO2 Flux and Site Environmental Data, 1989-2020. ORNL DAAC, Oak Ridge, Tennessee, USA. https://doi.org/10.3334/ORNLDAAC/1934
- This source provided input data for training the machine learning model.
Acknowledgments:
This work was supported by the NASA Arctic-Boreal Vulnerability Experiment and Carbon Cycle Science programs (grant NNX17AE13G), National Science Foundation (NSF) PLR Arctic System Science Research Networking Activities (grant 1931333) and Division of Environmental Biology (grants DEB LTREB 1354370, 2011257, DEB-0425328, DEB-0724514, and DEB-0830997), US Geological Survey Climate R&D Program, the NSF Arctic Observatory Network (grants 1936752, 1503912, 1107892), Gordon and Betty Moore Foundation (grant 8414), and funding catalyzed by the TED Audacious Project (Permafrost Pathways). Additional sources of support are listed in Virkkala et al. (2024).
Data Characteristics
Spatial Coverage: Arctic and boreal regions (tundra and boreal biomes), >49 degrees north latitude.
Spatial Resolution: 1 km
Temporal Coverage: 2001-01-01 to 2020-12-31
Temporal Resolution: Monthly
Site Boundaries: Latitude and longitude are given in decimal degrees.
| Site | Westernmost Longitude | Easternmost Longitude | Northernmost Latitude | Southernmost Latitude |
| Arctic and boreal regions | -180 | 180 | 90 | 33.69 |
User note: The areas of interest have latitudes >=49 degrees north; however, the data layers extend farther south due to the map projection used.
Data File Information
This dataset holds 60 NetCDFs (*.nc) and three files in cloud optimized GeoTIFF (*.tif) format.
The NetCDFs hold monthly cumulative estimates of CO2 flux in units of (g C m-2 month-1 x 10,000). For net ecosystem exchange (NEE), negative values indicate net CO2 sinks while postive values indicate CO2 sources. For both gross primary production (GPP) and ecosystem respiration (Reco), higher values indicate larger fluxes.
The values are in a projected coordinate system (ESRI: 102017; see GeoTIFF information below) at 1-km spatial resolution. Months are calendar months and vary in length from 28-31 days. The monthly time steps are measured in days since 2001-01-01 recorded in the time variable. Months are denoted by the middle day of each month.
The file naming convention for NetCDFs is CO2Fluxes_Arctic_Boreal_<variable>_<year>.nc, where
- <variable>: "GPP" for gross primary productivity, "NEE" for net ecosystem exchange, or "Reco" for ecosystem respiration.
- <year> : the year for the estimates from 2001 to 2020.
There are three GeoTIFFs:
CO2Fluxes_Arctic_Boreal_NEE_2002_2020_avg.tif : mean annual terrestrial NEE over 2002-2020. Negative values = net ecosystem CO2 uptake (i.e. net ecosystem CO2 sink); Positive values = net ecosystem CO2 emissions (i.e. net ecosystem CO2 source).
CO2Fluxes_Arctic_Boreal_NEEfire_2002_2020_avg.tif : mean annual terrestrial NEE plus direct fire emissions over 2002-2020.
CO2Fluxes_Arctic_Boreal_NEE_2002_2020_annual_trend_senslope.tif : temporal trend (change) in annual terrestrial NEE over 2002-2020. Negative values = increasing net ecosystem CO2 uptake; Positive values = increasing net ecosystem CO2 emissions. Note that a pixel might be on average a net ecosystem CO2 sink (i.e. negative values in CO2Fluxes_Arctic_Boreal_NEE_2002_2020_avg.tif), but its temporal trend might be positive.
GeoTIFF characteristics:
- Pixel values: g C m-2 yr-1
- Coordinate system: WGS 1984 Lambert Azimuthal EqArea North Pole, ESRI: 102017.
proj4 string: "+proj=laea +lat_0=90 +lon_0=0 +x_0=0 +y_0=0 +datum=WGS84 +units=m" - Spatial resolution: nominal 1000 m
- Dimensions: 8933 columns x 7401 rows
- Nodata value: -9999
Note that there is no data layer for the temporal trend for the annual terrestrial NEE plus direct fire emissions.
Application and Derivation
The dataset provides gridded monthly NEE, GPP, and Reco over the Arctic-boreal region from 2001-2020. The gridded fluxes were used to obtain cumulative regional estimates in Tg C yr-1 with and without direct fire emissions included (Figure 2). The data layers and budgets can be used to detect carbon flux hotspots, monitor and understand changes in Arctic-boreal carbon cycling, and for comparison against estimates from inversion and process-based models.
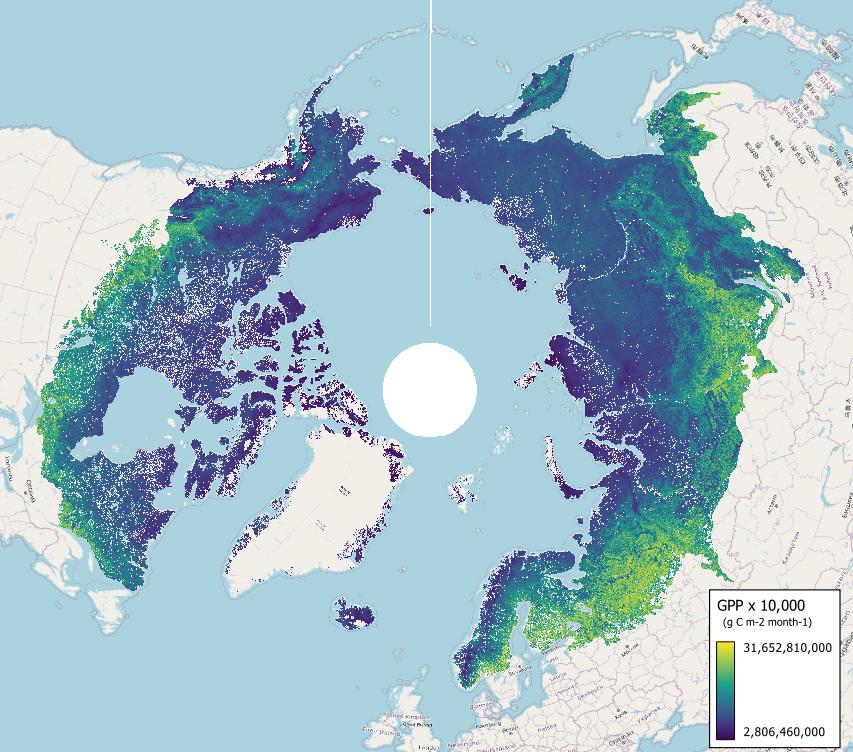
Figure 2. Time series of regional CO2 budgets across the Arctic-boreal and northern permafrost region.
Quality Assessment
The predictive performance of the final models was assessed using the (1) R2, (2) root mean square error (RMSE), 3) mean absolute error (MAE), and 4) mean bias error (MBE) between predicted and observed values using leave-one-site-out cross validation. The predictive performance of the models was good or high, with R2 ranging from 0.57 to 0.73 and RMSE from 19.4 to 37.3 g C m-2 month-1. However, the performance metrics also indicate that strong sinks and sources, and high GPP and Reco were underestimated. Other known issues include the limited number of flux observations (i.e. model training data) in Siberia and Canadian Arctic, and in disturbed areas impacted by fire, thermokarst and harvesting, and the lack of accurate geospatial predictors describing soil moisture). The uncertainty of predictions was evaluated by creating 20 bootstrapped model training datasets (with replacement; same sample size as in the original model training data) and using those to develop 20 individual models and predictions. Out of the 20 predictions, the standard deviation was calculated to represent prediction uncertainty. Similar to the predictive performance metrics, the uncertainty analysis also points towards highest uncertainties in areas with strong sinks, such as in northern Europe and southwestern Russia. However, when the uncertainty estimates were presented relative to the average flux, uncertainties were highest in tundra regions and parts of northern boreal Canada which generally have low in-situ flux data coverage. These 20 bootstrapped model runs were also used to calculate uncertainty around the regional budgets. Also, the flux data layers were compared with the Global Carbon Project atmospheric inversion ensemble and CMIP6 process model ensemble. Moderate correlation was observed between the upscaling and the inversion-based average annual NEE and temporal trends in annual NEE, providing confidence in our results.
Data Acquisition, Materials, and Methods
In-situ Data
Carbon dioxide flux measurements were utilized from the ABCflux dataset, which compiles terrestrial CO2 flux measurements from Arctic-boreal ecosystems (Virkkala et al., 2021b). These fluxes were cumulative values of net ecosystem exchange (NEE), gross primary production (GPP), and ecosystem respiration (Reco), aggregated at monthly scales across 4,897 site-months. The model training dataset included measurements from eddy covariance and chamber sites (n=200), with the majority coming from eddy covariance (88% of months). Each site had from one to 213 months of measurements; the average number of months per site was 25. Fourteen percent of sites had experienced disturbances such as fire, permafrost thaw, or forest harvesting, although this proportion might underestimate overall disturbance in the Arctic-boreal zone. A similar set of sites and upscaling methods were used in Watts et al. (2019) and Virkkala et al. (2021a). This study built upon those efforts by upscaling monthly fluxes for the entire year and extending the analysis through 2020.
Geospatial Data
The study used geospatial data as predictor variables for upscaling fluxes. Predictors used to model CO2 fluxes included MODIS-based land surface temperature, NDVI, and fractional vegetation cover, land cover, as well as permafrost occurrence, soil and topographic variables, TerraClimate-based solar radiation and vapor pressure deficit, ERA5 Land-based soil moisture, soil temperature and snow cover, and atmospheric CO2 concentration. The 500-m resolution fire data came from the Global Fire Emissions Database (GFED) product family (van Wees et al., 2022), which used MODIS-based products for burned area detection.
Machine Learning Modeling
Random forest models were applied to upscale GPP, Reco, and NEE across the Arctic-boreal region from 2001 to 2020 (e.g., Figure 3). Model tuning was performed using leave-one-site-out cross-validation, minimizing root mean square error (RMSE). Models were interpreted using partial dependence plots, and variable importance was determined through permutation-based methods. With the tuned models, fluxes were upscaled across the Arctic-boreal zone for land areas north of 49°N, covering 20.69 million km2. Temporal trends in the upscaled flux data were analyzed using the Theil-Sen slope and Mann-Kendall test, with trends summarized for key regions, biomes (tundra and boreal), and permafrost areas (Figure 3). Analysis codes are published in Virkkala et al. (2024a)
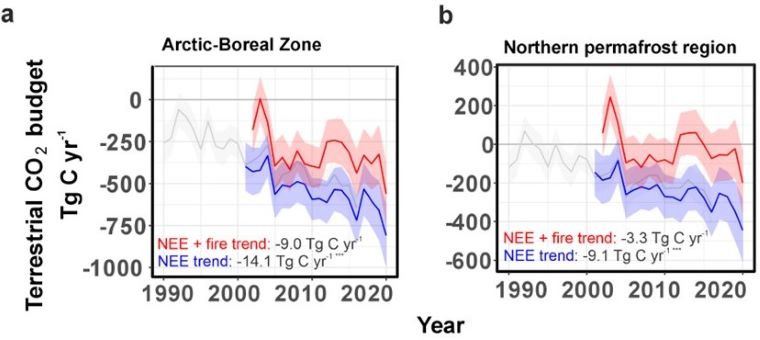
Figure 3. Upscaled estimates of gross primary productivity (GPP) for July 2001 over terrestrial portions of the Arctic-boreal region. Units are g C per m2 per month; values include a scale factor of 10,000. Source: GPP_2001.nc.
Additional details are available in Virkkala et al. (2024b).
Data Access
These data are available through the Oak Ridge National Laboratory (ORNL) Distributed Active Archive Center (DAAC).
Machine learning-based Arctic-boreal terrestrial ecosystem CO2 fluxes, 2001-2020
Contact for Data Center Access Information:
- E-mail: uso@daac.ornl.gov
- Telephone: +1 (865) 241-3952
References
Virkkala, A.-M., J. Aalto, B.M. Rogers, Torbern Tagesson, C.C. Treat, S.M. Natali, J.D. Watts, S. Potter, A. Lehtonen, M. Mauritz, E.A. G. Schuur, J. Kochendorfer, D. Zona, W. Oechel, H. Kobayashi, Elyn Humphreys, M. Goeckede, H. Iwata, P. Lafleur, E.S. Euskirchen, S. Bokhorst, M. Marushchak, P.J. Martikainen, B. Elberling, C. Voigt, C. Biasi, O. Sonnentag, Frans-Jan Parmentier, M. Ueyama, G. Celis, V.L. St.Loius, C.A. Emmerton, M. Peichl, Jinshu Chi, Järvi Järveoja, M.B. Nilsson, S.F. Oberbauer, M.S. Torn, Sang-Jong Park, H. Dolman, I. Mammarella, Namyi Chae, R. Poyatos, Efrén López-Blanco, T.R. Christensen, M.J. Kwon, and M. Luoto. 2021a. Predictions for "Statistical upscaling of ecosystem CO2 fluxes across the terrestrial tundra and boreal domain: regional patterns and uncertainties". Zenodo. https://doi.org/10.5281/zenodo.4521852
Virkkala, A-M., S. Natali, B.M. Rogers, J.D. Watts, K. Savage, S.J. Connon, M.E. Mauritz-tozer, E.A.G. Schuur, D.L. Peter, C. Minions, J. Nojeim, R. Commane, C.A. Emmerton, M. Goeckede, M. Helbig, D. Holl, H. Iwata, H. Kobayashi, P. Kolari, E. Lopez-blanco, M.E. Marushchak, M. Mastepanov, L. Merbold, M. Peichl, O. Sonnentag, T. Sachs, M. Ueyama, C. Voigt, M. Aurela, J. Boike, G. Celis, N. Chae, T. Christensen, S. Bret-Harte, S. Dengel, H. Dolman, C. Edgar, B. Elberling, S.E. Euskirchen, A. Grelle, J. Hatakka, E.R. Humphreys, J. Jaerveoja, A. Kotani, L. Kutzbach, T. Laurila, A. Lohila, I. Mammarella, Y. Matsuura, G. Meyer, M.B. Nilsson, S.F. Oberbauer, S.J. Park, F.J.W. Parmentier, R. Petrov, A.S. Prokushkin, S. Zyrianov, C. Schulze, V.L. St. Louis, E.S. Tuittila, J.P. Tuovinen, W. Quinton, A. Varlagin, D. Zona, and V.I. Zyryanov. 2021b. The ABCflux Database: Arctic-Boreal CO2 Flux and Site Environmental Data, 1989-2020. ORNL DAAC, Oak Ridge, Tennessee, USA. https://doi.org/10.3334/ORNLDAAC/1934
Virkkala, A.-M., B.M. Rogers, J.D. Watts, K.A. Arndt, S. Potter, I. Wargowsky, and S.M. Natali. 2024a. Code for "An increasing Arctic-boreal CO2 sink offset by wildfires and source regions". Zenodo. https://doi.org/10.5281/zenodo.13691585
Virkkala, A.-M., B.M. Rogers, J.D. Watts, K.A. Arndt, S. Potter, I. Wargowsky, E.A.G. Schuur, C. See, M. Mauritz, J. Boike, S.M. Bret-Harte, E.J. Burke, A. Burrell, N. Chae, A. Chatterjee, F. Chevallier, T.R. Christensen, R. Commane, H. Dolman, B. Elberling, C.A. Emmerton, E.S. Euskirchen, L. Feng, M. Goeckede, A. Grelle, M. Helbig, D. Holl, J. Järveoja, H. Kobayashi, L. Kutzbach, J. Liu, In. Liujkx, E. López-Blanco, K. Lunneberg, I. Mammarella, M.E. Marushchak, M. Mastepanov, Y. Matsuura, T. Maximov, L. Merbold, G. Meyer, M.B. Nilsson, Y. Niwa, W. Oechel, S.-J. Park, F.-J.W. Parmentier, M. Peichl, W. Peters, R. Petrov, W. Quinton, C. Rödenbeck, T. Sachs, C. Schulze, O. Sonnentag, V. St. Louis, E.-S. Tuittila, M. Ueyama, A. Varlagin, D. Zona, and S.M. Natali. 2024b. Wildfires offset the increasing but spatially heterogeneous Arctic-boreal CO2 uptake. Nature Climate Change (in review). Preprint at https://doi.org/10.1101/2024.02.09.579581
van Wees, D., G.R. van der Werf, J.T. Randerson, B.M. Rogers, Y. Chen, S. Veraverbeke, L. Giglio, and D.C. Morton. 2022. Global biomass burning fuel consumption and emissions at 500 m spatial resolution based on the Global Fire Emissions Database (GFED). Geoscientific Model Development 15:8411–8437. https://doi.org/10.5194/gmd-15-8411-2022
Watts, J.D., S. Natali, S. Potter, and B.M. Rogers. 2019. Gridded Winter Soil CO2 Flux Estimates for pan-Arctic and Boreal Regions, 2003-2100. ORNL DAAC, Oak Ridge, Tennessee, USA. https://doi.org/10.3334/ORNLDAAC/1683