Documentation Revision Date: 2021-12-14
Dataset Version: 1
Summary
Methane flux at hotspots was monitored using chambers constructed from plastic five-gallon (18.9-liter) buckets with bottoms removed and resealable air-tight lids were installed at hotspot flux monitoring locations. Non-hotspot fluxes were measured using permanent aluminum chamber-collars installed to 3–5 cm depth at long-term flux monitoring locations both near the hotspot and other locations of BTL. A large transparent chamber was used at all non-hotspot locations and was designed to enclose vegetation up to ~1.5 m in height. The data represent non-ebullitive (diffusive + potential plant-mediated) flux.
There is one data file in comma-separated (*.csv) format included in this dataset.
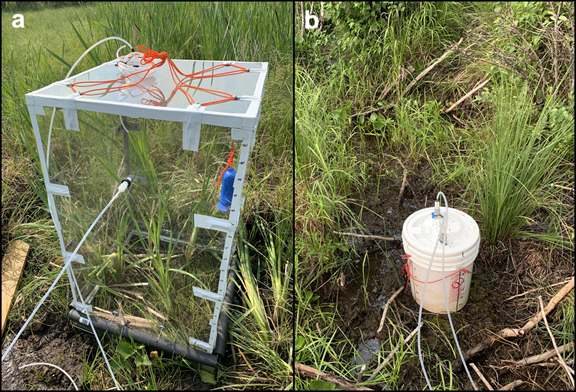
Figure 1. Chambers used to measure diffusive CH4 fluxes. a) Large chamber resting on the pre-installed aluminum collar, sealed on edges with pipe insulation. b) Five-gallon (18.9-liter) bucket with an open bottom and air-tight screw lid to measure hotspot flux locations.
Citation
Elder, C., N. Hasson, P. Hanke, S. Wright, K.W. Anthony, and C.E. Miller. 2021. Methane Fluxes from Shorelines and Differing Surfaces, Big Trail Lake, Alaska, 2019. ORNL DAAC, Oak Ridge, Tennessee, USA. https://doi.org/10.3334/ORNLDAAC/1870
Table of Contents
- Dataset Overview
- Data Characteristics
- Application and Derivation
- Quality Assessment
- Data Acquisition, Materials, and Methods
- Data Access
- References
Dataset Overview
This dataset provides methane fluxes from hot-spot and non-hot spot differing surfaces at Big Trail Lake (BTL) in the Goldstream Valley near Fairbanks, AK, USA. Measurements were taken at a remotely-sensed methane hotspot on the shoreline of a pond, adjacent to BTL with a Los Gatos Ultra-Portable Greenhouse Gas Analyzer (UGGA), and from various non-hotspot surfaces representative of the broader thermokarst lake ecosystem with bucket chambers. All data were collected between 2019-07-04 and 2019-12-04 during the daytime hours of 09:35–17:32 local time. A ground-based CH4 enhancement survey was performed on 2019-07-06 between 13:25–17:15 Alaska Daylight Time (AKDT), approximately two hours following an AVIRIS-NG overflight and hotspot detection at the Eastside Pond. Methane flux is reported in units of both mmol CH4 m-2 hr-1 and mg CH4 m-2 d-1. Flux errors are quantified for each.
Methane flux at hotspots was monitored using chambers constructed from plastic five-gallon (18.9-liter) buckets with bottoms removed and resealable air-tight lids were installed at hotspot flux monitoring locations. Non-hotspot fluxes were measured using permanent aluminum chamber-collars installed to 3–5 cm depth at long-term flux monitoring locations both near the hotspot and other locations of BTL. A large transparent chamber was used at all non-hotspot locations and was designed to enclose vegetation up to ~1.5 m in height. The data represent non-ebullitive (diffusive + potential plant-mediated) flux.
Project: Arctic-Boreal Vulnerability Experiment
The Arctic-Boreal Vulnerability Experiment (ABoVE) is a NASA Terrestrial Ecology Program field campaign being conducted in Alaska and western Canada, for 8 to 10 years, starting in 2015. Research for ABoVE links field-based, process-level studies with geospatial data products derived from airborne and satellite sensors, providing a foundation for improving the analysis, and modeling capabilities needed to understand and predict ecosystem responses to, and societal implications of, climate change in the Arctic and Boreal regions.
Related Publication
Elder, C.D., D.R. Thompson, A.K. Thorpe, H.A. Chandanpurkar, P.J. Hanke, N. Hasson, S.R. James, B.J. Minsley, N.J. Pastick, D. Olefeldt, K.M. Walter Anthony, and C.E. Miller. 2021. Characterizing methane emission hotspots from thawing permafrost. Global Biogeochemical Cycles, 35, e2020GB006922. https://doi.org/10.1029/2020GB006922
Related Dataset
Elder, C., P. Hanke, K.W. Anthony, D.R. Thompson, C.E. Miller, and A.K. Thorpe. 2020. ABoVE: Methane Flux across Two Thermokarst Lake Ecosystems, Interior Alaska, 2018. ORNL DAAC, Oak Ridge, Tennessee, USA. https://doi.org/10.3334/ORNLDAAC/1778
Acknowledgments
This work was funded by NASA’s Terrestrial Ecology Program via the Arctic Boreal Vulnerability Experiment (ABoVE) (grant 18-TE18- 0051).
Data Characteristics
Spatial Coverage: Big Trail Lake, Gold Stream Valley, interior Alaska
ABoVE Reference Locations
Domain: Core ABoVE
ABoVE grid tile (5 m): Ch040v032
Spatial Resolution: Chamber measurements have footprints <1 m2 and could be considered point data that cover a roughly 15 ha study area
Temporal Resolution: Fluxes were collected at various time points and were replicated within 2–3 weeks
Temporal Coverage: 2019-07-04 to 2019-12-14
Study Area: Latitude and longitude are given in decimal degrees.
| Site | Northernmost Latitude | Southernmost Latitude | Easternmost Longitude | Westernmost Longitude |
|---|---|---|---|---|
| Big Trail Lake, Goldstream Valley, interior Alaska | 64.92051 | 64.918594 | -147.81868 | -147.82454 |
Data File Information
There is one data file in comma-separated (*.csv) format included in this dataset.
Data File Details
Methane flux is the primary variable in units of both mmol CH4 m-2 hr-1 and mg CH4 m-2 d-1. Flux errors are quantified for each.
Table 1. Variable names and descriptions.
| Variable | Units | Description |
|---|---|---|
| plot_id | Plot IDs in which measurements were made using smaller bucket chambers start with either “Hotspot_...” or “HotspotBucket_, “ or “c36.1_...” (different teams used slightly different nomenclature). Plot IDs in which measurements were made with a larger transparent chamber, are designated as “Collar”, designed to enclose vegetation up to ~1.5 m in height. Plot Ids with “rep” in the name are measurements that were immediately replicated in time from the same “transect ID” location. | |
| transect_id | Identification of measurement stations. Measurements that have the same “transect_ID” represent replicated measurements taken at different times at the same location. | |
| latitude | decimal degrees | Latitude of measurement station |
| longitude | decimal degrees | Longitude of measurement station |
| date | YYYY-MM-DD | Date of measurement |
| time | HH:MM:SS | Time of measurement in HH:MM:SS in local time (Alaska Time) |
| mmol_ch4 | mmol CH4 m-2 hr-1 | Methane flux reported in mmol CH4 m-2 hr-1 |
| flux_error | mmol CH4 m-2 hr-1 | Flux error for methane reported in mmol CH4 m-2 hr-1 |
| mg_ch4 | mg CH4 m-2 d-1 | Methane flux reported in mg CH4 m-2 d-1 |
| flux_error_mg | mg CH4 m-2 d-1 | Flux error for methane reported in mg CH4 m-2 d-1 |
| wet_dry | A qualitative assessment of soil saturation. “wet” is typically defined as fully saturated where “dry” may indicate anything less than fully saturated | |
| surface_1 | Qualitative assessment of the most prominent surface type within the chamber footprint. All measurements made in the CH4-enhanced area identified by AVIRIS-NG have “surface_1” classified as “hotspot.” The general classification of “wet sediment” mostly describes water-saturated mud and lake sediments in the wet shorelines of Big Trail Lake and surrounding wetlands | |
| surface_2 | Qualitative assessment of the next 2nd most prominent surface | |
| surface_3 | Qualitative assessment of the 3rd most prominent surface. If a third surface type was not present (< roughly 10% of measurement footprint) “nan” was used |
Application and Derivation
The hotspot flux data can be used to quantify typical emissions from AVIRIS-NG-detected CH4 hotspots. CH4 fluxes from other various surfaces are useful for upscaling CH4 emissions across boreal landscapes.
Quality Assessment
Uncertainty in the individual flux calculations was determined by propagating our best estimate of chamber volume error and the square root of the residuals to the linear fit of raw data through the ideal gas law calculation. Any flux solutions that required smoothing maintained the error associated with the linear fit through the original 1 Hz resolution data.
Data Acquisition, Materials, and Methods
The study site was the Big Trail Lake (BTL), in the Goldstream Creek valley, near Fairbanks. A ground-based CH4 enhancement survey was performed on July 6, 2019, between 13:25–17:15 Alaska Daylight Time (AKDT), approximately two hours following an AVIRIS-NG overflight and hotspot detection at the Eastside Pond. During the ground-based enhancement survey, atmospheric CH4 concentrations were measured on foot at 1 Hz with a Los Gatos Ultra-Portable Greenhouse Gas Analyzer (UGGA) (ABB INC., 85 Quebec City, CA). Measurements were made at approximately 0.5 m AGL while walking along a ~10 cm s-1 snaking transect starting in the southwest and working northeast of the hotspot region. The inlet to the UGGA was fitted to the lid of a 18.9 L bucket with the bottom removed to minimize interference from non-local sources and held at arm’s length in front of the surveyor. Wooden planks, which were placed at least one hour before measurement, were used as footpaths in sensitive environments to minimize disturbance.
While these enhancement survey data are not part of this dataset, they were important in determining the hotspot vs. non-hotspot locations for the monitoring data included herein.
Methane Flux Monitoring at Hotspots
Hotspot flux monitoring measurements at the Eastside Pond CH4 hotspot were implemented in July 2019 to further validate airborne detections. Hotspot monitoring chambers, constructed from plastic 18.9 L buckets with bottoms removed and resealable air-tight lids (Gamma Seal Lid, Encore Plastics, Sandusky, OH, USA) (Fig. 1), were installed at hotspot flux monitoring locations.
All diffusive fluxes, including non-hotspot measurements (described below), were calculated from the ideal gas law using chamber volume, temperature, atmospheric pressure measured via a LI-COR LI7700 (LI-COR Inc., Lincoln, Nebraska, USA) operating in the middle of the study area. The slope of linear CH4 concentration change (R2 > 0.985 correlation to linear least-squares fit) for a minimum of 45 seconds (45 observations) and a maximum of 210 seconds (45 < n > 210) was used to determine the mass change within the chambers. Chamber observation periods were ≤5 minutes and observations within the first 3.5 minutes of chamber placement were prioritized. Any observations with non-linear concentration change (R2 of linear fit < 0.985), no linear sections ≥45 seconds, or with stepwise concentration increases (interpreted as ebullition) were omitted to ensure that the reported measurements represent purely diffusive fluxes. These strict protocols eliminated any disturbance caused by placing the chamber, which we assumed would manifest as a non-linear CH4 concentration change.
Bucket chambers were installed such that 2–5 cm of the open bottom was submerged in saturated sediments to create a hermetic seal. These hotspot monitoring positions (n=12) were equally spaced 3–4 m apart on sparsely vegetated or bare, saturated surfaces along the southeastern shoreline of the Eastside Pond where the water table was nearest to the surface, or where we expected the highest diffusive fluxes. Buckets were left in place, sans lid, for at least 24 hours before fluxes were measured and remained in place until removal just before seasonal freeze up. During all flux measurements, lids fitted with 0.635 cm diameter plastic valves were gently screwed into the top of each bucket, creating an air-tight closed chamber to recirculate air through the UGGA. Lids were removed after each measurement.
All hotspot fluxes reported here were measured on 5 days in between 2019-07-07 and 2019-09-17, and on 2019-12-14, resulting in 66 total observations from the Eastside Pond hotspot region. Hotspot fluxes were not measured at night; therefore, the daytime measurements were assumed to capture the diurnal variability of CH4 hotspot emissions. All fluxes were measured between the hours of 09:35 to 17:32 local time. Plant-mediated CH4 emission potentially contributed to total observed flux in cases where buckets included sparse emergent vegetation and flux was linear. A singular bucket was placed on the snow surface at the hotspot location to observe fluxes on 2019-12-14. The chamber volume was corrected for snow density inside the chamber for this measurement.
Methane Flux Monitoring at Non-Hotspot Locations
Non-hotspot CH4 fluxes were monitored from various surfaces at BTL via repeat chamber-flux measurements along five shore-to-forest transects since summer 2018 (Elder et al., 2020). Fluxes were also measured starting in July 2019, except that instead of placing chambers directly on the surface, permanent aluminum chamber-collars were installed to 3–5 cm depth at long-term flux monitoring locations both near the hotspot and other locations of BTL. Aluminum collars were in place for a minimum of one week before flux measurements were made. A removable flotation system constructed of pipe insulation was attached to the chamber for measurements over open water. A larger transparent chamber was used at all non-hotspot locations and was designed to enclose vegetation up to ~1.5 m in height. Therefore, like the hotspot monitoring, these observations also included potential plant-mediated fluxes when vegetation was present in the chamber and fluxes were linear. Thus, fluxes reported herein should be considered as inclusive of linear plant-mediated emission and exclusive of ebullitive emissions. Since ebullition was not determined from any of our chamber observations, our flux estimates are conservative with respect to total flux.
Refer to Elder et al. (2021) for details.
Data Access
These data are available through the Oak Ridge National Laboratory (ORNL) Distributed Active Archive Center (DAAC).
Methane Fluxes from Shorelines and Differing Surfaces, Big Trail Lake, Alaska, 2019
Contact for Data Center Access Information:
- E-mail: uso@daac.ornl.gov
- Telephone: +1 (865) 241-3952
References
Elder, C.D., D.R. Thompson, A.K. Thorpe, H.A. Chandanpurkar, P.J. Hanke, N. Hasson, S.R. James, B.J. Minsley, N.J. Pastick, D. Olefeldt, K.M. Walter Anthony, and C.E. Miller. 2021. Characterizing methane emission hotspots from thawing permafrost. Global Biogeochemical Cycles, 35, e2020GB006922. https://doi.org/10.1029/2020GB006922
Elder, C., P. Hanke, K.W. Anthony, D.R. Thompson, C.E. Miller, and A.K. Thorpe. 2020. ABoVE: Methane Flux across Two Thermokarst Lake Ecosystems, Interior Alaska, 2018. ORNL DAAC, Oak Ridge, Tennessee, USA. https://doi.org/10.3334/ORNLDAAC/1778