Documentation Revision Date: 2020-06-26
Dataset Version: 1
Summary
There is one data file in comma-separated format (.csv) included with this dataset.

Figure 1. Photo of the custom-built chamber for measuring in situ trace gas fluxes from soil/vegetation and water surfaces (with flotation). The chamber (0.71 m x 0.71 m x 1.07 m = 0.533 m3) provides adequate height to enclose emergent grasses and reeds. The chamber is connected by tubing to a Los Gatos Ultra-Portable Greenhouse Gas Analyzer capable of measuring trace gasses at 1 Hz in recirculating air. Photo courtesy C. Elder.
Citation
Elder, C., P. Hanke, K.W. Anthony, D.R. Thompson, C.E. Miller, and A.K. Thorpe. 2020. ABoVE: Methane Flux across Two Thermokarst Lake Ecosystems, Interior Alaska, 2018. ORNL DAAC, Oak Ridge, Tennessee, USA. https://doi.org/10.3334/ORNLDAAC/1778
Table of Contents
- Dataset Overview
- Data Characteristics
- Application and Derivation
- Quality Assessment
- Data Acquisition, Materials, and Methods
- Data Access
- References
Dataset Overview
This dataset provides diffusive methane (CH4) fluxes collected from two thermokarst lakes in the Goldstream Valley, north of Fairbanks in interior Alaska. Fluxes were collected from the littoral zones, adjacent shoreline, and upland vegetation. The data were collected during July 2018. Measurements were made using a mobile, closed chamber technique where chamber air was recirculated through a Los Gatos Research (LGR) Ultraportable Cavity Ring-down Spectrometer. The chamber was large enough to enclose emergent and upland vegetation up to 1.5 m in height, allowing plant-facilitated fluxes to be measured. These in situ measurements were used to verify spatial patterns in methane flux (i.e., exponential decay with distance from water) detected by NASA's Next Generation Airborne Visible/Infrared Imaging Spectrometer (AVIRIS-NG).
Project: Arctic-Boreal Vulnerability Experiment
The Arctic-Boreal Vulnerability Experiment (ABoVE) is a NASA Terrestrial Ecology Program field campaign based in Alaska and western Canada between 2016 and 2021. Research for ABoVE links field-based, process-level studies with geospatial data products derived from airborne and satellite sensors, providing a foundation for improving the analysis and modeling capabilities needed to understand and predict ecosystem responses and societal implications.
Related Publication:
Elder, C.D., D.R. Thompson, A.K. Thorpe, P.Hanks, K.M.W. Anthony, and C.E. Miller. 2020. Airborne Mapping Reveals Emergent Power Law of Arctic Methane Emissions. Geophysical Research Letters, Vol 47, 3. https://doi.org/10.1029/2019GL085707
Related Dataset:
Miller, C.E., R.O. Green, D.R. Thompson, A.K. Thorpe, M. Eastwood, I.B. Mccubbin, W. Olson-duvall, M. Bernas, C.M. Sarture, S. Nolte, L.M. Rios, M.A. Hernandez, B.D. Bue, and S.R. Lundeen. 2019. ABoVE: Hyperspectral Imagery from AVIRIS-NG, Alaskan and Canadian Arctic, 2017-2018. ORNL DAAC, Oak Ridge, Tennessee, USA. https://doi.org/10.3334/ORNLDAAC/1569
Acknowledgments: This research was performed with support from NASA ABoVE under NASA Terrestrial Ecology Program "Imaging Arctic Methane Plumes".
Data Characteristics
Spatial Coverage: Goldstream Valley, north of Fairbanks, Alaska
ABoVE Reference Locations
Domain: Core ABoVE
State/Territory: Alaska
Grid cells: Ah01Av00.Bh06Bv05.Ch040Cv32
Spatial Resolution: Multiple areas at each lake. Measurements were made every 3-5 meters across the littoral zone and along transects extending radially from the shorelines (see Figure 2).
Temporal Coverage: 2018-07-17 to 2018-07-29
Temporal Resolution: One-time measurements
Study Areas (All latitude and longitude given in decimal degrees)
| Site | Westernmost Longitude | Easternmost Longitude | Northernmost Latitude | Southernmost Latitude |
|---|---|---|---|---|
| Goldstream Valley | -147.850236 | -147.81864 | 64.92071 | 64.91509 |
Data file information
There is one data file in comma-separated format (.csv) included with this dataset.
Table 1. Variables in CH4_Flux_BigTrail_Goldstream_AK.csv.
| Variable | Units | Description |
|---|---|---|
| plot_id | Plot ID number | |
| lake_id | BTL = Big Trail Lake or GSL = Goldstream Lake | |
| latitude | decimal degrees | Latitude |
| longitude | decimal degrees | Longitude |
| date | YYYY-MM-DD | Sampling date |
| methane | mmol CH4 m-2 hr-1 | Methane flux: mmol methane/m2/hr |
| flux_error | mmol CH4 m-2 hr-1 | Methane flux error: mmol methane/m2/hr. See Section 4 for details. |
| distance_from_water | m | Distance from open water to where the measurement was made. “0s” refer to fluxes that were measured over open water surfaces. Other distances from water indicate measurements of vegetation adjacent to a lake and on transects extending radially away from a lake. |
| distance_error | m | The uncertainty on the accuracy of the GPS system used to measure the distance from open water. |
Application and Derivation
These data could be useful to climate change studies. They were collected to verify spatial patterns in methane flux (i.e., exponential decay with distance from water) detected by NASA's Next Generation Airborne Visible/Infrared Imaging Spectrometer (AVIRIS-NG).
Quality Assessment
Uncertainty in the methane flux data was determined by error propagation which included the LGR gas analyzer, the volume of the chamber and connective tubing, the temperature of the LGR gas temperature sensor, the pressure sensor on the Li-Cor LI7700 methane analyzer, and the linear fitting to the raw data.
A test for extraneous CH4 contributions from the closed chamber system resulted in no significant change in CH4 concentration after 10 minutes of recirculation on a bare, dry concrete surface. Thus, extraneous CH4 contributions were ruled out as a potential source of error in our calculations.
Where distances were not measured with a measuring tape (practically zero error), the distance to water was determined with GPS, in which the uncertainty on the accuracy of the GPS system was used.
Data Acquisition, Materials, and Methods
Diffusive methane fluxes were collected from the littoral zones and adjacent shoreline and upland vegetation of two thermokarst lakes—Goldstream Lake (GSL) and Big Trail Lake (BTL)—in the Goldstream Valley, north of Fairbanks, AK. The data were collected during July 2018 to verify spatial patterns in methane flux (i.e., exponential decay with distance from water) detected by NASA's Next Generation Airborne Visible/Infrared Imaging Spectrometer (AVIRIS-NG).
Following is a brief synopsis of flux measurements and processing as provided in Elder et al., 2020.
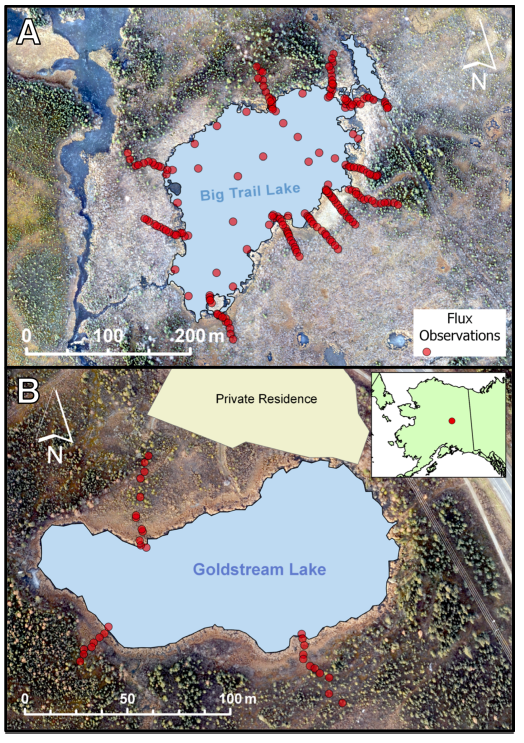
Figure 2. Locations of individual CH4 chamber flux observations. (a) Big Trail Lake and (b) Goldstream Lake both occur in the Goldstream Valley near Fairbanks, AK. Inset (b) shows the location of the two study-lakes in relation to the state of Alaska. Source: Elder et al., 2020.
In Situ Flux Measurements
On each lake, a Los Gatos Ultra-Portable Greenhouse Gas Analyzer (UGGA) (ABB INC., Quebec City, CA) measured the concentrations of CH4, CO2, and water vapor at 1 Hz in air that was recirculated through a custom-built, transparent, closed chamber and approximately 30’ of 1/4” OD connective Teflon tubing.
The design also incorporated a convertible flotation ring to account for the full spectrum of surface inundation ranging from open water to well-drained upland surfaces.
- In open water and saturated zones, the chamber was deployed with the flotation ring such that 4 cm of the chamber was submerged. The resulting volume change was accounted for in all flux calculations.
- In the sensitive littoral zone sediments, disturbance was minimized or eliminated by operating the chamber from a boom and pulley system constructed on the bow of an 11’ aluminum boat. This allowed the operator to gently place the chamber without standing near the observation area.
- Ground-based CH4 fluxes were measured every 3 to 5 m along 60 m transects extending radially from the shoreline at each lake (BTL n = 11 transects, GSL n = 3 transects).
- Chamber dimensions (0.71 m x 0.71 m x 1.07 m = 0.533 m3) provided a 0.5 m2 footprint and ample height to enclose emergent grasses and reeds, up to ~1.5 m in height, that grow in the littoral zone of most northern lakes incorporating any potential CH4 flux through their aerenchymous tissues; thus, plant-facilitated fluxes are included in these measurements (Elder et al., 2020).
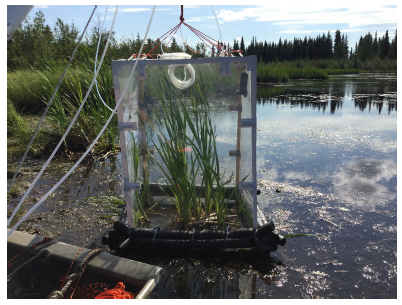
Figure 3. Portable Flux Chamber. Chamber is placed with boom/pulley system over waterlogged sediments and several Typha latifolia individuals at the shore of Big Trail Lake. Source: Elder et al., 2020.
Flux Data Processing
Processing of raw UGGA data was carried out in Excel, Matlab, and Python.
- Chamber CH4 measurements that did not maintain linear CH4 concentration increases for at least 45 consecutive measurements (45 seconds), following a least squares fit with a minimum correlation threshold of R2 > 0.985, were rejected for flux calculation. This resulted in the rejection of approximately 20% of the chamber data (rejected at n = 48). Flux data are provided for 200 measurements.
- Although not explicitly characterized, ebullition was occasionally observed and manifested as stepwise increases in raw chamber CH4 concentration data. Given the high spatiotemporal variability of ebullition, and intent to characterize general patterns in flux, observations affected by ebullition were excluded.
- Thus in situ fluxes reported herein only represent combined diffusion and/or plant-mediated flux. As a result, the chamber-based fluxes likely underestimate total CH4 emissions.
- In cases of low flux, raw gas analyzer noise was smoothed with a rolling mean of up to 15 s to improve the linear correlation with time. In this case, the minimum number of consecutive observations considered for an acceptable flux calculation was increased to 80 s instead of 45 s.
- Flux errors were propagated from estimated chamber volume error; CH4 concentration, ambient temperature, and pressure analytical errors; and the error associated with the least squares fit of raw CH4 concentration data. In cases where CH4 data were smoothed, the uncertainty on the linear fit was derived from the unsmoothed data as a conservative measure.
Data Access
These data are available through the Oak Ridge National Laboratory (ORNL) Distributed Active Archive Center (DAAC).
ABoVE: Methane Flux across Two Thermokarst Lake Ecosystems, Interior Alaska, 2018
Contact for Data Center Access Information:
- E-mail: uso@daac.ornl.gov
- Telephone: +1 (865) 241-3952
References
Elder, C.D., D.R. Thompson, A.K. Thorpe, P.Hanks, K.M.W. Anthony, and C.E. Miller. 2020. Airborne Mapping Reveals Emergent Power Law of Arctic Methane Emissions. Geophysical Research Letters, Vol 47, 3. https://doi.org/10.1029/2019GL085707