Documentation Revision Date: 2022-06-22
Dataset Version: 1
Summary
There are 38 data files in cloud-optimized GeoTIFF (*.tiff) format included in this dataset.
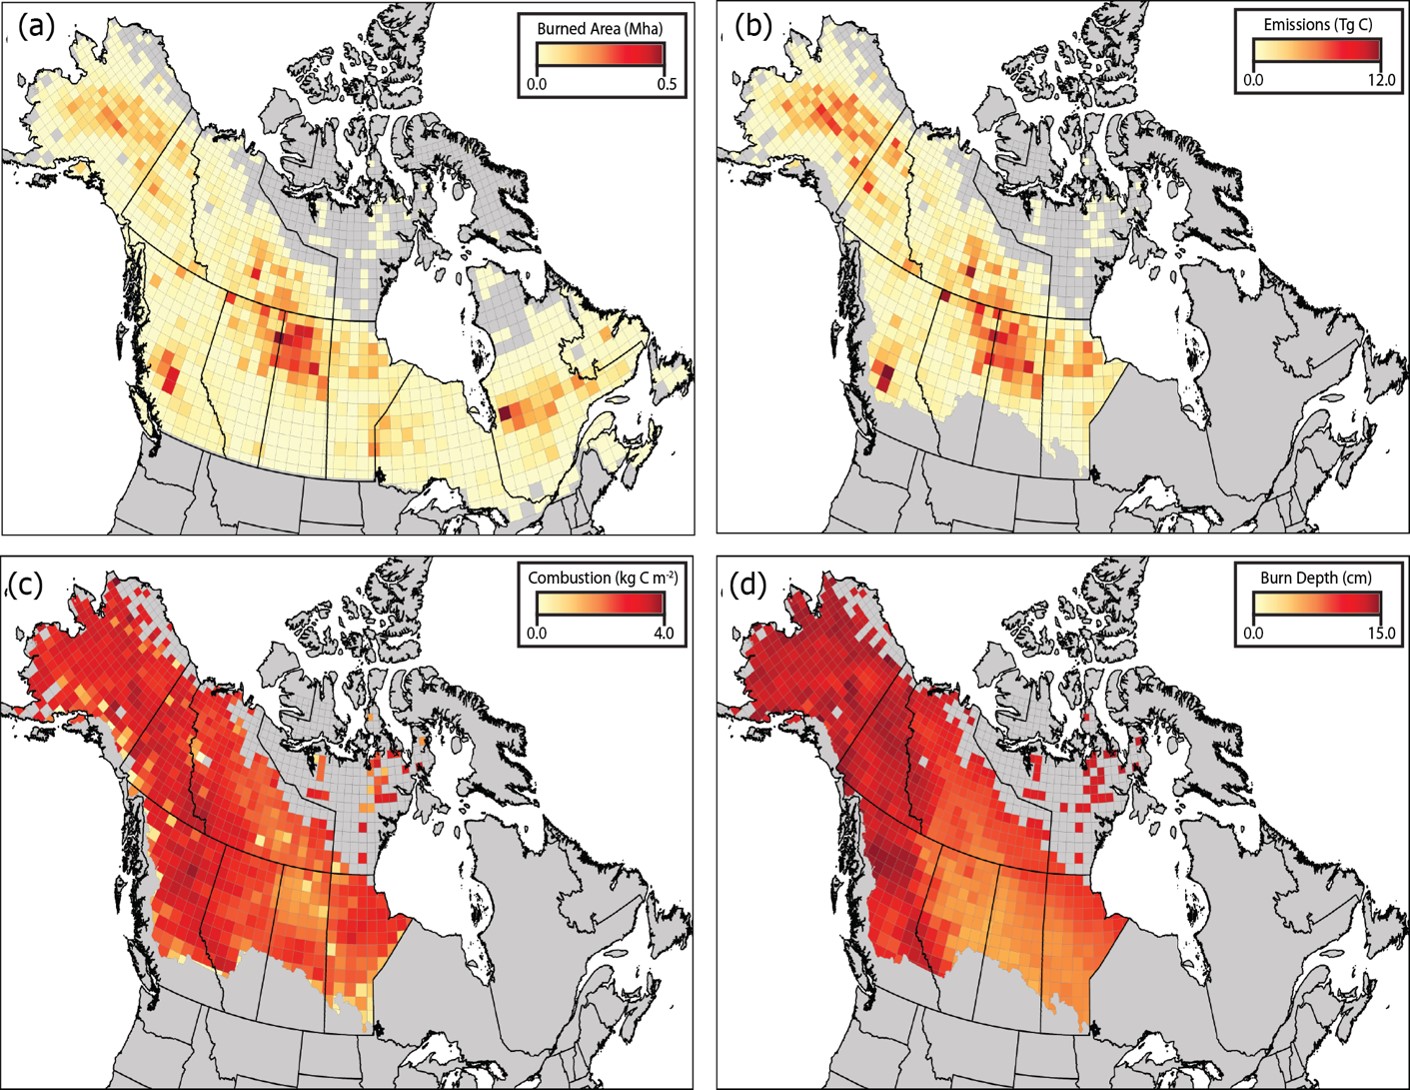
Figure 1. Total burned area (a), total carbon emissions (b), mean combustion (c), and mean burn depth (d) between 2001-2019 aggregated to a 70 km grid. Note that burned area (a) covers all of Alaska and Canada whereas all other metrics cover the ABoVE extended domain.
Citation
Potter, S., S. Veraverbeke, X.J. Walker, M.C. Mack, S.J. Goetz, J.L. Baltzer, C. Dieleman, N.H.F. French, E.S. Kane, M.R. Turetsky, E.B. Wiggins, and B.M. Rogers. 2022. ABoVE: Burned Area, Depth, and Combustion for Alaska and Canada, 2001-2019. ORNL DAAC, Oak Ridge, Tennessee, USA. https://doi.org/10.3334/ORNLDAAC/2063
Table of Contents
- Dataset Overview
- Data Characteristics
- Application and Derivation
- Quality Assessment
- Data Acquisition, Materials, and Methods
- Data Access
- References
Dataset Overview
This dataset provides annual gridded estimates of fire locations and associated burn fraction per pixel for Alaska and Canada at approximately 500 m spatial resolution for the period 2001–2019. Gridded predictions of carbon combustion and burn depth for the same period within the ABoVE extended domain using the burn area maps and field data are also available. Fire locations and date of burn (DOB) were detected by MODIS-derived active fire products. Burned area was primarily estimated from finer-scale Landsat imagery using a differenced Normalized Burn Ratio (dNBR) algorithm and upscaled to an approximate 500 m MODIS resolution. Aboveground combustion, belowground combustion, and burn depth were statistically modeled at the pixel level for every mapped burned pixel in the ABoVE extended domain based on field observations across Alaska and western Canada. Predictor variables included remotely sensed indicators of fire severity, topography, soils, climate, and fire weather. Quality flags for burned area and combustion are available. Fire is the dominant disturbance agent in Alaskan and Canadian boreal ecosystems and releases large amounts of carbon into the atmosphere. These data are useful for studies of disturbance, fire ecology, and carbon cycling in boreal ecosystems.
Project: Arctic-Boreal Vulnerability Experiment
The Arctic-Boreal Vulnerability Experiment (ABoVE) is a NASA Terrestrial Ecology Program field campaign being conducted in Alaska and western Canada, for 8 to 10 years, starting in 2015. Research for ABoVE links field-based, process-level studies with geospatial data products derived from airborne and satellite sensors, providing a foundation for improving the analysis, and modeling capabilities needed to understand and predict ecosystem responses to, and societal implications of, climate change in the Arctic and Boreal regions.
Related Publication
Potter, S., S. Cooperdock, S. Veraverbeke, X. Walker, M.C. Mack, S.J. Goetz, J. Baltzer, L. Bourgeau-Chavez, A. Burrell, C. Dieleman, N. French, S. Hantson, E.E. Hoy, L. Jenkins, J.F. Johnstone, E.S. Kane, S.M. Natali, J.T. Randerson, M.R. Turetsky, E. Whitman, E. Wiggins, and B.M. Rogers. Burned area and carbon emissions across northwestern boreal North America from 2001-2019. 2022, in process.
Related Datasets
Walker, X.J., J.L. Baltzer, L.L. Bourgeau-Chavez, N.J. Day, W.J. De groot, C. Dieleman, E.E. Hoy, J.F. Johnstone, E.S. Kane, M.A. Parisien, S. Potter, B.M. Rogers, M.R. Turetsky, S. Veraverbeke, E. Whitman, and M.C. Mack. 2019. ABoVE: Synthesis of Burned and Unburned Forest Site Data, AK and Canada, 1983-2016. ORNL DAAC, Oak Ridge, Tennessee, USA. https://doi.org/10.3334/ORNLDAAC/1744
- This dataset provided field data employed to develop statistical models for estimating burn depth and combustion.
Acknowledgments
This project received support from NASA's ABoVE program (grant NX15AT71A).
Data Characteristics
Spatial Coverage: Alaska and Canada
ABoVE Reference Locations
Domain: Core and Extended
Grid Cells: Ah000v000, Ah000v001, Ah001v000, Ah001v001, Ah002v000, Ah002v001, Ah002v002, Ah003v000, Ah003v001, Ah003v002, Ah004v000, Ah004v001, Ah004v002, Ah005v001, Ah005v002
Spatial Resolution: 463 m
Temporal Coverage: 2001 to 2019
Temporal Resolution: Annual
Study Area: All latitudes and longitudes given in decimal degrees
| Site | Westernmost Longitude | Easternmost Longitude | Northernmost Latitude | Southernmost Latitude |
|---|---|---|---|---|
| Alaska and Canada | -167.9591 | -48.7792 | 72.9491 | 42.8850 |
User Note: The table above specifies the bounding box for usable data. The no-data cells in the GeoTIFFs extend beyond these coordinates.
Data File Information
There are 38 data files in cloud-optimized GeoTIFF (*.tif) format included in this dataset. The files are named burned_area_YYYY.tif and combustion_depth_YYYY.tif, where YYYY indicates the year from 2001 to 2019.
Data File Details
The multi-band GeoTIFFs have these characteristics:
- File raster bands are described in Table 1
- Projection: MODIS Sinusoidal grid (SR-ORG:6842); Proj4 string: "+proj=sinu +lon_0=0 +x_0=0 +y_0=0 +a=6371007.181 +b=6371007.181 +units=m +no_defs"
- Spatial Resolution: 463 m x 463 m
- Data type: Float32
- No data value = -9999
Table 1. Variables names and descriptions in the GeoTIFF files.
| File Name | Band | Variable | Units | Description |
|---|---|---|---|---|
| burned_area_YYYY.tif | 1 | area fraction burned | 1 | Proportion of pixel area burned (0.0–1.0) |
| 2 | day of year | d | Day of burning (DOB) - earliest active fire detection during the year (1 to 365) | |
| 3 | quality flag | 1 | Quality flag using 5 bits (values 0 to 27, see Table 2) | |
| combustion_depth_YYYY.tif | 1 | aboveground combustion | kg | Aboveground combustion in kg carbon |
| 2 | belowground combustion | kg | Belowground combustion in kg carbon | |
| 3 | total combustion | kg | Aboveground + belowground (Band 1 + Band 2) combustion in kg carbon | |
| 4 | depth of burn | cm | Depth of burn from surface | |
| 5 | uncertainty in total combustion | kg | Uncertainty in total combustion (Band 3) in kg carbon | |
| 6 | quality flag | 1 | Quality flag (values 1–4, see Table 3) |
Table 2. Quality flags for files named burned_area_YYYY.tif.
| Bits * | Value | Description |
|---|---|---|
| 00000 | 0 | Full Landsat classification, day of burn (DOB) from thermal anomalies, 100% burned |
| 00001 | 1 | Partial Landsat classification, DOB from thermal anomalies, 100% burned |
| 00010 | 2 | MODIS yearly classification, DOB from thermal anomalies, 100% burned |
| 00011 | 3 | MODIS seasonal classification, DOB from thermal anomalies, 100% burned |
| 00100 | 4 | Full Landsat classification, DOB krigged from thermal anomalies, 100% burned |
| 00101 | 5 | Partial Landsat classification, DOB krigged from thermal anomalies, 100% burned |
| 00110 | 6 | MODIS yearly classification, DOB krigged from thermal anomalies, 100% burned |
| 00111 | 7 | MODIS seasonal classification, DOB krigged from thermal anomalies, 100% burned |
| 01000 | 8 | Full Landsat classification, DOB from seasonal product, 100% burned |
| 01001 | 9 | Partial Landsat classification, DOB from seasonal product, 100% burned |
| 01010 | 10 | MODIS yearly classification, DOB from seasonal product, 100% burned |
| 01011 | 11 | MODIS seasonal classification, DOB from seasonal product, 100% burned |
| 10000 | 16 | Full Landsat classification, DOB from thermal anomalies, <100% burned and/or <100% imagery |
| 10001 | 17 | Partial Landsat classification, DOB from thermal anomalies, <100% burned and/or <100% imagery |
| 10010 | 18 | MODIS yearly classification, DOB from thermal anomalies, <100% burned and/or <100% imagery |
| 10011 | 19 | MODIS seasonal classification, DOB from thermal anomalies, <100% burned and/or <100% imagery |
| 10100 | 20 | Full Landsat classification, DOB krigged from thermal anomalies, <100% burned and/or <100% imagery |
| 10101 | 21 | Partial Landsat classification, DOB krigged from thermal anomalies, <100% burned and/or <100% imagery |
| 10110 | 22 | MODIS yearly classification, DOB krigged from thermal anomalies, <100% burned and/or <100% imagery |
| 10111 | 23 | MODIS seasonal classification, DOB krigged from thermal anomalies, <100% burned and/or <100% imagery |
| 11000 | 24 | Full Landsat classification, DOB from seasonal product, <100% burned and/or <100% imagery |
| 11001 | 25 | Partial Landsat classification, DOB from seasonal product, <100% burned and/or <100% imagery |
| 11010 | 26 | MODIS yearly classification, DOB from seasonal product, <100% burned and/or <100% imagery |
| 11011 | 27 | MODIS seasonal classification, DOB from seasonal product, <100% burned and/or <100% imagery |
| * Two sets of flags are encoded in five bits. Bits 1–2: 0 = Landsat source, all images available. 1 = Landsat source, available images cover >15% but <100% of pixel. 2 = MODIS yearly source used. 3 = MODIS seasonal source uses. Bits 3–5: 0 = Estimated from thermal anomalies from the earliest day detected. 1 = Kriged from thermal anomalies within fire polygon. 2 = Taken from seasonal MODIS source, used maximum dNBR value for the year. |
||
Table 3. Quality flags for files named combustion_depth_YYYY.tif.
| Value | Percent of Pixels | Description |
|---|---|---|
| 1 | 95.32 | Primary model with ideal MODIS data. (Used fire weather indices as predictors (primary model) with good quality MODIS data.) |
| 2 | 0.26 | Primary model without ideal MODIS data. (Used fire weather indices as predictors (primary model) but quality MODIS data was lacking.) |
| 3 | 4.37 | Secondary model with ideal MODIS data. (Good quality MODIS data used; fire weather indices not used.) |
| 4 | 0.05 | Secondary model without ideal MODIS data. (Good quality MODIS data lacking, and fire weather indices not used.) |
Application and Derivation
These data are useful for studies of disturbance, fire ecology, and carbon cycling in boreal ecosystems.
Quality Assessment
Uncertainty for the total combustion product was analyzed with a Monte Carlo analysis which incorporates uncertainty in field observations used to create the statistical model. See Potter et al. (2022) for details of this analysis.
Data Acquisition, Materials, and Methods
Fire is the dominant disturbance agent in Alaskan and Canadian boreal ecosystems and releases large amounts of carbon into the atmosphere. Therefore, it is critically important to track the spatiotemporal changes in burned area and fire carbon emissions over time. These data were generated with a new burned area detection algorithm. Burned areas were mapped for 2001–2019 across Alaska and Canada (Fig. 1 and 2) at a 500 m scale using finer-scale 30 m imagery to account for unburned vegetation patches and water bodies. This algorithm balances omission and commission errors to derive accurate landscape- and regional-scale burned area estimates.
Carbon combustion and burn depth were predicted for the same period within the ABoVE extended domain using the burn area maps and field data. Statistical models were constrained using a large database of combustion observations for ABoVE (Walker et al., 2019) and were related to a variety of response variables including remotely sensed indicators of fire severity, fire weather indices, local climate, soils, and topographic indicators.
Fire Detection
Fire locations and date of burn (DOB) were detected by thermal anomalies in MOD13A1 006 (Didan et al., 2015a) and MYD13A1 006 (Didan et al., 2015b) active fire products. Other data, such as National Large Fire Databases (NLFD), provided supplemental vector information for known fires. Where an active fire was registered, DOB was assigned by taking the earliest active fire detection during the year. When an active fire was not registered for a given burned pixel, a multi-tiered approach was used to assign the day of burn. When possible, a kriging technique to interpolate the DOB using the thermal hits within each NLFD fire polygon was employed following Veraverbeke et al. (2014). The MODIS seasonal product was used when there were no active fires detected based MCD64A1 Collection 6. See quality flags listed in Table 2, bits 3–5, flag 0 marks pixels with direct active fire hits, flag 1 indicates pixels whose day of burn was determined by kriging interpolation, and flag 2 denotes pixels whose DOB was determined using the MODIS seasonal burned area product.
Burned Area
The proportion of each 500 m MODIS pixel that burned was estimated from satellite imagery. The primary approach used Landsat imagery to separate burned from unburned pixels at 30 m employing the differenced Normalized Burn Ratio (dNBR) algorithm (Hudak et al., 2007). The Landsat-based product was upscaled to approximately 500 m MODIS resolution. This approach had the added advantage of accuracy by minimizing the effects of non-fire disturbances that may confound the Landsat dNBR metric. A mask was created to remove non-vegetated pixels from analysis, and the effects of non-fire disturbances were minimized by following the approach of Veraverbeke et al. (2015). This technique for measuring the proportion of area burned was used when the 500 m grid cells had 100% coverage by Landsat imagery. An internal assessment revealed that it was also effective when Landsat coverage was ≥15%, but MODIS cells with <100% Landsat coverage were flagged. When Landsat coverage was <15%, MODIS imagery was used to classify burn status. See quality flags described in Tables 2 and 3.
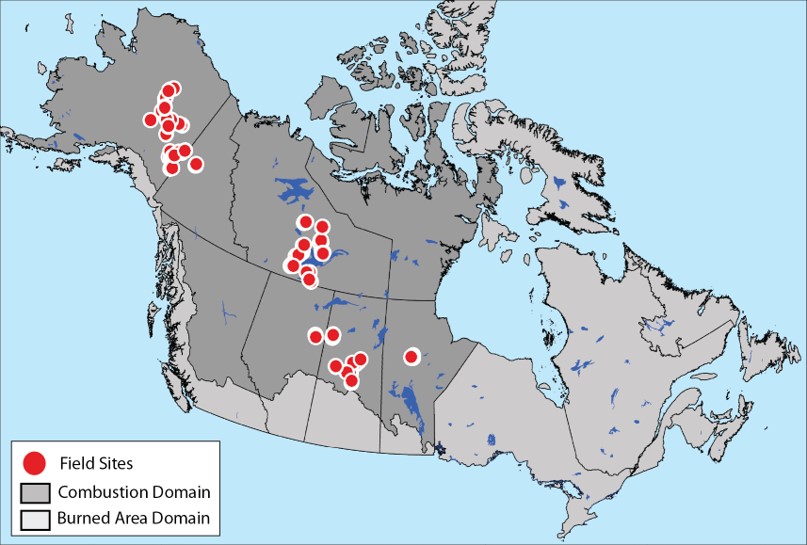
Figure 2. Study domain. Locations of combustion observations are shown in red, the burned area product domain is shown in light gray, and the combustion and burned depth product domain is shown in dark gray.
Burn Depth &Combustion
Aboveground combustion, belowground combustion, and burn depth were predicted for every mapped burned pixel in the ABoVE domain based on field observations across Alaska and western Canada (Walker et al., 2019; Fig. 2). Because not all field sites included estimates of both above- and belowground combustion, two separate combustion models were developed, one utilizing all available aboveground measurements (n=515) and one utilizing all available belowground combustion measurements (n=769). The burn depth model utilized the same field sites as belowground combustion. Predictor variables included remotely sensed indicators of fire severity (MODIS), topography, soils, climate, and fire weather. Fire weather indices, representing meteorology at the time of fire occurrence (Field et al., 2015), were incorporated into the primary prediction model. However, these weather indices were not available for 4.4% of burned pixels, so a secondary prediction model without the weather indices was used. For each pixel, the model used (primary or secondary) and the availability of ideal MODIS data are recorded in the quality flag (Table 3).
Site-level prediction models were applied across the ABoVE domain. To assess the potential effects of scaling and bias, predictions were validated using a random sample (n=1000) of pixels from 2004–2015. This assessment resulted in minor adjustments to predictions. The overall effect of spatial scaling was minimal.
See Potter et al. (2022) for details of this research and methods for generating this dataset.
Data Access
These data are available through the Oak Ridge National Laboratory (ORNL) Distributed Active Archive Center (DAAC).
ABoVE: Burned Area, Depth, and Combustion for Alaska and Canada, 2001-2019
Contact for Data Center Access Information:
- E-mail: uso@daac.ornl.gov
- Telephone: +1 (865) 241-3952
References
Didan, K.. 2015a. MOD13A3 MODIS/Terra vegetation Indices Monthly L3 Global 1km SIN Grid V006. NASA EOSDIS Land Processes DAAC. Accessed 2021-12-09 from https://doi.org/10.5067/MODIS/MOD13A3.006
Didan, K.. 2015b. MOD13A3 MODIS/Terra vegetation Indices Monthly L3 Global 1km SIN Grid V006.NASA EOSDIS Land Processes DAAC. Accessed 2021-12-09 from https://doi.org/10.5067/MODIS/MOD13A3.006
Field, R. D., A.C. Spessa, N.A. Aziz, A. Camia, A. Cantin, R. Carr, W.J. de Groot, A.J. Dowdy, M.D. Flannigan, K. Manomaiphiboon, F. Pappenberger, V. Tanpipat, and X. Wang. 2015. Development of a Global Fire Weather Database. Natural Hazards and Earth System Sciences 15:1407-1423. https://doi.org/10.5194/nhess-15-1407-2015
Potter, S., S. Cooperdock, S. Veraverbeke, X. Walker, M.C. Mack, S.J. Goetz, J. Baltzer, L. Bourgeau-Chavez, A. Burrell, C. Dieleman, N. French, S. Hantson, E.E. Hoy, L. Jenkins, J.F. Johnstone, E.S. Kane, S.M. Natali, J.T. Randerson, M.R. Turetsky, E. Whitman, E. Wiggins, and B.M. Rogers. Burned area and carbon emissions across northwestern boreal North America from 2001-2019. 2022, in process.
Hudak, A.T., P. Morgan, M.J. Bobbitt, A.M.S. Smith, S.A. Lewis, L.B. Lentile, P.R. Robichaud, J.T. Clark, and R.A. McKinley. 2007. The relationship of multispectral satellite Imagery to immediate fire effects. Fire Ecology 3:64-90. https://doi.org/10.4996/fireecology.0301064
Veraverbeke, S., B.M. Rogers, and J.T. Randerson. 2015. Daily burned area and carbon emissions from boreal fires in Alaska. Biogeosciences 12:3579-3601. https://doi.org/10.5194/bg-12-3579-2015
Veraverbeke, S., F. Sedano, S.J. Hook, J.T. Randerson, Y. Jin, and B.M. Rogers. 2014. Mapping the daily progression of large wildland fires using MODIS active fire data. International Journal of Wildland Fire 23:655-667. https://doi.org/10.1071/WF13015
Walker, X.J., J.L. Baltzer, L.L. Bourgeau-Chavez, N.J. Day, W.J. De Groot, C. Dieleman, E.E. Hoy, J.F. Johnstone, E.S. Kane, M.A. Parisien, S. Potter, B.M. Rogers, M.R. Turetsky, S. Veraverbeke, E. Whitman, and M.C. Mack. 2019. ABoVE: Synthesis of Burned and Unburned Forest Site Data, AK and Canada, 1983-2016. ORNL DAAC, Oak Ridge, Tennessee, USA. https://doi.org/10.3334/ORNLDAAC/1744