Documentation Revision Date: 2025-06-10
Dataset Version: 1
Summary
There are 348 data files in GeoTIFF (.tif) format in this dataset.
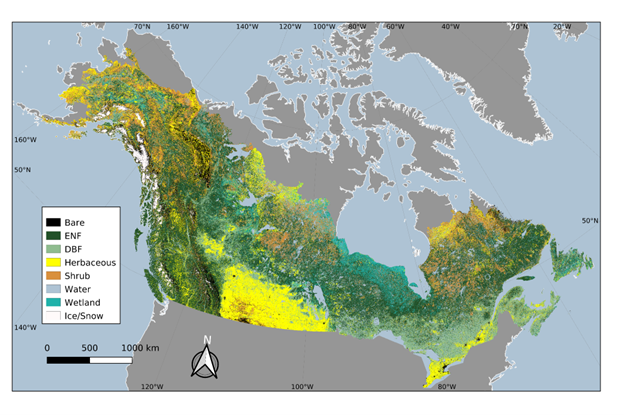
Figure 1. Land cover for the year 2020 of the whole study domain. The pixel resolution is 30 m and each tile is 180 x 180 km. The deciduous broadleaf forest (DNF) class was combined with the mixed forest class. Bare = bare ground or sparely vegetated. ENF = evergreen needleleaf forest.
Citation
Hu, K.T., J.A. Wang, M.A. Friedl, W. Liang, J. Kim, X. Zhu, D.C. Morton, and J.T. Randerson. 2025. ABoVE: Landsat-derived Annual Dominant Land Cover in Boreal North America, 1986-2020. ORNL DAAC, Oak Ridge, Tennessee, USA. https://doi.org/10.3334/ORNLDAAC/2423
Table of Contents
- Dataset Overview
- Data Characteristics
- Application and Derivation
- Quality Assessment
- Data Acquisition, Materials, and Methods
- Data Access
- References
Dataset Overview
This dataset contains a 30-m resolution time series of annual land cover classifications as the dominant plant functional type class for all of boreal Alaska and Canada from 1986 to 2020. The data were derived from a time series of Landsat Collection 2 Surface Reflectance and processed using the Continuous Change Detection and Classification (CCDC) algorithm. This dataset includes a nine-class land cover scheme. Classification accuracy was assessed using a probability-based random sample, ensuring statistically robust area estimates and uncertainty measures. The classifications were produced using a supervised Random Forest classification model trained on Canadian National Forest Inventory photo plot data.
The study area included all of boreal Canada and Alaska, which covers roughly 8.3 million km2. The North America Level II Ecoregions from the US Environmental Protection Agency (US EPA, 2010) following Baltzer et al. (2021) was used to delineate boreal ecoregions from the Arctic tundra.
Project: Arctic-Boreal Vulnerability Experiment
The Arctic-Boreal Vulnerability Experiment (ABoVE) is a NASA Terrestrial Ecology Program field campaign being conducted in Alaska and western Canada, for 8 to 10 years, starting in 2015. Research for ABoVE links field-based, process-level studies with geospatial data products derived from airborne and satellite sensors, providing a foundation for improving the analysis, and modeling capabilities needed to understand and predict ecosystem responses to, and societal implications of, climate change in the Arctic and Boreal regions.
Related Publication
Hu, K.T., J. Wang, S. Zhu, W. Liang, D. Morton, J. Kim, J.T. Randerson, and M.A. Friedl. 2025. Widespread loss of evergreen conifer forests in North American boreal forests. In review.
Related Datasets
Loboda, T.V., E.E. Hoy, and M.L. Carroll. 2019. ABoVE: Study Domain and Standard Reference Grids, Version 2. ORNL DAAC, Oak Ridge, Tennessee, USA. https://doi.org/10.3334/ORNLDAAC/1527
Wang, J.A., D. Sulla-Menashe, C.E. Woodcock, O. Sonnentag, R.F. Keeling, and M.A. Friedl. 2019. ABoVE: Landsat-derived Annual Dominant Land Cover Across ABoVE Core Domain, 1984-2014. ORNL DAAC, Oak Ridge, Tennessee, USA. https://doi.org/10.3334/ORNLDAAC/1691
Acknowledgments
This research was funded by the NASA Terrestrial Ecology- Arctic and Boreal Vulnerability Experiment (grant 80NSSC23K0140). B. Smiley and others at Natural Resources Canada provided access to the Canada's National Forest Inventory (NFI) photo plot data used in trainning the land cover model. We also acknowledge support from Google, who provided computing resources on Google Earth Engine required to compile this data set.
Data Characteristics
Spatial Coverage: Boreal region of Canada and Alaska, USA
Spatial Resolution: 30 m
Temporal Coverage: 1986-01-01 to 2020-12-31
Temporal Resolution: Annual
Study Area (All latitude and longitude are given in decimal degrees)
| Study Area | Northernmost Extent | Westernmost Extent | Easternmost Extent | Southernmost Extent |
|---|---|---|---|---|
| Boreal Alaska and Canada | 71.0675 | -166.6840 | -50.1767 | 41.2275 |
Data File Information
There are 348 data files in GeoTIFF (.tif) format in this dataset. The data provide the dominant plant functional type class for a given 30-m pixel in the identified ABoVE Level B grid (BhXXvZZ).
GeoTIFF Files
The file naming convention is ABoVE_LC_P3_Bh<XX>v<ZZ>.tif, where <XX> is the horizontal ABoVE tile location and <ZZ> is the vertical ABoVE tile location for the respective B grid cell (Loboda et al., 2019).
Example file names: ABoVE_LC_P3_Bh000v006.tif, ABoVE_LC_P3_Bh002v003.tif, ABoVE_LC_P3_Bh006v007.tif
Each GeoTIFF provides the the dominant land cover type at a given pixel of 30 m. Each file is a 35-band GeoTIFF, with each band providing one year of data for the period 1986-2020, where band 1 is year 1986, band 2 is 1987, and so on until band 35, which is 2020.
GeoTIFF Properties
- Coordinate system: NAD 1983 Albers Canada (EPSG: 102001) projection, units m.
- Resolution: 30 m
- Number rows and columns: 6,000 x 6,000
- Bands: 35; one per year for 1986 through 2020
- No data value: 0. Missing values primarily occur as part of the ocean mask or for screened permanent snow/ice pixels.
Table 1. Nine landcover functional types provided in the files
| Pixel value | Land Cover Type | Description |
|---|---|---|
| 1 | Bare/Sparsely vegetated | Lands with <25% vegetation cover. |
| 2 | Deciduous Forest (DF) | Lands with >25% tree cover, where tree species composition is >75% deciduous broadleaf. |
| 3 | Evergreen Forest (EF) | Lands with >25% tree cover, where tree species composition is >75% evergreen needleleaf. |
| 4 | Mixed Forest | Lands with >25% tree cover, where tree species composition of combined evergreen and deciduous is <75%. Combined with Deciduous Forest for accuracy assessment. |
| 5 | Herb | Lands with unsaturated substrate, <25% tree and <25% shrub cover with >25% herbaceous cover. |
| 6 | Shrub | Lands with unsaturated substrate, <25% tree cover with >25% shrubs (evergreen or deciduous) >50 cm. |
| 7 | Water | Areas with >50% water cover |
| 8 | Wetland | Lands where substrate is saturated at least 10 months of most years and tree cover <25% |
| 9 | Ice/Snow | Lands >50% persistent snow and ice cover. Excluded for accuracy assessment. |
Application and Derivation
This dataset provides time series land cover data, including some plant functional types, for each year in 1986-2020. Among other purposes, this data can be used to quantify changes in plant functional type distribution, to characterize wildfire risk, to improve ecosystem models, or to provide contextual information to other models and analyses.
The data is largely derived from outputs of a machine learning model trained on Canadian forest inventory data and applied to surface reflectance derived from time series remote sensing. This dataset builds off of the workflows and data products from Wang et al. (2019), but extends the domain from western Canada and Alaska to include southern and eastern Canada and the time period up to 2020. However, unlike the Wang et al. (2019) dataset, this dataset has a simpler land cover legend and excludes the tundra.
Quality Assessment
The confusion matrix of accuracy assessment of the 1986 and 2020 land cover map is provided in Table 2. For the accuracy assessment of land cover and land cover change, high quality reference data were compiled based on a sample of 2,043 following Olofsson et al. (2014). Land cover and land cover change labels were assigned by visual interpretation of each sample point using high resolution imagery and time series of spectral reflectance and vegetation index time series for each sample point. To ensure the quality of the reference data set, each sample point was reviewed by at least two analysts, and reference samples where the analysts disagreed were excluded. The ice/snow class in the accuracy assessment was excluded because it was not a focus of this work. The overall accuracy was 79%.
Table 2. Confusion matrix and accuracy assessment comparing mapped cover types for 1986 vs 2020 against reference data. Reference data are in columns; mapped classification data are in rows. The definitions of cover types and change classes are in Tables 1 and 3.
| Reference cover types | Change class for reference types | |||||||||||||||
| Bare | DF | EF | Herb | Shrubland | Water | Wetland | EF loss | DF gain | EF gain | DF loss | Shrubland gain | Other | Total | User Accuracy | ||
| Mapped cover types | Bare | 66 | 1 | 1 | 5 | 2 | 0 | 0 | 0 | 0 | 0 | 0 | 0 | 1 | 76 | 0.87 |
| DF | 0 | 138 | 17 | 0 | 5 | 0 | 1 | 0 | 3 | 0 | 0 | 0 | 0 | 164 | 0.84 | |
| EF | 2 | 18 | 538 | 3 | 26 | 1 | 6 | 10 | 1 | 1 | 0 | 0 | 0 | 606 | 0.89 | |
| Herb | 4 | 3 | 3 | 151 | 38 | 0 | 5 | 1 | 0 | 0 | 0 | 0 | 0 | 205 | 0.74 | |
| Shrubland | 2 | 2 | 18 | 10 | 169 | 2 | 5 | 0 | 0 | 1 | 0 | 0 | 0 | 209 | 0.81 | |
| Water | 1 | 0 | 2 | 0 | 0 | 279 | 1 | 0 | 0 | 0 | 0 | 0 | 0 | 283 | 0.99 | |
| Wetland | 1 | 2 | 6 | 3 | 14 | 1 | 72 | 0 | 0 | 0 | 0 | 0 | 0 | 99 | 0.73 | |
| Change class for mapped types | EF loss | 1 | 0 | 5 | 0 | 10 | 0 | 5 | 88 | 2 | 0 | 0 | 0 | 1 | 112 | 0.79 |
| DF gain | 0 | 13 | 5 | 1 | 0 | 0 | 1 | 1 | 32 | 2 | 1 | 0 | 0 | 56 | 0.57 | |
| EF gain | 0 | 3 | 20 | 0 | 6 | 0 | 3 | 0 | 3 | 27 | 0 | 0 | 0 | 62 | 0.44 | |
| DF loss | 0 | 4 | 0 | 5 | 1 | 0 | 3 | 0 | 0 | 0 | 31 | 0 | 1 | 45 | 0.69 | |
| Shrubland gain | 0 | 1 | 1 | 6 | 17 | 0 | 5 | 1 | 0 | 0 | 0 | 14 | 1 | 46 | 0.3 | |
| Other | 11 | 0 | 1 | 27 | 18 | 1 | 6 | 4 | 1 | 0 | 0 | 2 | 9 | 80 | 0.11 | |
| Total | 88 | 185 | 617 | 211 | 306 | 284 | 113 | 105 | 42 | 31 | 32 | 16 | 13 | 2043 | ||
| Producer Accuracy |
0.75 | 0.75 | 0.87 | 0.72 | 0.55 | 0.98 | 0.64 | 0.84 | 0.76 | 0.87 | 0.97 | 0.88 | 0.69 | 0.79 | ||
Table 3. Land cover change labels and definitions. Land cover change is assessed by comparing the beginning (1986) and end (2020) of the time series.
| Change Class | Description |
|---|---|
| Evergreen Forest Loss | EF to any non-forest class (bare/herbaceous/shrubland/water/wetland) |
| Deciduous Forest Gain | Any class, excluding water (ENF/herbaceous/shrubland/wetland) to DF |
| Evergreen Forest Gain | Any class, excluding water (DBF/bare/herbaceous/shrubland/wetland) to EF |
| Deciduous Forest Loss | DF to bare/herbaceous/shrubland/water/wetland |
| Shrub Gain | Conversion to shrubland from Barren/Herbaceous/water/Wetland |
| Other Changes | All other transitions not listed above |
Data Acquisition, Materials, and Methods
The study area included all of boreal regions of Canada and Alaska, which covers roughly 8.3 million km2. The North America Level II Ecoregions from the US Environmental Protection Agency (US EPA, 2010) following Baltzer et al. (2021) was used to delineate boreal ecoregions.
The foundation of the mapping methodology is the Continuous Change Detection and Classification (CCDC) algorithm (Zhu and Woodcock, 2014). The CCDC algorithm uses harmonic models fit to each band in the multispectral time series of Landsat reflectance values at each pixel. This approach includes explicit treatment of sub-annual seasonality and also provides a natural way to fill gaps and filter noisy observations, which are common at high latitudes where missing data and contamination from clouds are common. To enable processing of the Landsat archive at continental scale, the CCDC algorithm was implemented on Google Earth Engine; it used Landsat Collection 2 Surface Reflectance data from 1984-2022 (Earth Engine Data Catalog, 2020). CCDC results tend to be less reliable at the beginning and end of the time series at each pixel; therefore, results from the first two years and last two years of the time series were excluded. These results include 1986-2020. This study used data collected by the Thematic Mapper, Enhanced Thematic Mapper Plus, and Operational Land Imager onboard Landsat 5, 7 and 8, respectively.
Mapping was performed at the scale of US EPA Level II ecoregions, using 13 US EPA Level II Ecoregions. Thirteen unique classification models were estimated and tuned to each ecoregion. To avoid geographic boundary artifacts associated with applying different classification models in each ecoregion, training data from 100-km buffers in adjacent ecoregions were included in the training set for each ecoregion. Classification models were estimated using the Random Forest algorithm (Breiman, 2001), and were trained using spectral features derived from CCDC along with Tasseled Cap spectral vegetation indices, and gridded data related to human settlements, climate, surface water, topography. To ensure that imbalance in the frequency of classes in the training data did not bias the random forest models, training data for any class that represented less than 5% of the total sample within an ecoregion were augmented by adding randomly selected training points from adjacent ecoregions. Conversely, if the sample size for a particular class exceeded 30% of the total training sites within an ecoregion, the training data were down-sampled for that class to decrease the number of samples in that class.
To compile training samples, eight main land cover classes (not including the Snow/Ice class) were randomly sampled from the Canada National Forest Inventory (NFI) Photo Plot data (https://nfi.nfis.org/en/photo_plot), which provides photo-interpreted attributes from high resolution imagery (Falkowski et al., 2009; Leckie and Gillis, 1995). Each photo plot consists of a 2 by 2-km (400 ha) area. The entire data set provides a 1% sample of Canada's entire non-Arctic land area in the National Terrestrial Monitoring Framework (NTMF), where the plot locations are allocated using a systematic 20 by 20 km sampling grid. The survey is conducted every 10 years, and follows a hierarchical classification structure that includes land cover and vegetation density classes, along with information regarding land use, ownership, and protected status. The total data set includes roughly 397,000 polygons. For this work, one Landsat pixel was randomly selected in each polygon (ensuring a minimum distance of 45 m from the edge of the polygon) from the NFI Photo Plot ‘First remeasurement’ data set, which covers all of Canada. A minimum of 2,000 points were selected for each class. In total, 52,228 pixel-based training samples were selected from the NFI photo plot data set. In western Canada and Alaska, the NFI-based training data were supplemented with 6,409 sites from Wang et al. (2020) for Bare, Shrubland and Herbaceous classes, which were crosswalked from Barren, Low Shrub, Tall Shrub, Open Shrubs, and Herbaceous classes in their study. Since Alaska is not covered by the Canada NFI, these additional samples were especially important for representing non-forest classes in that region. To balance the supplementary training samples from Wang et al. (2019), which were only available for the NASA ABoVE study region in northwestern North America, the random sample of NFI polygons in Eastern Canada were supplemented with additional samples of Bare, Shrub, and Herb from NFI polygons.
Data Access
These data are available through the Oak Ridge National Laboratory (ORNL) Distributed Active Archive Center (DAAC).
ABoVE: Landsat-derived Annual Dominant Land Cover in Boreal North America, 1986-2020
Contact for Data Center Access Information:
- E-mail: uso@daac.ornl.gov
- Telephone: +1 (865) 241-3952
References
Baltzer, J.L., N.J. Day, X.J. Walker, D. Greene, M.C. Mack, H.D. Alexander, D. Arseneault, J. Barnes, Y. Bergeron, Y. Boucher, L. Bourgeau-Chavez, C.D. Brown, S. Carrière, B.K. Howard, S. Gauthier, S., M.-A. Parisien, K.A. Reid, B.M. Rogers, C. Roland, L. Sirois, S. Stehn, D.K. Thompson, M.R. Turetsky, S. Veraverbeke, E. Whitman, J. Yang and J.F. Johnstone. 2021. Increasing fire and the decline of fire adapted black spruce in the boreal forest. Proceedings of the National Academy of Sciences 118:e2024872118. https://doi.org/10.1073/pnas.2024872118
Breiman, L. 2001. Random forests. Machine Learning 45:5-32. https://doi.org/10.1023/A:1010933404324
Earth Engine Data Catalog. 2020. Google Global Landsat-based CCDC Segments (1999–2019). https://developers.google.com/earth-engine/datasets/catalog/GOOGLE_GLOBAL_CCDC_V1
Falkowski, M.J., M.A. Wulder, J.C. White, and M.D. Gillis. 2009. Supporting large-area, sample-based forest inventories with very high spatial resolution satellite imagery. Progress in Physical Geography: Earth and Environment 33:403-423. https://doi.org/10.1177/0309133309342643
Hu, K.T., J. Wang, S. Zhu, W. Liang, D. Morton, J. Kim, J.T. Randerson, and M.A. Friedl. 2025. Widespread loss of evergreen conifer forests in North American boreal forests. In preparation.
Leckie, D.G., and M.D. Gillis. 1995. Forest inventory in Canada with emphasis on map production. The Forestry Chronicle 71:74-88. https://doi.org/10.5558/tfc71074-1
Loboda, T.V., E.E. Hoy, and M.L. Carroll. 2019. ABoVE: Study Domain and Standard Reference Grids, Version 2. ORNL DAAC, Oak Ridge, Tennessee, USA. https://doi.org/10.3334/ORNLDAAC/1527
Olofsson, P., G.M. Foody, M. Herold, S.V. Stehman, C.E. Woodcock, and M.A. Wulder. 2014. Good practices for estimating area and assessing accuracy of land change. Remote Sensing of Environment 148:42-57. https://doi.org/10.1016/j.rse.2014.02.015
US EPA. 2010. Level II Ecoregions of North America Shapefile. NA_CEC_Eco_Level2. U.S. EPA Office of Research & Development (ORD) - National Health and Environmental Effects Research Laboratory (NHEERL); Corvallis, Oregon. https://www.epa.gov/eco-research/ecoregions-north-america
Wang, J.A., D. Sulla-Menashe, C.E. Woodcock, O. Sonnentag, R.F. Keeling, and M.A. Friedl. 2020. Extensive land cover change across Arctic–Boreal Northwestern North America from disturbance and climate forcing. Global Change Biology 26:807-822. https://doi.org/10.1111/gcb.14804
Wang, J.A., D. Sulla-Menashe, C.E. Woodcock, O. Sonnentag, R.F. Keeling, and M.A. Friedl. 2019. ABoVE: Landsat-derived Annual Dominant Land Cover Across ABoVE Core Domain, 1984-2014. ORNL DAAC, Oak Ridge, Tennessee, USA. https://doi.org/10.3334/ORNLDAAC/1691
Zhu, Z., and C.E. Woodcock. 2014. Continuous change detection and classification of land cover using all available Landsat data. Remote Sensing of Environment 144:152–171. https://doi.org/10.1016/j.rse.2014.01.011