Documentation Revision Date: 2024-03-18
Dataset Version: 1
Summary
This dataset includes 24,427 data files in Cloud-Optimized GeoTIFF (*.tif) format.
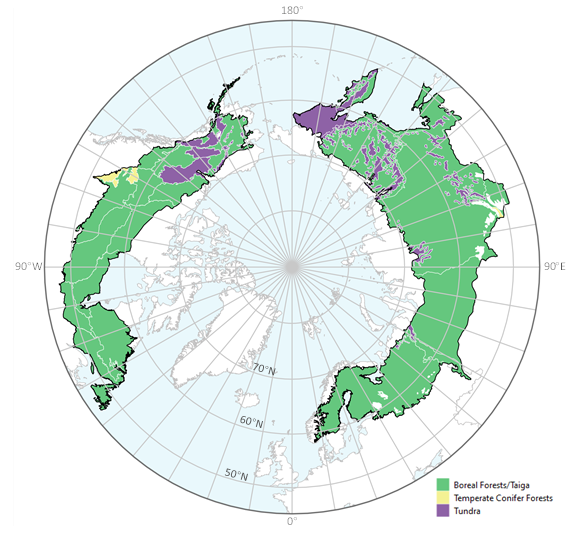
Figure 1. Tree canopy cover over global boreal forests in 2020.
Citation
Feng, M., J.O. Sexton, P. Wang, S. Channan, P.M. Montesano, W. Wagner, M.R. Wooten, and C.S. Neigh. 2022. ABoVE: Tree Canopy Cover and Stand Age from Landsat, Boreal Forest Biome, 1984-2020. ORNL DAAC, Oak Ridge, Tennessee, USA. https://doi.org/10.3334/ORNLDAAC/2012
Table of Contents
- Dataset Overview
- Data Characteristics
- Application and Derivation
- Quality Assessment
- Data Acquisition, Materials, and Methods
- Data Access
- References
Dataset Overview
This dataset contains Landsat-derived locally-calibrated estimates of tree canopy cover (TCC) and forest stand age across global boreal forests from 1984-2020 in Cloud-Optimized GeoTIFF (*.tif) format. These raster data span the circum-hemispheric boreal forest biome between 47 to 73 degrees north at 30 m resolution. Machine learning models calibrated with data from the World Reference System 2 were used to predict TCC from Landsat data at 30-m spatial resolution at annual temporal resolution. Through analysis of TCC time series, forest change estimates of stand age from 1984-2020 were developed. The broad spatial and temporal coverage of these data provide insight into forest and carbon dynamics of the global boreal forest system. Boreal forests store a large proportion of global soil and biomass carbon and have experienced disproportionately high levels of warming over the past century.
Project: Arctic-Boreal Vulnerability Experiment
The Arctic-Boreal Vulnerability Experiment (ABoVE) is a NASA Terrestrial Ecology Program field campaign being conducted in Alaska and western Canada, for 8 to 10 years, starting in 2015. Research for ABoVE links field-based, process-level studies with geospatial data products derived from airborne and satellite sensors, providing a foundation for improving the analysis, and modeling capabilities needed to understand and predict ecosystem responses to, and societal implications of, climate change in the Arctic and Boreal regions.
Related Data:
Berner, L.T., and S.J. Goetz. 2022. ABoVE: Landsat Vegetation Greenness Trends, Boreal Forest Biome, 1985-2019. ORNL DAAC, Oak Ridge, Tennessee, USA. https://doi.org/10.3334/ORNLDAAC/2023
- This dataset provides information on interannual trends in annual maximum vegetation greenness from 1985 to 2019 for recently undisturbed areas in the boreal forest biome.
Acknowledgment:
This research was supported by the NASA Carbon Cycle Science Program (NNH16ZDA001N-CARBON), National Science Foundation Arctic System Science Program (1604105), and NASA ABoVE (80NSSC19M0112). Satellite image processing was performed by terraPulse, Inc. on Amazon Web Services (AWS). Reference data for calibration and validation was produced on the NASA Goddard Spaceflight Center ADAPT and HEC clusters.
Data Characteristics
Spatial Coverage: Pan-boreal including all boreal forest or taiga ecoregions, as well as temperate conifer forests and tundra regions predominantly surrounded by boreal forest or taiga (Figure 1).
Spatial Resolution: 30 m
Temporal Coverage: 1984 to 2020
Temporal Resolution: Annual
Study Areas: Latitude and longitude are given in decimal degrees.
| Site | Westernmost Longitude | Easternmost Longitude | Northernmost Latitude | Southernmost Latitude |
|---|---|---|---|---|
| Global boreal forest | -180.00 | 180.00 | 73.00 | 45.00 |
Data File Information
This dataset includes two components, tree-canopy cover (TCC) and forest stand age. Both are provided in Cloud-Optimized GeoTiff (*.tif) format.
TCC files indicate percent tree cover within a given pixel (value rage: 0-100) There are 23,778 TCC files. Each file covers a 2.5 degree x 2.5 degree tile with one file for each year from 1984 to 2020.
The naming convention for the TCC data files is Lon_Lat_tcc_YYYY.tif,
where: Lon_Lat is the coordinate of the northwest corner (rounded down nearest integer) of the 2.5degree x 2.5 degree tile and YYYY is the year.
Stand age files indicate the number of years since a pixel given had an initial significant increase in tree canopy cover(value range: 0-37, with a value of 50 indicating persistent forest cover from 1984-2020). There are 649 stand age files, one for each 2.5 degree x 2.5 degree tile.
The naming convention for the stand age data files is Lon_Lat_forest_age.tif,
where: Lon_Lat is the coordinate of the northwest corner (rounded down nearest integer) of the 2.5 degree x 2.5 degree tile.
GeoTIFF characteristics:
- Projection: WGS 1984 (EPSG 4326)
- Cell size: 0.00025 degree x 0.00025 degree
- Rows: 1000
- Columns: 1000
- Missing data value: 255
- Units: Unitless percentage for TCC. Number of years for stand age.
TCC Coverage Gaps: The table below lists tiles that do not have complete temporal coverage among TCC files. 2020 is the only year with complete coverage across all 649 TCC tiles.
|
Tile Name |
Years Not Present |
|
115E_62N |
2011-2019 |
|
120W_62N |
1992-2019 |
|
130E_58N |
2000-2019 |
|
130W_65N |
1986-2019 |
|
130W_70N |
1984-2019 |
|
132E_50N |
1984-2019 |
|
132E_52N |
1984-2019 |
|
132E_55N |
1984-2019 |
Application and Derivation
This unprecedented long-term boreal forest change and age record will be valuable for answering important science questions concerning C dynamics of Arctic-Boreal Terrestrial Ecosystems. By correlating with forest structural information and integrating with Dynamic Global Vegetation Models (DGVMs), these forest age estimates could lead to better estimates of boreal forest growth potential and C-flux.
Quality Assessment
Global TCC produced using the same methodology for the nominal years of 2000, 2005, and 2010 (Sexton et al. 2013) was validated in the boreal domain by a previous study (Montesano et al, 2016). Using reference data derived from airborne Lidar and visually interpreted high-resolution imagery (Montesano et al, 2016), estimated that average pixel-level uncertainties in TCC were 29.0%, 27.1% and 31.1% for the 2000, 2005 and 2010 epochs. Similarly, using a 2017 subset of airborne Lidar data from (Montesano et al, 2022), we estimated that uncertainty of TCC produced using globally calibrated model was 24.8%. After calibrating TCC with reference data obtained within the boreal domain, RMSE was reduced to 16.4%.
More details about quality assessment of this dataset will be available in a paper currently in review (Feng et al, In review).
Data Acquisition, Materials, and Methods
Estimation of tree-canopy cover (TCC) was based on Landsat Collection-1 images from 1984 to 2020 downloaded from USGS/EROS Data Center (http://landsat.usgs.gov). Images were combined from level-1 Terrain Corrected (L1T) Landsat-4 and 5 Thematic Mapper (TM), Landsat-7 Enhanced Thematic Mapper Plus (ETM+), and Landsat-8 Operational Land Imager (OLI) sensors. Each image was converted to units of surface reflectance; the Landsat Ecosystem Disturbance Adaptive Processing System (LEDAPS) 2 was used for TM/ETM+ images, and the Landsat Surface Reflectance (LaSRC) 3 was used for OLI images.
Leveraging the high degree of image overlap in the high latitudes, a total of 2,189 World Reference System 2 (WRS-2) tiles were selected to cover the region and span of study. A maximum of four Landsat images within the growing season of each year and WRS-2 tile were selected to avoid noise from clouds, snow, and phenological variation. All Landsat images were scored by cloud coverage, seasonality, and image quality (e.g., SLC-off, Landsat processing levels), and the images with the highest scores in each year were selected for analysis. Up to 148 images could be selected for a WRS-2 tile to ensure complete temporal coverage. A total of 224,026 Landsat images were selected across the boreal region, including 110,407 TM images from Landsat 4 and 5, 59,791 ETM+ images from Landsat 7, and 53,828 OLI images from Landsat 8 (Figure 2). The actual numbers of Landsat images selected varied across the region due to the availability of images in archive 4. Of the 2,189 WRS-2 tiles, 72.6% had at least 90 images collected out of the maximum possible 148, providing a sufficient sample for the analysis. Missed images for periods during the 1980s and 1990s occurred due to the lack of receiving capacities for Landsat 4 and 5; these tiles were mainly located in central and eastern Russia (Figure 2).
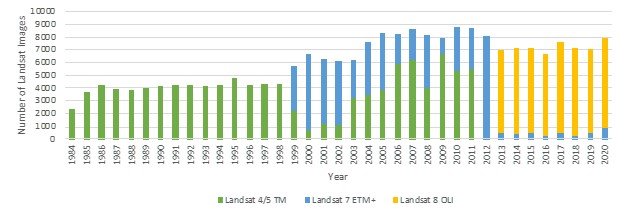
Figure 2. Number of Landsat TM, ETM+, and OLI images selected in each year.
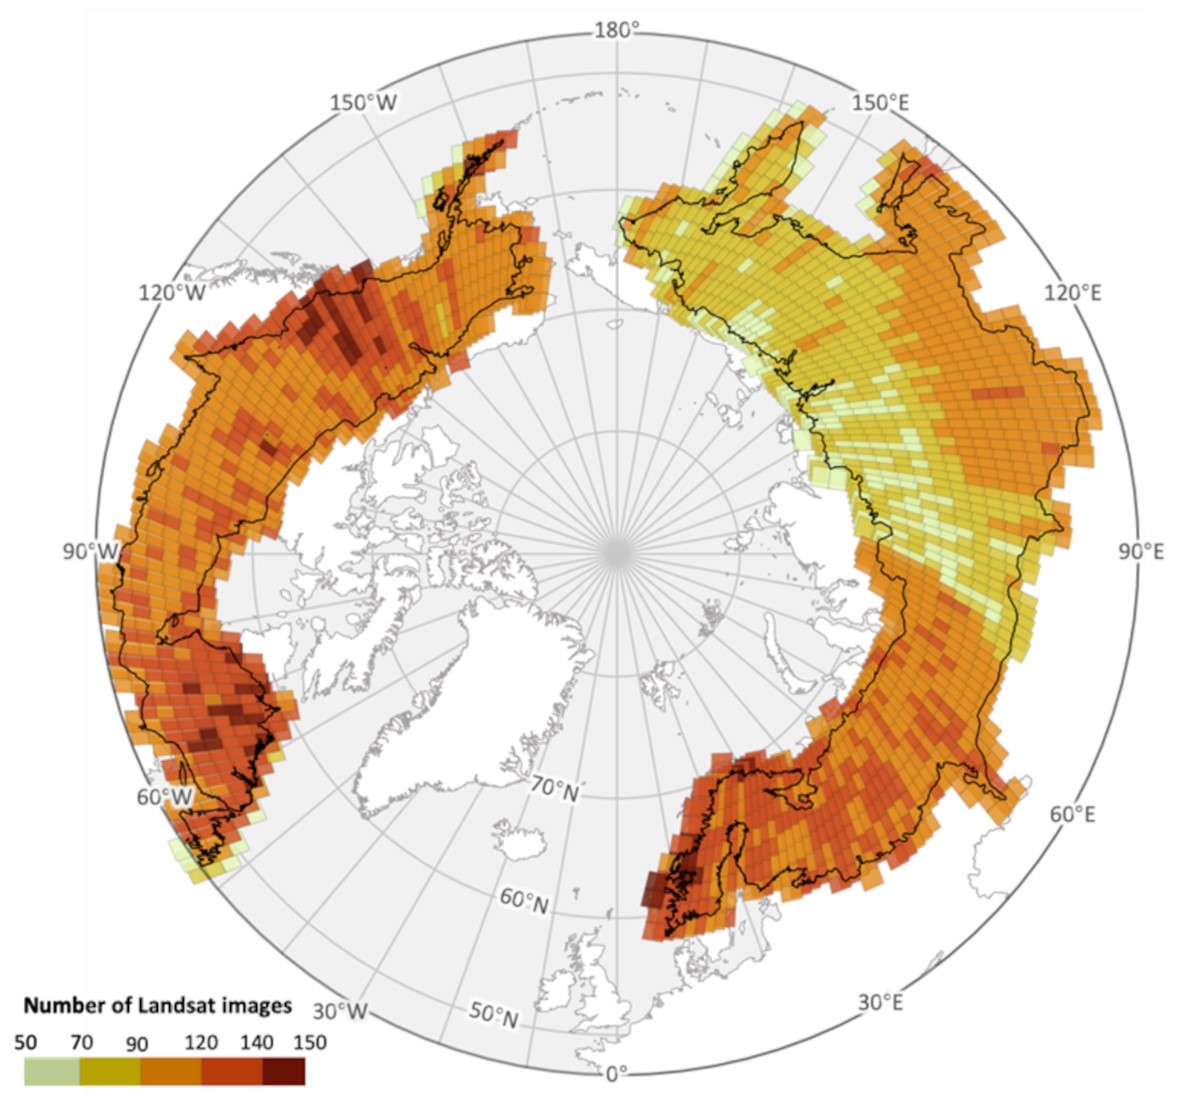
Figure 3. Spatial distribution of sampling density of Landsat images across the study region from 1984 – 2020.
To estimate years of forest disturbance and establishment, the category “forest” was defined as a class of tree cover exceeding a predefined threshold value, c* = 30% in each pixel. The probability of a pixel belonging to “forest”, p(F), is therefore the probability of c exceeding c*—i.e., the integral of the probability density function of c above c*. Using the 37-year time series of 30-m, annual-resolution estimates of forest probability in each pixel, forest losses and gains were detected by applying a two-sample z-test in a moving kernel over time. The test was applied with the kernel centered on each forest-probability value of 50% in the series that was also increasing over time. If a statistically significant (p <= 0.05) difference was identified between the two ascending groups, the focal year was labeled as a forest gain or loss. If multiple significant losses or gains were detected in a pixel over the 36 years (1985-2020), up to three events were recorded. The detected forest disturbance is categorized as “incomplete” if its input annual tree-canopy cover had records missing at more than 7 years over the observable period (1985-2020); otherwise, “complete”. The “incomplete” disturbance mainly occurred after 1999 due to the limited coverage of Landsat data before Landsat ETM+ (Figure 3).
Age of the forest, in years, at any year t* and location (x, y) was calculated by subtracting the year of the most recent significant forest gain t+ from the focal year. While insensitive to the early stages of seedling establishment and growth, this formalization is logically consistent with the definition of forest and enabled consistent measurement across the entire boreal domain. Forested pixels were further categorized into “new” and “recovering” forests: “new” forests were identified as pixels with forest cover following a gain but no prior forest cover or loss earlier in the time series within a 150-m radius (5 pixels) over the observable period (1985 – 2020); “recovering” forests were identified as pixels with forest cover following a gain where a forest loss had been observed previously in the series.
Data Access
These data are available through the Oak Ridge National Laboratory (ORNL) Distributed Active Archive Center (DAAC).
ABoVE: Tree Canopy Cover and Stand Age from Landsat, Boreal Forest Biome, 1984-2020
Contact for Data Center Access Information:
- E-mail: uso@daac.ornl.gov
- Telephone: +1 (865) 241-3952
References
Berner, L.T., and S.J. Goetz. 2022. ABoVE: Landsat Vegetation Greenness Trends, Boreal Forest Biome, 1985-2019. ORNL DAAC, Oak Ridge, Tennessee, USA. https://doi.org/10.3334/ORNLDAAC/2023
Feng, M. et al. Northward shift of boreal tree cover confirmed by satellite record. In review.
Montesano, P.M., M.J. Macander, and E.E. Hoy. 2022. ABoVE: LVIS L3 Gridded Vegetation Structure across North America, 2017 and 2019. ORNL DAAC, Oak Ridge, Tennessee, USA. https://doi.org/10.3334/ORNLDAAC/1923
Montesano, P.M., C.S Neigh, J. Sexton, J., M. Feng, S. Channan, K.J. Ranson, & J.R. Townshend. 2016. Calibration and validation of Landsat tree cover in the taiga− tundra ecotone. Remote Sensing, 8(7), 551. https://doi.org/10.3390/rs8070551
Sexton, J.O., X.P. Song, M. Feng, P. Noojipady, A. Anand, C. Huang, ... & J.R. Townshend. 2013. Global, 30-m resolution continuous fields of tree cover: Landsat-based rescaling of MODIS vegetation continuous fields with lidar-based estimates of error. International Journal of Digital Earth, 6(5), 427-448. https://doi.org/10.1080/17538947.2013.786146