Documentation Revision Date: 2023-08-23
Dataset Version: 1
Summary
The product consists of a set of 90-km tiles, and each tile has a set of iteratively resampled OLS models (field to ICESat-2) and random forest models (ICESat-2 to covariate stack). Pixel-level standard deviations (SD) were produced by bootstrapping both models and creating a new AGBD map for each iteration. Iterations were repeated until the 90-km SD of tile total AGB changed less than 5% when adding a new set of 10 iterations. The pixel-level SD is calculated as the SD of the set of pixel predictions from these iterations. This product was generated on the NASA-ESA Multi-Mission Algorithm and Analysis Platform (MAAP, https://scimaap.net), an open science platform. All code and input files are publicly available: https://repo.ops.maap-project.org/icesat2_boreal/icesat2_boreal.git
This dataset includes 7784 files: 3891 cloud-optimized GeoTIFFs, 3891 tables in comma-separated values (CSV) format, and two vector polygons in GeoPackage and Shapefile formats.
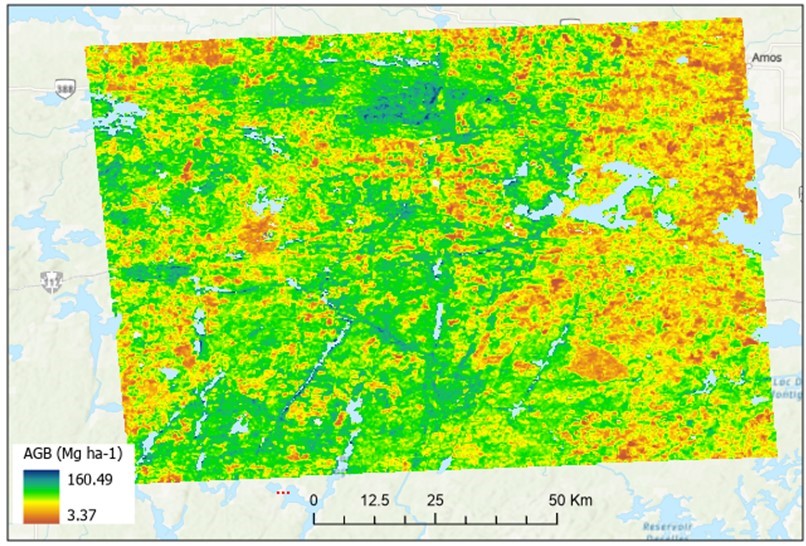
Figure 1. Aboveground biomass (Mg ha-1) for boreal forest estimated from ICESat2 imagery over the city of Rouyn_Noranda in western Ontario, Canada (approximately -78.758 longitude, 48.259 latitude). Source: boreal_agb_202302061675666296_1388.tif
Citation
Duncanson, L., P.M. Montesano, A. Neuenschwander, N. Thomas, A. Mandel, D. Minor, E. Guenther, S. Hancock, T. Feng, A. Barciauskas, G.W. Chang, S. Shah, and B.P. Satorius. 2023. Aboveground Biomass Density for High Latitude Forests from ICESat-2, 2020. ORNL DAAC, Oak Ridge, Tennessee, USA. https://doi.org/10.3334/ORNLDAAC/2186
Table of Contents
- Dataset Overview
- Data Characteristics
- Application and Derivation
- Quality Assessment
- Data Acquisition, Materials, and Methods
- Data Access
- References
Dataset Overview
This dataset provides estimates of Aboveground dry woody Biomass Density (AGBD) for high northern latitude forests at a 30-m spatial resolution. It is designed both for boreal-wide mapping and filling the northern spatial data gap from NASA's Global Ecosystem Dynamics Investigation (GEDI) project. Mapping forest aboveground biomass is essential for understanding, monitoring, and managing forest carbon stocks toward climate change mitigation. The AGBD estimates cover the extent of high latitude boreal forests and extended southward to 50 degrees latitude outside the boreal zone. AGBD was predicted using two modeling steps: 1) Ordinary Least Squares (OLS) regression related field plot measurements of AGBD to NASA's ICESat-2 30-m lidar samples, and 2) random forest models were used to extend estimates beyond the field plots by relating ICESat-2 AGBD predictions to wall-to-wall covariate stacks from Harmonized Landsat Sentinel-2 (HLS) and the Copernicus DEM. Per-pixel uncertainties are estimated from bootstrapping both models. Non-vegetated areas (e.g. built up, water, rock, ice) were masked out. HLS composites and ICESat-2 data were from 2019-2021; three years of conditions were aggregated into the circa 2020 map. ICESat-2 data were filtered to include only strong beams, growing seasons (June through September), solar elevations less than 5 degrees, snow free land (snow flag set to 1), and "msw_flag" equal to 0 (clear skies and no observed atmospheric scattering). ICESat-2's ATL08 product was resampled to a 30-m spatial resolution to better match both the field plots and mapped pixels. HLS data (L30HLS) were used to create a greenest pixel composite of growing season multispectral data, which was then used to compute a suite of vegetation indices: NDVI, NDWI, NBR, NBR2, TCW, TCG. These were then used, in combination with the slope and elevation data from the Copernicus DEM product, to predict 30-m AGBD per 90-km tile.
Project: Arctic-Boreal Vulnerability Experiment
The Arctic-Boreal Vulnerability Experiment (ABoVE) is a NASA Terrestrial Ecology Program field campaign being conducted in Alaska and western Canada, for 8 to 10 years, starting in 2015. Research for ABoVE links field-based, process-level studies with geospatial data products derived from airborne and satellite sensors, providing a foundation for improving the analysis, and modeling capabilities needed to understand and predict ecosystem responses to, and societal implications of, climate change in the Arctic and Boreal regions.
Acknowledgement
This work was supported by the NASA'sABoVE program (grant 80NSSC19M0117) and the NASA ICESat-2 Science Team (grant 80NSSC20K0965).
Data Characteristics
Spatial Coverage: Boreal forest zone of northern hemisphere and locations >44 degrees latitude harboring boreal forests.
Temporal Resolution: One-time measurements
Temporal Coverage: circa 2020 (input data used range from 2019-06-01 to 2021-09-30)
Study Area: Latitude and longitude are given in decimal degrees.
| Site | Westernmost Longitude | Easternmost Longitude | Northernmost Latitude | Southernmost Latitude |
|---|---|---|---|---|
| Boreal forests of northern hemisphere | -179.818 | 178.400 | 78.531 | 43.705 |
Data File Information:
This dataset includes 7784 files: 3891 cloud-optimized GeoTIFFs, 3891 tables in comma-separated values (CSV) format, and two vector polygons in GeoPackage and Shapefile formats.
The naming covention for the GeoTIFF files is: boreal_agb_<datetime>_<tile_num>.tif, where
- <datetime> = date and time of data generation on MAAP
- <tile_num> = tile index number corresponding to labeled polygons in geopackage and shapefile.
The CSV files are named boreal_agb_<datetime>_<tile_num>_train_data.csv. These files hold the values of aboveground biomass density measured in the field and used to train the OLS regressions and random forests models (Table 1).
The files boreal_agb_density_ICESat2_tiles_shp.zip and boreal_agb_density_ICESat2_tiles_v003.gpkg hold a vector map of tile polygons in shapefile and geopackage formats, respectively. The polygons are in geographic coordinates (longitude, latitude). Both files have attribute tables that include the tile index value ("tile_num") (Table 2).
GeoTIFF details:
- Projection: proj4 = "+proj=aea +lat_1=50 +lat_2=70 +lat_0=40 +lon_0=180 +x_0=0 +y_0=0 +ellps=GRS80 +towgs84=0,0,0,0,0,0,0 +units=m +no_defs"
- Spatial resolution: 30-m grid cells
- Extent: 90 km x 90 km (3000 x 3000 grid cells)
- Data Type: Float32
- Two bands: (1) estimated mean aboveground biomass density in Mg ha-1, (2) standard deviation of estimate in Mg ha-1.
Table 1. Variables in boreal_agb_<datetime>_<tile_num>_train_data.csv files.
| Variable | Units | Description |
|---|---|---|
| lon | degrees_east | Longitude of ICESat-2 30m segment centroid in decimal degrees. |
| lat | degrees_north | latitude of ICESat-2 30m segment centroid in decimal degrees. |
| AGB | Mg ha-1 | ICEsat-2 estimate of aboveground biomass (AGB) density of woody vegetation. |
| SE | Mg ha-1 | Standard error of OLS model between field AGBD and ICESat-2 heights. |
Table 2. Attributes of boreal_agb_density_ICESat2_tiles_shp.zip and boreal_agb_density_ICESat2_tiles_v003.gpkg.
| Attribute Variable | Description |
|---|---|
| tile_num | Integer number equivalent to the <tile_num> component of the GeoTIFF filenames. |
| GeoTIFF | Name of the GeoTIFF file associated with each tile polygon. This attribute is in the shapefile only. |
Application and Derivation
Mapping forest aboveground biomass is essential for understanding, monitoring, and managing forest carbon stocks toward climate change mitigation. This dataset provides estimates of Aboveground dry woody Biomass Density (AGBD) for high northern latitude forests at a 30-m spatial resolution, and was designed both for boreal-wide mapping, and filling the northern spatial data gap from NASA’s Global Ecosystem Dynamics Investigation (GEDI).
Quality Assessment
The product is comprised of a set of 90-km tiles, and each tile has a set of iteratively resampled OLS models (field to ICESat-2) and random forest models (ICESat-2 to covariate stack). Pixel-level standard deviation (SD) was produced by bootstrapping both models, and creating a new AGBD map for each iteration. Iterations were repeated until the 90-km SD of tile total AGB changed less than 5% when adding a new set of 10 iterations. The pixel-level SD is calculated as the SD of the set of pixel predictions from these iterations.
Data Acquisition, Materials, and Methods
Aboveground dry woody Biomass Density (AGBD) was estimated at 30-m resolution for high latitude northern forests, representative of circa 2020 conditions. This product was generated using field data, ICESat-2, Harmonized Landsat Sentinel-2, Copernicus DEM and ESA Worldcover. The spatial coverage is the boreal forest of the northern hemisphere and southward to 44 latitude for areas supporting boreal forests.
AGBD was estimated based on two modeling steps: 1) Ordinary Least Squares (OLS) regression related field plot measurements of AGBD to NASA's ICESat-2 30-m lidar samples, and 2) random forest models were used to extend estimates beyond the field plots by relating ICESat-2 AGBD predictions to wall-to-wall covariate stacks from Harmonized Landsat Sentinel-2 (HLS) and the Copernicus DEM. Per-pixel uncertainties (SD) are estimated from bootstrapping both models. Non-vegetated areas (e.g. built up, water, rock, ice) were masked out. HLS composites and ICESat-2 data were from 2019-2021. Three years of conditions were aggregated into the circa 2020 map.
ICESat-2 data were filtered to include only strong beams, growing seasons (June through September), solar elevations less than 5 degrees, snow free land (snow flag set to 1), and msw_flag equal to 0 (clear skies and no observed atmospheric scattering). ICESat-2’s ATL08 product was resampled to a 30-m spatial resolution to better match both the field plots and mapped pixels. HLS data (L30HLS) were used to create a greenest pixel composite of growing season multispectral data, which was then used to compute a suite of vegetation indices: NDVI, NDWI, NBR, NBR2, TCW, TCG. These were then used, in combination with the slope and elevation data from the Copernicus DEM product, to predict 30-m AGBD per 90-km tile.
This product was generated on the NASA-ESA Multi-Mission Algorithm and Analysis Platform (MAAP, scimaap.net), an open science platform. All code and input files are publicly available: https://repo.ops.maap-project.org/icesat2_boreal/icesat2_boreal.git
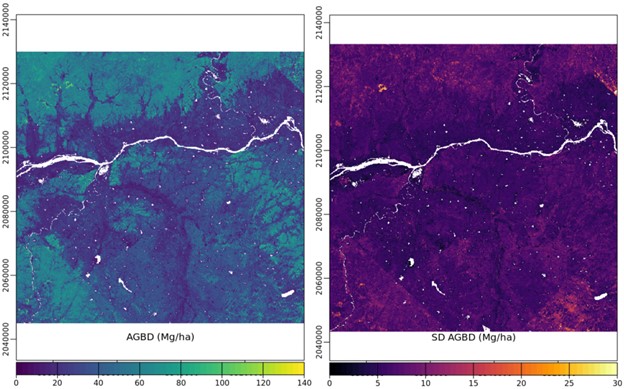
Figure 2. Example 90-km tile of mean aboveground forest biomass (left) and standard deviation (right) estimated from ICESat2 imagery.
Data Access
These data are available through the Oak Ridge National Laboratory (ORNL) Distributed Active Archive Center (DAAC).
Aboveground Biomass Density for High Latitude Forests from ICESat-2, 2020
Contact for Data Center Access Information:
- E-mail: uso@daac.ornl.gov
- Telephone: +1 (865) 241-3952