Documentation Revision Date: 2018-12-31
Data Set Version: 1
Summary
There are three data files provided with this dataset in comma-separated (.csv) format.
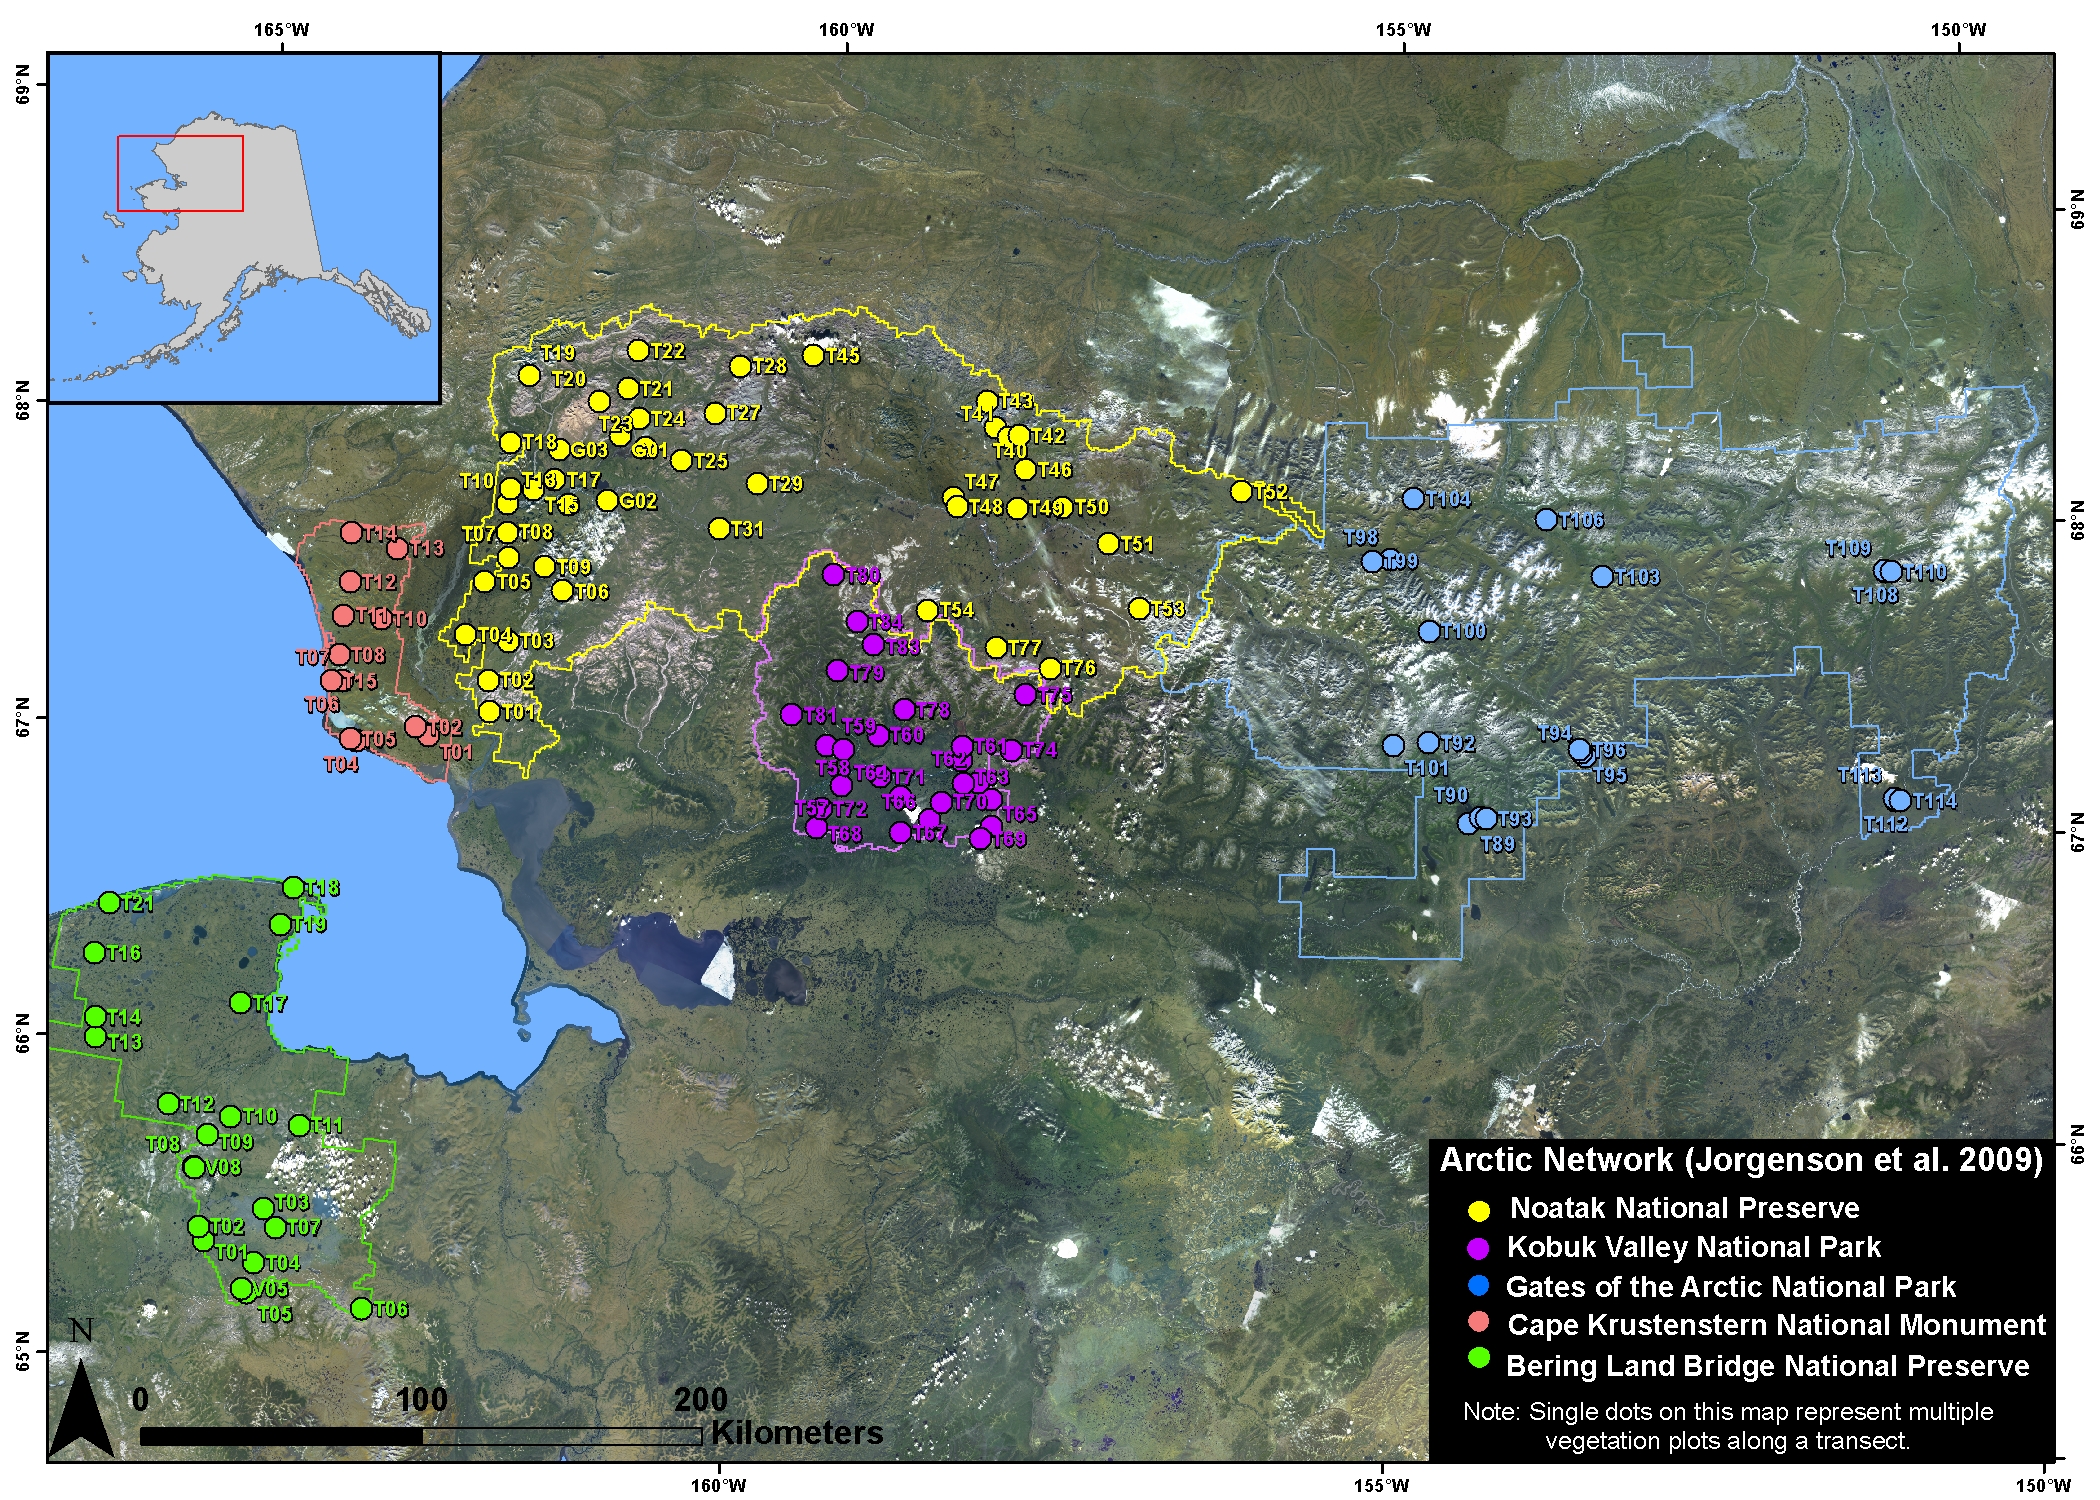
Figure 1. Map of locations of the vegetation plots in the five ARCN parks and preserves. Single dots on the map represent multiple vegetation plots along transects. The transect number adjacent to the dot can be linked to the field plot number. Map courtesy of the Alaska Arctic Geoecological Atlas.
Citation
Jorgenson, M.T. 2018. Arctic Vegetation Plots in NPS Arctic Network Parks, Alaska, 2002-2008. ORNL DAAC, Oak Ridge, Tennessee, USA. https://doi.org/10.3334/ORNLDAAC/1542
Table of Contents
- Data Set Overview
- Data Characteristics
- Application and Derivation
- Quality Assessment
- Data Acquisition, Materials, and Methods
- Data Access
- References
Data Set Overview
This dataset provides environmental, soil, and vegetation data collected at selected locations in the parks and preserves of the National Park Service (NPS) Arctic Network (ARCN) between 2002 and 2008. The ARCN includes five national parks and preserves in northern Alaska encompassing 19.5 million acres and represents some of the wildest, most undisturbed areas left on earth: The Bering Land Bridge National Preserve, Cape Krusenstern National Monument, Gates of the Arctic National Park and Preserve, Kobuk Valley National Park, and the Noatak National Preserve. The sampling sites were chosen to represent the full range of vegetation in the area with replication, and for uniformity in floristic composition and environmental conditions and were positioned on transects along toposequences within major physiographic units (riverine, lacustrine, lowland, upland, subalpine and alpine). Specific attributes include dominant vegetation, species, and cover, soil chemistry, physical characteristics, moisture, and organic matter, as well as site disturbance from various sources.
Vegetation composition and structure were assessed semi-quantitatively. Total cover of each plant growth form (e.g.,tall shrub, dwarf shrub, lichens) was estimated independently of the cover estimates for individual species. Geologic and surface-form variables recorded include physiography, surface geomorphic unit, slope, aspect, surface form, and height of microrelief. For all plots, the dominant mineral texture, the depth of surface organic matter, cumulative thickness of all organic horizons, depth to rock (>15% by volume), and depth of thaw were recorded. Soils from a selected subset of plots were sampled, classified, and analyzed for a wide range of parameters in a laboratory.
The Pre-ABoVE vegetation plot datasets were curated to create the Alaska Arctic Vegetation Archive (AVA-AK; Walker et al. 2016b, Walker 2013). The AVA-AK is a regional database that is part of the larger Arctic Vegetation Archive (Walker 2016a, Walker et al. 2013, Walker and Raynolds 2011). The database contains vegetation plots from homogeneous plant communities with tables of cover or cover-abundance scores for all species and accompanying environmental site data. Field data were collected using Braun-Blanquet, US National Vegetation Classification protocols, or comparable methods.
Project: Arctic-Boreal Vulnerability Experiment (ABoVE)
The Arctic-Boreal Vulnerability Experiment (ABoVE) iis a NASA Terrestrial Ecology Program field campaign that will take place in Alaska and western Canada between 2016 and 2021. Climate change in the Arctic and Boreal region is unfolding faster than anywhere else on Earth. ABoVE seeks a better understanding of the vulnerability and resilience of ecosystems and society to this changing environment.
Acknowledgements:
The study was accomplished over an eight-year period (2002-2009) by ABR Inc. Environmental and Research and Services. The objective of the project was to provide maps and data for resource managers to evaluate land resources and develop management strategies that are appropriate to the landscape. Funding for the project was provided by the U.S. Department of Interior, National Park Service.
These data files were edited by Donald A. Walker, Amy L. Breen and Lisa A. Druckenmiller at the University of Alaska Fairbanks' Alaska Geobotany Center and obtained via the Arctic Geoecological Atlas (http://arcticatlas.geobotany.org/), which provides access to existing Arctic vegetation plot and map data in support of the ABoVE campaign.
Data Characteristics
Spatial Coverage: Bering Land Bridge National Preserve (BELA), Cape Krusenstern National Monument (CAKR), Gates of the Arctic National Park (GAAR), Kobuk Valley National Park (KOVA), and Noatak National Preserve (NOAT).
Spatial Resolution: Point
Temporal Coverage: 2002-07-10 to 2008-08-10 (CAKR and BELA were sampled during 2002–2003. Field surveys were done in NOAT in 2005–2006, KOVA in 2007, and GAAR in 2008.)
Temporal Resolution: One-time sampling at each site during the peak of annual growing season.
Study Area (All latitude and longitude given in decimal degrees)
| Site | Westernmost Longitude | Easternmost Longitude | Northernmost Latitude | Southernmost Latitude |
|---|---|---|---|---|
| Five parks in Alaska above the Arctic Circle | -165.323 | -150.839 | 68.49017 | 65.27672 |
Data File Information
There are three data files in comma-separated format (.csv) with this dataset. The files provide vegetation, plot characterization, and soil characterization data. Where the unit/format is listed as "code" refer to the companion file jorgensont_2009_envlegend.pdf.
Table 1. Data files and descriptions
| Data File Name | Description |
|---|---|
| arctic_network_environmental_data.csv | Plot environmental characterization data |
| arctic_network_species_data.csv | Plot species cover data in comma separated (.csv) format. Both the author's determination and the current taxonomy according to the Panarctic Species List (PASL) are provided |
| arctic_network_soil_data.csv | Soil data from 39 selected plots |
Table 2. Variables in the file arctic_network_environmental_data.csv
Missing or not measured values have been set to -9999 for numeric data or NA for alphanumeric or categorical data.
| Column number | Variable | Units/format | Description |
|---|---|---|---|
| 1 | field_plot_number |
Field plot number. The field plot numbers follow the pattern: location_transect_plot_year Where: Location:
Transect number (e.g., T01, T110) Example: BELA_T01_02_2002 |
|
| 2 | date | yyyymmdd | Date plot was investigated |
| 3 | location | Plot location: Bering Land Bridge National Preserve, Cape Krusenstern National Monument, Gates of the Arctic National Park, Kobuk Valley National Park, Noatak National Preserve | |
| 4 | transect_number | Transect number | |
| 5 | latitude | decimal degrees | Plot latitude (NAD83) |
| 6 | longitude | decimal degrees | Plot longitude (NAD83) |
| 7 | geographic_landmark | Geographic landmark at site | |
| 8 | elevation | m | Elevation in meters |
| 9 | plot_radius | m | Plot radius, usually 10-m |
| 10 | plot_size | m2 | Plot size |
| 11 | site_physiography |
Physiography of the site (alpine, upland, lowland, lacustrine (ponded), riverine, coastal) |
|
| 12 | slope | degrees | Slope of plot |
| 13 | aspect | degrees | Aspect-degrees or too flat to determine |
| 14 | surface_geomorphology_unit | code | Surficial geology-parent material |
| 15 | subsurface_geomorphology_unit | code | Surficial geomorphology |
| 16 | macrotopography | Macrotopography, classified according to a system modified from that of Schoeneberger et al.(1998) | |
| 17 | microtopography | Microtopography classified according to the periglacial system of Washburn (1973) | |
| 18 | microrelief | cm | Microrelief |
| 19 | water_regime | USFWS, National Wetlands Inventory | |
| 20 | water_depth | cm | Depths before reaching water where negative values are below the surface and positive values are above the surface |
| 21 | saturated_less_than_30cm | Saturated less than 30 cm | |
| 22 | drainage | Description of drainage | |
| 23 | soil_moisture | Soil moisture description -- moist, wet, dry, aquatic. D.A. Walker used soil moisture in conjunction with plant communities to infer site moisture | |
| 24 | lowest_mottle_depth | cm | Depth to mottled soil |
| 25 | low_matrix_depth | cm | Low matrix depth |
| 26 | hydric_soil | Hydric soil (yes or no) | |
| 27 | water_ph | Water pH | |
| 28 | water_conductivity | microsiemens | Water conductivity |
| 29 | soil_ph_10cm | Soil pH at 10 cm. (0.1 units from paste) | |
| 30 | soil_ph_30cm | code | Soil pH at 30 cm (0.1 units from paste) |
| 31 | soil_conductivity | MICROSIEMENS per CM | Soil conductivity |
| 32 | site_ph | A single measure of pH for a site. It is either (in priority from highest to lowest) equal to the water_ph, soil_ph_10, or soil_ph_30 depending on which data we have available for pH. | |
| 33 | site_conductivity | microsiemens | Site-soil conductivity |
| 34 | site_chemistry | code | Site-soil chemistry |
| 35 | thaw_depth | cm | Thaw depth |
| 36 | permafrost | Permafrost-yes, no, or NA | |
| 37 | top_organic_layer_depth | cm | Depth of the top organic layer |
| 38 | cumulative_organic_layers | cm | Total organic layers in 40 cm |
| 39 | dominant_mineral_texture_top_40cm | Dominant mineral texture in the top 40 cm of soil | |
| 40 | loess_thickness | cm | Eolian silt thickness |
| 41 | root_depth | cm | Rooting depth |
| 42 | surface_fragment_cover | % | Percent with surface fragment cover |
| 43 | frost_boils | % | Percent of plot with frost boils |
| 44 | rock_depth | cm | Depth of rock |
| 45 | cryoturbation | Cryoturbation (yes, no, or unknown) | |
| 46 | soil_stratigraphy | Soil stratigraphy (yes or no) | |
| 47 | soil_sample | Soil sample (yes or no) | |
| 48 | soil_plug_probe_max_depth | cm | Maximum depth of the soil probe |
| 49 | soil_sampling_method | Soil sampling method: pit, plug, surface, probe, etc | |
| 50 | soil_class | Soil class (NRCS, 2003) | |
| 51 | soil_association | Soil association | |
| 52 | veg_class | code | Vegetation generally was classified in the field to Level IV of the Alaska Vegetation Classification (AVC) developed by Viereck et al. (1992). Additionally, plant associations were classified and named according to standard methods (Vegetation Subcommittee 2008, Jennings et al. 2009). |
| 53 | ecotype_veg_structure | code | Ecotype associated with the vegetation. Refer to section 5 of this document for a description as to how these were derived. |
| 54 | disturbance | code | Plot disturbance |
| 55 | field_floristic_class | Field floristic class | |
| 56 | final_floristic_class | Final floristic class | |
| 57 | plot_ecotype |
Ecotype at plot. Refer to section 5 of this document for a description as to how these were derived, and also to the companion file jorgensont_2009_ecosurvey.pdf |
|
| 58 | dominant_plants | Dominant plants at the plot | |
| 59 | ecotype_analysis | Indicates if an ecotype analysis was performed to reduce the number of ecotype classes (yes or no) | |
| 60 | environ_outliers | Plots with unusual ecosystem associations (components, geomorphic units, soil properties, drainage, etc.). Associations either were lumped with those having similar characteristics or excluded as atypical (outliers). The values are yes or no or a remark | |
| 61 | veg_outlier | Plots with unusual ecosystem associations (components, veg structure, plant associations, etc.). Associations either were lumped with those having similar characteristics or excluded as atypical (outliers). The values are yes or no or a remark | |
| 62 | geomorphology_data_review | Indicates if the geomorphology data were reviewed (yes or no) | |
| 63 | ecotype_rare | Indicates if the ecotype at the plot was rare (yes or no) | |
| 64 | veg_sampling_quality | code | Vegetation sampling quality |
| 65 | ecotype_abbrev | Abbreviated name of ecotype | |
| 66 | map_ecotype_arctic_network_nps | Ecotype on the Arctic Network NPS map | |
| 67 | map_ecotype_abbrev_arctic_network_nps | Ecotype name abbreviated on the Arctic Network NPS map | |
| 68 | map_veg_arctic_network_nps | Vegetation on the Arctic Network NPS map | |
| 69 | soil_landscape_description | Description of landscape associated with the plots where soil samples were taken | |
| 70 | cover_needleleaf_trees | % | Percent of plot covered with needle leaf trees |
| 71 | needleleaf_tree_crown_class | Needle leaf tree crown classes: O-OVERTOPPING, D-DOMINANT, C-CODOMINANT, I-INTERMEDIATE, U-UNDERSTORY | |
| 72 | cover_broadleaf_trees | % | Percent of plot covered with broadleaf trees |
| 73 | broadleaf_tree_crown_class | Broadleaf tree crown classes: O-OVERTOPPING, D-DOMINANT, C-CODOMINANT, I-INTERMEDIATE, U-UNDERSTORY | |
| 74 | cover_dwarf_broadleaf | % | Percent of plot covered with dwarf broadleaf |
| 75 | dwarf_broadleaf_crown_class | Dwarf Broadleaf crown classes: O-OVERTOPPING, D-DOMINANT, C-CODOMINANT, I-INTERMEDIATE, U-UNDERSTORY | |
| 76 | cover_dwarf_needleleaf | % | Percent of plot covered with dwarf needleleaf |
| 77 | dwarf_needleleaf_crown_class | Dwarf Needleleaf crown classes: O-OVERTOPPING, D-DOMINANT, C-CODOMINANT, I-INTERMEDIATE, U-UNDERSTORY | |
| 78 | cover_standing_dead_trees | % | Percent of plot covered with standing dead trees |
| 79 | cover_tall_shrubs | % | Percent of plot covered with tall shrubs |
| 80 | cover_low_shrubs | % | Percent of plot covered with low shrubs |
| 81 | cover_dwarf_shrubs | % | Percent of plot covered with dwarf shrubs |
| 82 | cover_ graminoids | % | Percent of plot covered with graminoids |
| 83 | cover_tussocks | % | Percent of plot covered with tussocks |
| 84 | cover_forbs | % | Percent of plot covered with forbs |
| 85 | cover_moss | % | Percent of plot covered with moss |
| 86 | cover_lichens | % | Percent of plot covered with lichen |
| 87 | cover_litter | % | Percent of plot covered with litter |
| 88 | cover_litter_alone | % | Percent of plot area lacking overtopping vegetation |
| 89 | cover_bare_soil | % | Percent of plot covered with bare soil |
| 90 | cover_water | % | Percent of plot covered with water |
| 91 | notes | % | Percent of plot covered with prostrate dwarf shrubs. live/standing dead |
| 92 | field_notes | % | Percent of plot covered with evergreen shrubs, live/standing dead |
| 93 | observer_environ_data | Observer of environmental data | |
| 94 | observer_veg_data | Observer of vegetation data | |
| 95 | office_notes | Office notes | |
| 96 | data_origin | Origin of data |
Table 3. Variables in the file arctic_network_species_data.csv
Missing or not measured values have been set to -9999 for numeric data or NA for alphanumeric or categorical data.
| Column number | Column header | Description |
|---|---|---|
| 1 | PASL_taxon_scientific_name | Current nomenclature according to the Panarctic Species List (PASL) |
| 2 | PASL_taxon_scientific_name_author | Current nomenclature according to the Panarctic Species List (PASL) with the data authors name |
| 3 | dataset_taxon | Dataset taxonomy |
| 4-292 | TURBOVEG_plot_accession_number and dataset_plot_number_author | Two rows of column headers which are plot numbers/accession numbers. The first row is TURBOVEG accession numbers 11686-12621. The 2nd row is dataset_plot_number_author; the plot numbers as named in the original dataset by the abbreviated site name, transect number, plot number, and date. Species cover classes are by percent. If cover was <10% or >90%, then cover of each species was visually estimated to the nearest 1%; for cover of 10–90%, it was estimated to the nearest 5%. Isolated individuals or species with very low cover were assigned a cover value of 0.1% |
Table 4. Variables in the file arctic_network_soil_data.csv
Missing or not measured values have been set to -9999 for numeric data or NA for alphanumeric or categorical data.
| Column number | Variable | Units/format | Description |
|---|---|---|---|
| 1 | field_plot_number | Plot number. As described for environmental data. | |
| 2 | rock_type | Rock type | |
| 3 | general_geology | General geology | |
| 4 | electrical_conductivity | Electrical conductivity of soil | |
| 5 | lime_estimate | Estimated lime content | |
| 6 | extractable_no3 | ppm | Nitrate content provided in parts per million, extracted with AB-DTPA |
| 7 | extractable_p | ppm | Phosphorus content provided in parts per million, extracted with AB-DTPA |
| 8 | extractable_k | ppm | Potassium content provided in parts per million, extracted with AB-DTPA |
| 9 | extractable_zn | ppm | Zinc content provided in parts per million, extracted with AB-DTPA |
| 10 | extractable_fe | ppm | Iron content provided in parts per million, extracted with AB-DTPA |
| 11 | extractable_mn | ppm | Manganese content provided in parts per million, extracted with AB-DTPA |
| 12 | extractable_cu | ppm | Copper content provided in parts per million, extracted with AB-DTPA |
| 13 | si | % | Silicon content provided as a percent |
| 14 | organic_matter | % | Soil organic matter provided as a percent |
| 15 | total_ca | % | Total calcium provided as a percent |
| 16 | total_mg | % | Total magnesium provided as a percent |
| 17 | total_na | % | Total sodium provided as a percent |
| 18 | total_k | % | Total potassium provided as a percent |
| 19 | total_p | % | Total phosphorus provided as a percent |
| 20 | total_al | % | Total aluminum provided as a percent |
| 21 | total_fe | % | Total iron provided as a percent |
| 22 | total_mn | % | Total manganese provided in mg/kg |
| 23 | total_ti | % | Total titanium provided as a percent |
| 24 | total_cu | mg per kg | Total copper provided in mg/kg |
| 25 | total_zn | mg per kg | Total zinc provided in mg/kg |
| 26 | total_ni | mg per kg | Total nickel provided in mg/kg |
| 27 | total_mo | mg per kg | Total molybdenum provided in mg/kg |
| 28 | total_cd | mg per kg | Total cadmium provided in mg/kg |
| 29 | total_cr | mg per kg | Total chromium provided in mg/kg |
| 30 | total_sr | mg per kg | Total strontium provided in mg/kg |
| 31 | total_b | mg per kg | Total boron provided in mg/kg |
| 32 | total_ba | mg per kg | Total barium provided in mg/kg |
| 33 | total_be | mg per kg | Total beryllium provided in mg/kg |
| 34 | total_cu | mg per kg | Total copper provided in mg/kg |
| 35 | total_pb | mg per kg | Total lead provided in mg/kg |
| 36 | total_v | mg per kg | Total vanadium provided in mg/kg |
| 37 | total_se | mg per kg | Total selenium provided in mg/kg |
| 38 | total_s | mg per kg | Total sulfur provided in mg/kg |
| 39 | n | % | Nitrogen content provided as a percent |
| 40 | c | % | Carbon content provided as a percent |
| 41 | caco3 | % | Calcium carbonate content provided as a percent |
| 42 | So4-s | mg per kg | Sulfur content (in sulfate) provided in mg/kg |
| 43 | sand | % | Percent sand |
| 44 | silt | % | Percent silt |
| 45 | clay | % | Percent clay |
| 46 | texture | Soil texture |
Companion Files
Table 5. Companion files and descriptions
| Data File Name | Description |
|---|---|
| jorgensont_2009_envlegend.pdf | Codes and descriptions used in the data files. Reformatted and with additional codes from Jorgenson et al, (2009) |
| jorgensont_2009_ecosurvey.pdf | Full report of the study (Jorgenson et al, 2009). Note that this report provides information in addition to the methods which pertain to the data provided with this dataset |
| Arctic_Network_Veg_plots.pdf | A PDF of this guide document |
Application and Derivation
This data can be used to provide maps and data for resource managers to allow them to evaluate land resources and develop management strategies that are appropriate to the landscape.
Quality Assessment
No specific quality assessment information provided.
Data Acquisition, Materials, and Methods
Site Descriptions
Vegetation sampling for an ecological land survey classification at selected locations in the parks and preserves of the National Park Service (NPS) Arctic Network (ARCN) was completed from 2002-2008. Intensive sampling was done along toposequences (transects) located within major physiographic units, including riverine, lacustrine, lowland, upland, subalpine and alpine areas using the ecological subsection mapping for the ARCN (Swanson 2001, Jorgenson 2001, Jorgenson et al. 2002). The sites included the five national parks and preserves in northern Alaska encompassing 19.5 million acres and represents some of the wildest, most undisturbed areas left on earth. Initial ecological surveys and mapping were done for CAKR and BELA during 2002–2003 (Jorgenson et al. 2004). Subsequent field surveys were done in NOAT during 2005–2006, KOVA in 2007, and GAAR in 2008. A total of 936 plots were sampled. The five sites are described below:
Cape Krusenstern (79 plots): A cape on the northwestern coast of Alaska near the village of Kivalina, north of the Arctic Circle.
The Bering Land Bridge National Preserve (129 plots): The Preserve is located on the Seward Peninsula in northwest Alaska; it is a remnant of the land bridge that connected Asia with North America more than 13,000 years ago.
Gates of the Arctic National Park and Preserve (170 plots): This park is the northernmost national park in the U.S. and lies north of the Arctic Circle and primarily consists of portions of the Brooks Range.
Kobuk Valley National Park (200 plots): This park is located in northwestern Alaska, 25 miles (40 km) north of the Arctic Circle. The park is known for caribou migration routes and the eolian sand dunes.
Noatak National Preserve (358 plots): A Preserve in northwestern Alaska above the Arctic Circle. The preserve extends westward from Gates of the Arctic National Park along the Brooks Range to the north and the Baird Mountains to the south, enclosing the valley of the Noatak River. It is bordered to the north by the National Petroleum Reserve–Alaska. The lower valley of the Noatak is not part of the preserve, separating the preserve from Cape Krusenstern National Monument on the coast. The preserve includes the transition zone from boreal forest to tundra near the southern edge of the preserve.
Methods
Vegetation and plot characteristics
Data were collected at 936 plots along 91 toposequences. Along each transect, 1–20 plots were sampled, each in a distinct vegetation type or spectral signature identifiable on aerial photographs. All sample locations were located on aerial photographs and coordinates (including approximate elevations) were obtained with a Global Positioning System (GPS) receiver (accuracy ±15 m). At each plot (~10-m radius), descriptions or measurements of geology, hydrology, soil stratigraphy, soil chemistry and vegetation structure and cover were recorded.
Vegetation generally was classified in the field to Level IV of the Alaska Vegetation Classification (AVC) developed by Viereck et al. (1992). Additionally, plant associations were classified and named according to standard methods (Vegetation Subcommittee 2008, Jennings et al. 2009).
Vegetation composition and structure were assessed semi-quantitatively. If cover was <10% or >90%, then cover of each species was visually estimated to the nearest 1%; for cover of 10–90%, it was estimated to the nearest 5%. Isolated individuals or species with very low cover were assigned a cover value of 0.1%. A species list was compiled that included most vascular plants and the dominant nonvascular plants observed in the plot.
Total cover of each plant growth form (e.g.,tall shrub, dwarf shrub, lichens) was estimated independently of the cover estimates for individual species. Data were cross-checked to ensure that the summed cover of individual species within a growth form category was comparable to the total cover estimated for that growth form. Taxonomic nomenclature is based on Viereck & Little (1972) for trees and shrubs, and Hultén (1968) for all other taxa, with references to currently accepted synonyms throughout the text. Floristic data compiled by the park for guidance (Parker 2006) was also used. Unknown dominant vascular species were identified by Dave Murray and Carolyn Parker, University of Alaska Museum of the North Herbarium (ALA), Fairbanks. Nomenclature for bryophytes and lichens followed the USDA PLANTS National Database (USDA 2008). Identification of mosses and lichens during field sampling was limited to dominant, readily identifiable species. Dominant cryptogams that could not be identified in the field were collected and sent to Mikhail Zhurbenko and Olga Afonina, Komarov Botanical Institute, Russia, for identification (Jorgenson et al., 2009).
Hydrologic variables measured at each sampling site included depth of water above or below ground surface, depth to saturated soil, pH, and electrical conductivity (EC). Water quality measurements (pH and EC) were made with Oakton or Cole-Palmer portable meters that were calibrated daily with standard solutions.
Geomorphology
Previous landscape analysis of northern Alaska (Jorgenson et al., 2002) were relied on as a guide to our identification of geomorphic and geologic units. Materials near the surface (<2 m) were emphasized because they have the greatest influence on ecological processes.Geologic and surface-form variables recorded include physiography, surface geomorphic unit, slope, aspect, surface form, and height of microrelief.
Surface forms (macrotopography) were classified according to a system modified from that of Schoeneberger et al. (1998). Microtopography was classified according to the periglacial system of Geomorphic units were assigned to physiographic settings based on their erosional or depositional processes. Surface-forms were aggregated into a reduced set of slope elements (crest, upper slope, lower slope, toe, and flat).
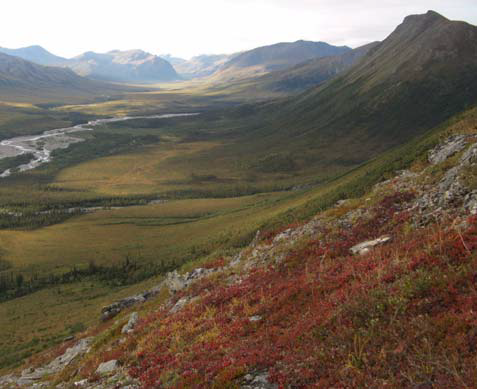
Figure 2. Geomorphology: Alpine Ericaceous–Dryas Dwarf Shrub. Dryas Dwarf Shrub can be found on hillside colluvium, older moraine, talus, weathered bedrock and abandoned alluvial fan deposits above 450 m elevation throughout ARCN. Macrotopography includes slopes, shoulders and crests (Jorgenson et al., 2009).
Ecotypes
Classification of ecotypes was accomplished in three general steps:
(1) the ecological components were individually classified for each detailed ground description,
(2) relationships along transects were examined to illustrate trends across the landscape, and
(3) contingency tables were used to identify the common relationships and central tendencies among ecological components. In developing the ecotype classes, ecological characteristics (primarily geomorphology and vegetation structure) that could be interpreted from aerial photographs were emphasized. Also a nomenclature for ecotypes that describes ecological characteristics (climate, physiography, soil chemistry, moisture, vegetation structure, and dominant species) was developed using a terminology that can be easily understood (Jorgenson et al, 2009).
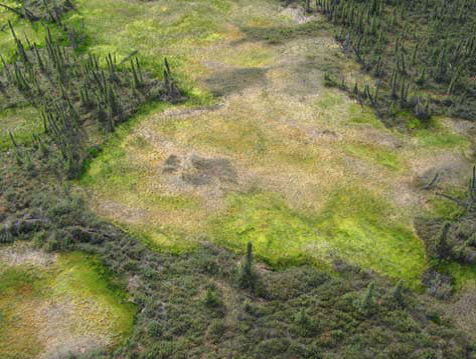
Figure 3. Ecotype: Lowland Ericaceous Shrub Bog. This ecotype occurs in bogs, including collapse scar and undifferentiated bogs, and in the ice-rich centers of drained-lake basins, ice-poor thaw basin margins, and on abandoned meander overbank deposits (Jorgenson et al., 2009).
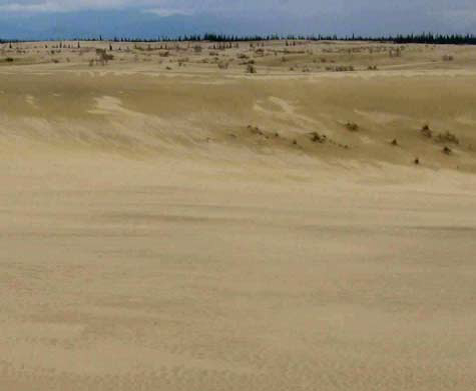
Figure 4. Upland Sandy Barrens encompasses the active portions of the Great Kobuk Sand Dunes, Little Kobuk Sand Dunes and isolated smaller exposed dunes in ARCN. These eolian active sand dunes are found at < 100 m elevation (Jorgenson et al., 2009).
Soils
Soils were classified to the soil subgroup level according to NRCS soil taxonomy, Ninth Edition (NRCS 2003). When data needed for the taxonomic keys were not available, a best guess was used when assigning classes. For example, it was difficult to determine if permafrost was present in rocky soils. Consequently, permafrost was assumed to be present in alpine environments assuming mean annual air temperatures were low. Similarly, differentiating eutrocryepts from dystrocryepts was based on a cutpoint of 5.5 for the pH reaction, although the actual diagnostic criteria is based on a cutpoint of 60% base saturation from laboratory analyses.
To assess differences in bedrock chemistry, soils were collected from the C horizon at 39 sites and sent to the Soil, Plant and Water Testing Laboratory at Colorado State University, Boulder, Co for analysis.
Soil stratigraphy was described from a shallow soil core or soil pit at each plot. Most soil profiles were limited to the seasonally thawed layer (~0.5–1 m) above the permafrost and were described from soil plugs dug with a shovel. For all plots, the dominant mineral texture, the depth of surface organic matter, cumulative thickness of all organic horizons, depth to rock (>15% by volume), and depth of thaw were recorded. When water was not present, EC and pH were measured from a saturated soil paste. A single simplified texture (i.e., loamy, sandy, organic) was assigned to characterize the dominant texture in the top 40 cm at each plot for ecotype classification.
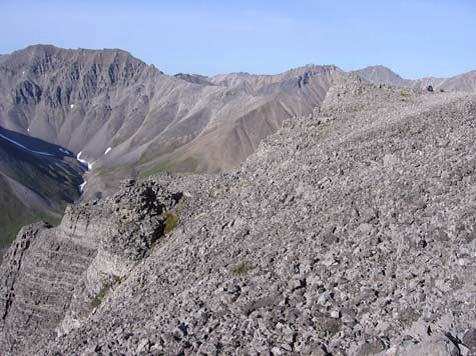
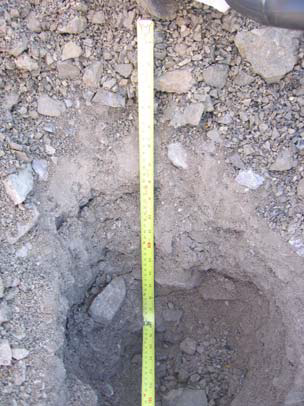
Figure 5. Top image is geomorphology Alpine Alkaline Barrens which occurs at elevations above 400 m through ARCN. The associated soils (bottom image) are blocky or rubbly and typically lack a surface organic horizon. The dominant soils in this ecotype are Typic Gelorthents (poorly developed soils, permafrost below 1 m) and Typic Eutrogelepts (non-acidic, partially developed with permafrost below 1 m) (Jorgenson et al., 2009).
Ecosystem Outliers
Common relationships among ecosystem components were identified by use of contingency tables. The contingency tables sorted plots by physiography, soil texture, geomorphic unit, slope position, drainage, soil chemistry (pH and salinity), vegetation structure, and plant association. From these tables, common associations were identified and unusual associations either were lumped with those having similar characteristics or excluded as atypical (outliers). A contingency table analysis was used to evaluate how well these general relationships conformed to the dataset, and how reliably they could be used to extrapolate trends across the landscape. During development of the relationships, outliers were excluded from the table because of inconsistencies among physiography, texture, geomorphology, drainage, soil chemistry, and vegetation. Refer to the companion file jorgensont_2009_ecosurvey.pdf for additional details regarding the contingency analysis.
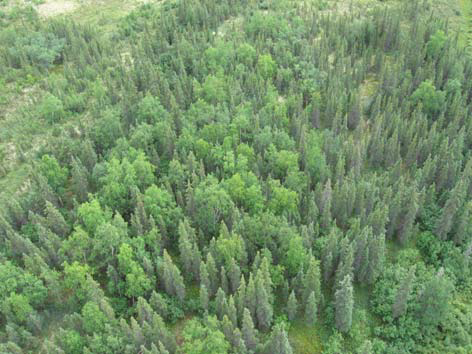
Figure 6. Upland Spruce-Birch forest. These mixed forests are uncommon and occur on hillside colluvium, eolian inactive sand deposits, older moraine and older till within the boreal forest zone in KOVA and GAAR. Surfaces are always sloped, and rock outcrops are frequently present (Jorgenson et al., 2009).
This dataset was edited by Dr. Amy Breen and Lisa Druckenmiller and provided by the GINA repository at http:// geobotanical.portal.gina.alaska.edu/catalogs/10184-alaska-arctic- vegetation-archive-arctic-network
Data Access
These data are available through the Oak Ridge National Laboratory (ORNL) Distributed Active Archive Center (DAAC).
Arctic Vegetation Plots in NPS Arctic Network Parks, Alaska, 2002-2008
Contact for Data Center Access Information:
- E-mail: uso@daac.ornl.gov
- Telephone: +1 (865) 241-3952
References
Hultén, E. 1968. Flora of Alaska and neighboring territories. Stanford University Press, Stanford, CA. 1,008 pp.
Jennings, M.D., D. Faber-Langendoen, O.L. Loucks, R.K. Peet, and D. Roberts. 2009. Standards for associations and alliances of the U.S. national vegetation classification. Ecological Monographs 79: 173–199.
Jorgenson, M.T., J.E. Roth, P.F. Miller, M.J. Macander, M.S. Duffy, A.F. Wells, G.V. Frost, and E.R. Pullman. An ecological land survey and landcover map of the Arctic Network. Natural Resource Technical Report NPS/ARCN/NRTR—2009/270. National Park Service, Fort Collins, Colorado.
Jorgenson, M. T., J. E. Roth, M. Emers, W. Davis, S. F. Schlentner, and M. J. Macander. 2004. Landcover mapping for Bering Land Bridge National Preserve and Cape Krusenstern National Monument, northwestern Alaska. Natural Resource Technical Report NPS/ARCN/NRTR—2004/001. National Park Service, Fort Collins, Colorado. D-41. 129 pp.
Jorgenson, M.T, D.K. Swanson, and M. Macander. 2002. Landscape-level mapping of ecological units for the Noatak National Preserve, Alaska. Final Rep. prepared for National Park Service, Anchorage, AK, by ABR,Inc., Fairbanks, AK. 54 pp.
Jorgenson, M.T. 2001. Landscape-level mapping of ecological units for the Bering Land Bridge National Preserve. Final Rep. Produced for National Park Service, Anchorage, AK by ABR, Inc., Fairbanks, AK. 45 pp.
Natural Resource Conservation Service (NRCS). 2003. Keys to soil taxonomy. Ninth Edition. Washington, D.C., U.S. Department of Agriculture.
Parker, C.L. 2006. Vascular plant inventory of Alaska’s arctic national parklands; Bering Land Bridge NP, Cape Krusenstern NM, Gates of the Arctic NPP, Kobuk Valley NP, and Noatak NP. Tech. Rep. NPS/AKRARCN/NRTR-2006/01. 142 pp.
Schoeneberger, P.L., P.A. Wysocki, E.C. Benham, and W.D. Broderson. 1998. Fieldbook for describing and sampling soils. National Soil Survey Center, Natural Resource Conservation Service, U.S. Dept. of Agriculture, Lincoln, NE.
Swanson, D. K. 2001. Ecological units of Cape Krusenstern National Monument, Alaska. Fairbanks, AK: National Park Service.
United States Department of Agriculture (USDA). 2008. The PLANTS database. National Plant Data Center, Baton Rouge, LA. (http://plants.usda.gov).
Viereck, L. A., C.T. Dyrness, A. R. Batten, and K.J. Wenzlick. 1992. The Alaska vegetation classification. Pacific Northwest Research Station, U.S. Forest Service, Portland, OR. Gen. Tech. Rep. PNW-GTR-286. 278 pp.
Viereck, L.A., and E.L. Little. 1972. Alaska trees and shrubs. U.S. Government Printing Office, Washington, D.C.
Washburn, A.L. 1973. Periglacial processes and environments. Edward Arnold, London. 320 pp. Watt, A.S. 1947. pattern and process in the plant community. Journal of Ecology 35:1–22