Documentation Revision Date: 2024-03-18
Dataset Version: 2
Summary
There are 21 data files in cloud-optimized GeoTIFF format with this dataset.
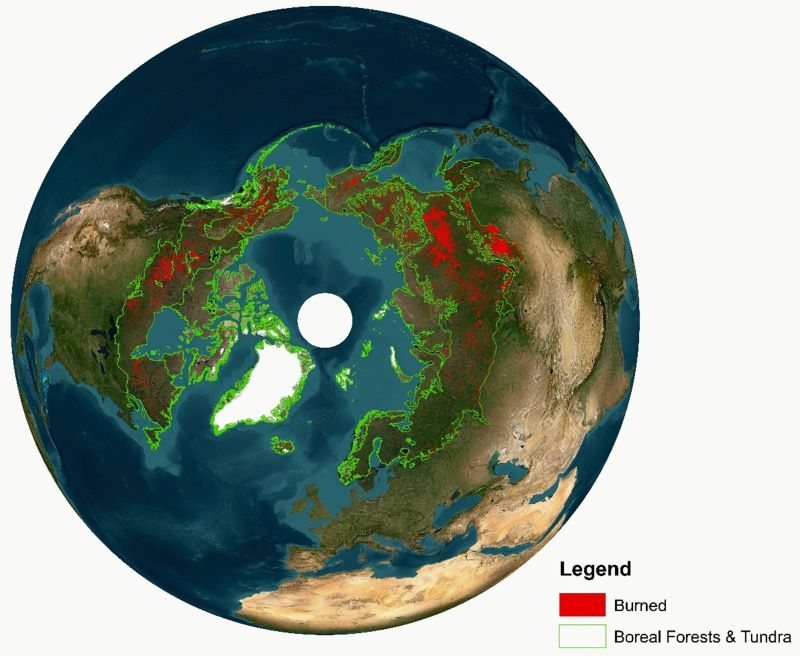
Figure 1. The distribution of burned areas between 2002 and 2022 as mapped by ABBA V2.
Citation
Loboda, T.V., J.V. Hall, D. Chen, A. Hoffman-Hall, V.S. Shevade, F. Argueta, and X. Liang. 2024. Arctic Boreal Annual Burned Area, Circumpolar Boreal Forest and Tundra, V2, 2002-2022. ORNL DAAC, Oak Ridge, Tennessee, USA. https://doi.org/10.3334/ORNLDAAC/2328
Table of Contents
- Dataset Overview
- Data Characteristics
- Application and Derivation
- Quality Assessment
- Data Acquisition, Materials, and Methods
- Data Access
- References
- Dataset Revisions
Dataset Overview
This dataset provides annual cumulative end-of-season burned area in circumpolar boreal forests and tundra for the years 2002-2022. The data were generated using the Arctic Boreal Burned Area (ABBA) version 2 algorithm with MODIS collection 6 products. The algorithm is based on Normalized Burned Ratio differencing (dNBR) and is designed specifically to capture late season fires. The annual MODIS Vegetation Continuous Fields (VCF) 250-m Collection 5.1 (MOD44B) product allowed for additional vegetation-dependent dNBR thresholds within the algorithm's processing steps. The spatial domain is circumpolar regions above 50 degrees north latitude. The data are provided in cloud-optimized GeoTIFF format with 463-m resolution.
This dataset is version 2 of the Arctic Boreal Burned Area (ABBA) product. The first version was released as Loboda et al. (2017).
Project: Arctic-Boreal Vulnerability Experiment
The Arctic-Boreal Vulnerability Experiment (ABoVE) is a NASA Terrestrial Ecology Program field campaign taking place in Alaska and western Canada between 2016 and 2021. Climate change in the Arctic and Boreal region is unfolding faster than anywhere else on Earth. ABoVE seeks a better understanding of the vulnerability and resilience of ecosystems and society to this changing environment.
Related Dataset:
Loboda, T.V., J.V. Hall, A.H. Hall, and V.S. Shevade. 2017. ABoVE: Cumulative Annual Burned Area, Circumpolar High Northern Latitudes, 2001-2015. ORNL DAAC, Oak Ridge, Tennessee, USA. https://doi.org/10.3334/ORNLDAAC/1526
- The first version of this ABBA data product.
Acknowledgement:
This study was supported by NASA's Arctic-Boreal Vulnerability Experiment (grant NNX13AK44G).
Data Characteristics
Data Characteristics
Spatial Coverage: High northern latitudes (circumpolar above 50 degrees N)
ABoVE Reference Locations
Domain: Core and Extended ABoVE Regions
Spatial Resolution: 463 m
Temporal Coverage: 2002 to 2022
Temporal Resolution: Annual
Study Area (All latitude and longitude given in decimal degrees)
| Site | Westernmost Longitude | Easternmost Longitude | Northernmost Latitude | Southernmost Latitude |
|---|---|---|---|---|
| Circumpolar above 50°N | -179.522 | 177.157 | 83.626 | 50* |
* User Note: The area of interest is land areas above 50 degrees north latitude; however, the GeoTIFF files extend south below the equator due to sinusoidal projection employed.
Data file information
There are 21 data files in cloud-optimized GeoTIFF format with this dataset. The data are annual cumulative end-of-season burned area in circumpolar boreal forests and tundra for the years 2002-2022.
The file naming convention is ABBA_<year>_C61_HNL.tif, where <year> = indicates the year.
GeoTIFF details:
- Coordinate reference system: MODIS sinusoidal projection,
PROJ4: "+proj=sinu +lon_0=0 +x_0=0 +y_0=0 +a=6371007.181 +b=6371007.181 +units=m +no_def " - 41,013 rows x 55,877 columns
- Spatial resolution (pixel size): 463 m
- Pixel values: 1 = occurrence of burning within the pixel during the nominal year. 0 = absence of burning or nodata.
- Map units: meter
Application and Derivation
These data could be of use to fire management, fire mapping, and land use/land cover change studies.
Quality Assessment
Quality assessment was not performed for these version 2 data. However, the text below describes an uncertainty analysis conducted on version 1 of this data product (Loboda et al., 2017).
An intercomparison of burned area (km2) between the ABBA product, MODIS MCD64A1 Collection 6 Burned Area product (Giglio, 2015), and fire perimeter data obtained from the Alaska Interagency Coordination Center (AICC) and the Natural Resources Canada (NRC) was carried out to assess the performance of the ABBA algorithm. Yearly comparisons between the mapped burned area from ABBA and MCD64A1 and the fire perimeters were undertaken between 2001 and 2014. Results (refer to Table 1; Fig 2 has an example for 2014) indicate that while area burned estimates from both MODIS-based products show strong statistical relationships with the estimates from the auxiliary burned area perimeters, ABBA estimates match the AICC and NRC estimates much more closely and with a greater consistency over the entire time period. Only estimates from the 2001 fire season diverge from this general pattern with very poor estimates delivered by the MODIS-based products. The poor performance during the 2001 season was mostly due to the fact that the MODIS instrument was turned off for substantial periods of time during the growing season. While the instrument was off, no active fire detections were acquired and since those represent an integral part for both ABBA and MCD64A1 products, even larger scars detectable on the surface later during the growing season were not reliably mapped.
Table 1. Intercomparison between ABBA and MCD64A1 burned area products (2001 – 2014) and the AICC and NRC fire perimeter datasets. Small fire years (annual cumulative area < 10,000 km2 are denoted with *) and large fire years (annual cumulative area ≥ 10,000 km2 are denoted with ** ).
| Year | Cumulative Fire Database Area (km2) | ABBA R2 (slope) | MCD64A1 R2 (slope) |
|---|---|---|---|
| 2001* | 2009 | -0.175 (-0.01) | 0.747 (0.17) |
| 2002* | 9074 | 0.975 (0.97) | 0.842 (0.66) |
| 2003* | 4044 | 0.998 (1.04) | 0.975 (0.62) |
| 2004 ** | 49362 | 0.997 (0.96) | 0.981 (0.71) |
| 2005 ** | 22915 | 0.993 (1.04) | 0.979 (0.73) |
| 2006* | 2578 | 0.977 (0.87) | 0.738 (0.40) |
| 2007* | 7448 | 0.984 (0.91) | 0.947 (0.60) |
| 2008* | 4669 | 0.982 (0.92) | 0.982 (0.79) |
| 2009 ** | 14248 | 0.997 (0.99) | 0.970 (0.57) |
| 2010* | 9618 | 0.980 (0.85) | 0.689 (0.25) |
| 2011* | 4631 | 0.985 (0.95) | 0.907 (0.49) |
| 2012* | 4721 | 0.962 (0.87) | 0.872 (0.61) |
| 2013 ** | 11760 | 0.986 (0.94) | 0.813 (0.45) |
| 2014 ** | 36423 | 0.999 (0.94) | 0.991 (0.66) |
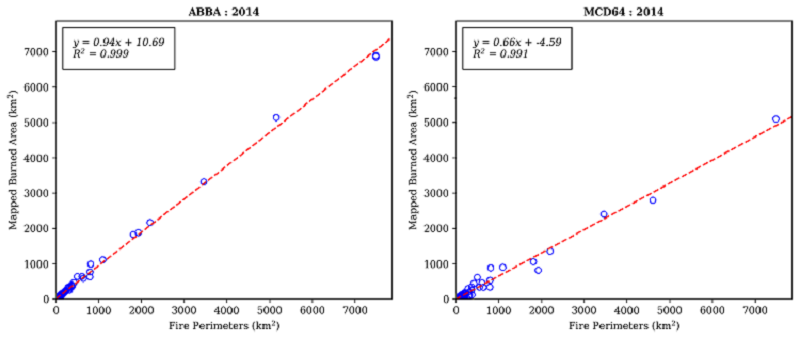
Figure 2. 2014 burned area (km2) comparison between the fire perimeters from AICC and NRC and the ABBA V1 (left) and MCD64A1 (right) burned area products. ABBA V1 mapped an additional 298 km2 of cumulative burned area (non-overlapping the AICC and NRC fire perimeters), while MCD64A1 mapped an additional 523 km2. These values were excluded from the analysis.
Data Acquisition, Materials, and Methods
Annual maps of the cumulative end-of-season burned area in the circumpolar high northern latitudes (HNL) above 50 degrees North were developed using the Arctic Boreal Burned Area (ABBA) version 2 algorithm with MODIS collection 6 products for the years 2002-2022.
The ABBA algorithm is based on dNBR and is designed specifically to capture late season fires. The algorithm inputs the MODIS Surface Reflectance 8-Day Composite product (MOD09A1; Vermote, 2015), the MODIS Active Fire product (MOD14ML; Giglio, 2015), the MODIS Vegetation Continuous Fields (VCF) 250 m Collection 5.1 (MOD44B; Hansen et al., 2003) product and the MODIS 250 m land-water mask (MOD44W; Carroll et al., 2009). The algorithm development follows the methodology published in Loboda et al. (2007) and Loboda et al. (2011).
Table 2. Summary of data products used in the study.
| Satellite-based fire monitoring programs and products | Purpose |
|---|---|
| MODIS active fire detections (MCD14ML) Collection 6 (Giglio, 2015) | Assessment of observed fire activity (fire location). This is a change introduced to the inputs for the burned area production since the publication of the algorithm (Loboda et al., 2007 and 2011) |
| MODIS 8-day Level 3 500m MOD09A1 Surface Reflectance Collection 6 (Vermote, 2015) | Used to create surface reflectance composites for dNBR. This is a change introduced to the inputs for the burned area production since the publication of the algorithm (Loboda et al., 2007 and 2011) |
| MODIS 250 m land-water mask (MOD44W; Carroll et al., 2009) | Used for the identification of water bodies. Only larger water bodies with a minimum area of ~ 21ha (~ 53 ac) – corresponding to four 231.65 m grid cells – were mapped as water. Due to the preponderance of very small waterbodies in the HNL, a relaxed aggregation rule was used to reduce the omission of large amounts of land area and thus reduce the patchy appearance of burn scars. This is a change introduced to the inputs for the burned area production since the publication of the algorithm (Loboda et al., 2007 and 2011) |
| MODIS Vegetation Continuous Fields (VCF) 250 m Collection 5.1 (MOD44B; Hansen et al., 2003) | Allowed for additional vegetation-dependent dNBR thresholds within the algorithm’s processing steps |
| AICC and the Natural Resources Canada (NRC) fire perimeters | Used to assess reported burned area estimates per individual fire scar (2001 – 2015) |
ABBA algorithm modifications and methodology
In order to optimize the mapping accuracy of the ABBA algorithm, the original Loboda et al. (2007) methodology was modified to include pre-season and post-season spring composites:
- First, burned areas were mapped following the original methodology of Loboda et al. (2007). This methodology is based on semi-automated processing of standard MODIS land products into burned area maps using information about changes in surface reflectance due to fire and the record of fire activity. The algorithm ingests the MODIS 500m 8-day surface reflectance composites (MOD09A1) collected during the year of interest and the year before, masks out poor-quality data using MOD09A1 quality bits, and produces 8-day dNBR grids.
- A set of vegetation-dependent dNBR thresholds was then developed by an analyst to reflect ecosystem-specific changes in surface reflectance due to fire. These masks of potential burning, created by separating the dNBR grids into ‘potentially burned’ and ‘unburned’ categories, were further compared with the observed fire activity recorded by the MODIS active fire detections (Giglio et al., 2003) to eliminate instances of surface reflectance change due to reasons other than fire. At this stage, two thresholds are set for active fire detections included in the analysis: (1) the area threshold that defines a minimum of active fires detections per unit burned area, and (2) the temporal threshold, which is defined by the longevity of a burn scar, the possible length of a fire-event occurrence, and the possible length of a period of persistent cloud cover impeding surface observations.
- The resultant 8-day burn masks were merged into an end-of season burned area product.
Regional dNBR thresholds and updates to define burned area pixels
With the changes introduced in the MODIS Collection 6, new updates to acceptability of pixels for burned area mapping were defined. Regional dNBR thresholds were established at 0.25 and 0.2 for areas with tree cover >10% and ≤10% respectively. MODIS pixels with values above those thresholds were considered potentially burned. The potentially burned pixels were further compared with the active fire detection to ensure that the observed change in surface reflectance occurred owing to burning. The active fire detection thresholds, designed to limit the selection of appropriate samples of active fires from the MODIS active fire product, were set at three times the area mapped by active fires for the area threshold and 64 days before the date of the given composite for the temporal threshold. For a more complete description of threshold identification, see Loboda et al. (2007).
Spring composites
The spring composite was automatically created from the MODIS 8-day composite files acquired during late April–May (composite Julian Dates (JD) 121–153) to develop a pre-fire season clear surface view. Analysis of active fire detections showed that few fires occurred during this time and they were easily separated from the fire scars of the previous year. The JD 153 MODIS 8-day composite was then modified using the information contained in the quality layer to mask out pixels of low quality. The masked-out pixels from the base composite were filled with acceptable-quality pixels from the composite of the previous date (JD 8). The process was repeated until the JD reached 121, the cut-off date based on snow-melt trajectories, after which the remaining poor-quality pixels were permanently masked out.
Visual analysis of multiyear burned area mapping using the original regional burned area algorithm showed that new burn scars were frequently found to be adjacent to the burns from the previous year. To eliminate the potential confusion in the year of burning, a pre-fire season spring composite was created to exclude previously burned areas. MOD09A1 composites between JD 121 and 153 were combined in a single clear surface pre-burn composite for year i and year i-1 with preferential selection of later dates in the compositing time-window. The subsequent processing included analysis of three spring composites: the spring pre-fire season composite (year i), the spring post-fire season composite of the following year (year i+1), and the spring pre-fire-season composite of the previous year (year i-1). dNBR images were calculated for composites from (1) year i-1 and year i, and (2) year i and year i+1. The dNBR images were further processed using the regional thresholds and using cumulative fire detections from the previous year for the pre-fire season dNBR composite and from the current fire season for the post-fire dNBR composite. The resultant burned area masks from the post-fire season were merged with the burns mapped using the original algorithm. Finally, the pre-fire season masks were erased from the resultant product.
For a more complete description of methods, see Loboda et al. (2011).
Data Access
These data are available through the Oak Ridge National Laboratory (ORNL) Distributed Active Archive Center (DAAC).
Arctic Boreal Annual Burned Area, Circumpolar Boreal Forest and Tundra, V2, 2002-2022
Contact for Data Center Access Information:
- E-mail: uso@daac.ornl.gov
- Telephone: +1 (865) 241-3952
References
Carroll, M.L., J.R. Townshend, C.M. DiMiceli, P. Noojipady, and R.A. Sohlberg. 2009. A new global raster water mask at 250 m resolution. International Journal of Digital Earth 2:291–308. https://doi.org/10.1080/17538940902951401
Giglio, L. 2015. MODIS Collection 6 Active Fire Product User’s Guide Revision A. Unpublished manuscript, Department of Geographical Sciences, University of Maryland. https://cdn.earthdata.nasa.gov/conduit/upload/3865/MODIS_C6_Fire_User_Guide_A.pdf
Giglio, L., J. Descloitres, C.O. Justice, and Y.J. Kaufman. 2003. An Enhanced Contextual Fire Detection Algorithm for MODIS. Remote Sensing of Environment 87:273-282. https://doi.org/10.1016/S0034-4257(03)00184-6
Hansen, M.C., R.S. DeFries, J.R. G. Townshend, M. Carroll, C. Dimiceli, and R.A. Sohlberg. 2003. Global percent tree cover at a spatial resolution of 500 meters: first results of the MODIS Vegetation Continuous Fields algorithm. Earth Interactions 7:1-15. https://doi.org/10.1175/1087-3562(2003)007%3C0001:GPTCAA%3E2.0.CO;2
Loboda, T.V., J.V. Hall, A.H. Hall, and V.S. Shevade. 2017. ABoVE: Cumulative Annual Burned Area, Circumpolar High Northern Latitudes, 2001-2015. ORNL DAAC, Oak Ridge, Tennessee, USA. https://doi.org/10.3334/ORNLDAAC/1526
Loboda, T.V., E.E. Hoy, L. Giglio, and E.S. Kasischke. 2011. Mapping burned area in Alaska using MODIS data: a data limitations-driven modification to the regional burned area algorithm. International Journal of Wildland Fire 20:487-496. https://doi.org/10.1071/WF10017
Loboda, T., K.J. O’Neal, and I. Csiszar. 2007. Regionally adaptable dNBR-based algorithm for burned area mapping from MODIS data. Remote Sensing of Environment 109:429–442. https://doi.org/10.1016/j.rse.2007.01.017
Vermote, E. 2015. MOD09A1 MODIS/Terra Surface Reflectance 8-Day L3 Global 500m SIN Grid V006. NASA EOSDIS Land Processes Distributed Active Archive Center. https://doi.org/10.5067/modis/mod09a1.006
Dataset Revisions
| Version | Release Date | Revision Notes |
|---|---|---|
| 2.0 | 2024-03-18 | Release of data developed using the Arctic Boreal Burned Area (ABBA) version 2 algorithm for 2002-2022 |
| 1.0 | 2017-09-20 | Initial release of the ABBA V1 dataset for 2001-2015: https://doi.org/10.3334/ORNLDAAC/1526 |