Documentation Revision Date: 2019-11-06
Dataset Version: 1
Summary
The seasonality data were derived from a Landsat phenology algorithm (LPA) used to estimate the long-term averages and the annual day of year (DOY). Peak-summer greenness was derived from both Landsat 5 TM and Landsat 7 Enhanced ETM+ data to calculated NDVI values at each pixel for each growing season.
There are 8,788 data files in this dataset in GeoTIFF (.tif) format. Seasonality: 8 variables x 169 tiles = 1,352 files. Peak greenness: TM, 28 years x 169 tiles = 4,732 files; ETM+, 16 years x 169 tiles = 2,704 files.
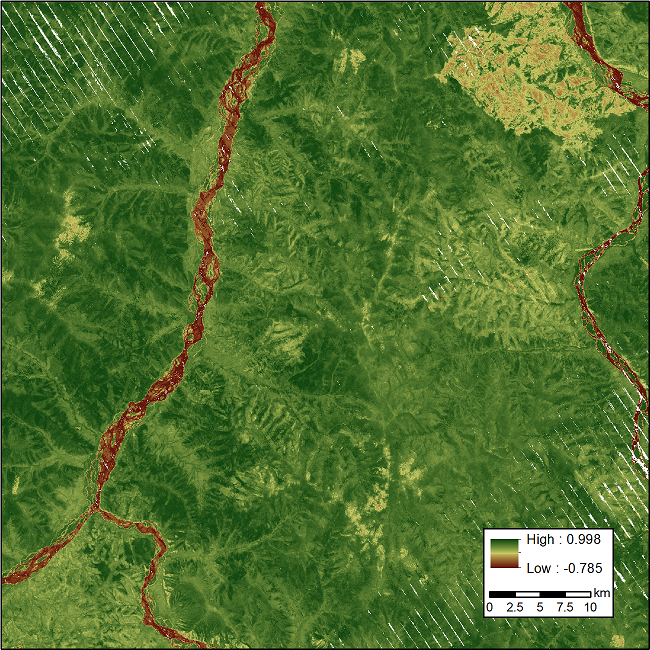
Figure 1. Peak greenness derived from the Normalized Difference Vegetation Index (NDVI) for the year 2010 (Band1) in the ABoVE grid cell Bh07v07. Source Bh07v07.pkgreen.etm.2010.tif.
Citation
Melaas, E.K., D. Sulla-Menashe, C.E. Woodcock, and M.A. Friedl. 2019. ABoVE: Annual Phenology Derived from Landsat across the ABoVE Core Domain, 1984-2014. ORNL DAAC, Oak Ridge, Tennessee, USA. https://doi.org/10.3334/ORNLDAAC/1698
Table of Contents
- Dataset Overview
- Data Characteristics
- Application and Derivation
- Quality Assessment
- Data Acquisition, Materials, and Methods
- Data Access
- References
Dataset Overview
This dataset provides annual maps of the timing of spring onset with leaf emergence, of autumn onset with leaf senescence, and of peak greenness for each 30 m pixel derived from Landsat time series of Thematic Mapper (TM) and Enhanced Thematic Mapper (ETM+) observations from 1984 to 2014. The Core Domain includes 169 ABoVE grid tiles across Alaska, USA and Alberta, British Columbia, Northwest Territories, Nunavut, Saskatchewan and Yukon, Canada. The data provided for deriving seasonality includes the total number of cloud-free observations, R2 between observed and spline-predicted Enhanced Vegetation Index (EVI), long-term average minimum EVI, long-term average maximum EVI, long-term average spring onset, long-term average autumn onset, annual spring onset, and annual autumn onset. The data provided for peak greenness includes annual peak Normalized Difference Vegetation Index (NDVI), Normalized Burn Ratio (NBR), annual composite red reflectance, annual composite NIR reflectance, annual composite shortwave infrared reflectance (band 6, SWIR1), annual composite shortwave infrared reflectance (band 7, SWIR2), number of dates used to calculate composites, and day of year of associated maximum composite.
The seasonality data were derived from a Landsat phenology algorithm (LPA) used to estimate the long-term averages and the annual day of year (DOY). Peak-summer greenness was derived from both Landsat 5 TM and Landsat 7 Enhanced ETM+ data to calculated NDVI values at each pixel for each growing season.
Project: Arctic-Boreal Vulnerability Experiment
The Arctic-Boreal Vulnerability Experiment (ABoVE) is a NASA Terrestrial Ecology Program field campaign based in Alaska and western Canada between 2016 and 2021. Research for ABoVE links field-based, process-level studies with geospatial data products derived from airborne and satellite sensors, providing a foundation for improving the analysis and modeling capabilities needed to understand and predict ecosystem responses and societal implications.
Related Datasets:
The datasets below used the same algorithm to detect annual seasonality metrics:
Melaas, E.K., M.A. Friedl, and D. Sulla-Menashe. 2018. Landsat-derived Spring and Autumn Phenology, Eastern US - Canadian Forests, 1984-2013. ORNL DAAC, Oak Ridge, Tennessee, USA. https://doi.org/10.3334/ORNLDAAC/1570
Sulla-Menashe, D., M.A. Friedl, C. Woodcock, and E.K. Melaas. 2018. ABoVE: Peak Greenness for Canadian Boreal Forest from Landsat 5 TM Imagery, 1984-2011. ORNL DAAC, Oak Ridge, Tennessee, USA. https://doi.org/10.3334/ORNLDAAC/1587
Related Publications:
Melaas, E. K., M. A. Fridel, and D. Sulla-Menashe. 2018. Multidecadal Changes and Interannual Variation in Springtime Phenology of North American Temperate and Boreal Deciduous Forests. Geophysical Research Letters. https://doi.org/10.1002/2017GL076933
Melaas, E. K., Sulla-Menashe, D., Gray, J. M., Black, T. A., Morin, T. H., Richardson, A. D., & Friedl, M. A. (2016). Multisite analysis of land surface phenology in North American temperate and boreal deciduous forests from Landsat. Remote Sensing of Environment, 186, 452–464. https://doi.org/10.1016/j.rse.2016.09.014
Acknowledgements:
This study was funded with NASA grant number NNX15AU63A.
Data Characteristics
Spatial Coverage: Alaska, USA and Alberta, British Columbia, Northwest Territories, Nunavut, Saskatchewan and Yukon, Canada
ABoVE Reference Locations:
Domain: Core ABoVE
State/territory: Alaska and Canada
Grid cells: The data are in ‘A’ grid cells Ah0Av0, Ah1Av0, Ah1Av2, Ah2Av0, Ah2Av1, Ah2Av2 and the following ‘B' cells:
|
Bh01v02 |
Bh05v05 |
Bh08v02 |
Bh09v14 |
Bh11v14 |
Bh13v12 |
Bh15v14 |
|
Bh01v03 |
Bh05v06 |
Bh08v03 |
Bh09v15 |
Bh11v15 |
Bh13v13 |
Bh15v15 |
|
Bh01v04 |
Bh06v00 |
Bh08v04 |
Bh10v04 |
Bh11v16 |
Bh13v14 |
Bh16v05 |
|
Bh01v05 |
Bh06v01 |
Bh08v05 |
Bh10v05 |
Bh11v17 |
Bh13v15 |
Bh16v06 |
|
Bh02v02 |
Bh06v02 |
Bh08v06 |
Bh10v06 |
Bh12v05 |
Bh13v16 |
Bh16v07 |
|
Bh02v03 |
Bh06v03 |
Bh08v07 |
Bh10v07 |
Bh12v06 |
Bh14v05 |
Bh16v08 |
|
Bh02v04 |
Bh06v04 |
Bh08v08 |
Bh10v08 |
Bh12v07 |
Bh14v06 |
Bh16v09 |
|
Bh02v05 |
Bh06v05 |
Bh08v09 |
Bh10v09 |
Bh12v08 |
Bh14v07 |
Bh16v10 |
|
Bh02v06 |
Bh06v06 |
Bh08v10 |
Bh10v10 |
Bh12v09 |
Bh14v08 |
Bh16v11 |
|
Bh03v01 |
Bh06v07 |
Bh08v11 |
Bh10v11 |
Bh12v10 |
Bh14v09 |
Bh16v12 |
|
Bh03v02 |
Bh06v08 |
Bh08v12 |
Bh10v12 |
Bh12v11 |
Bh14v10 |
Bh16v13 |
|
Bh03v03 |
Bh06v09 |
Bh08v13 |
Bh10v13 |
Bh12v12 |
Bh14v11 |
Bh16v14 |
|
Bh03v04 |
Bh07v00 |
Bh08v14 |
Bh10v14 |
Bh12v13 |
Bh14v12 |
Bh17v05 |
|
Bh03v05 |
Bh07v01 |
Bh09v02 |
Bh10v15 |
Bh12v14 |
Bh14v13 |
Bh17v06 |
|
Bh03v06 |
Bh07v02 |
Bh09v03 |
Bh10v16 |
Bh12v15 |
Bh14v14 |
Bh17v07 |
|
Bh04v01 |
Bh07v03 |
Bh09v04 |
Bh10v17 |
Bh12v16 |
Bh14v15 |
Bh17v08 |
|
Bh04v02 |
Bh07v04 |
Bh09v05 |
Bh11v05 |
Bh13v03 |
Bh15v05 |
Bh17v09 |
|
Bh04v03 |
Bh07v05 |
Bh09v06 |
Bh11v06 |
Bh13v04 |
Bh15v06 |
Bh17v10 |
|
Bh04v04 |
Bh07v06 |
Bh09v07 |
Bh11v07 |
Bh13v05 |
Bh15v07 |
Bh17v11 |
|
Bh04v05 |
Bh07v07 |
Bh09v08 |
Bh11v08 |
Bh13v06 |
Bh15v08 |
Bh17v12 |
|
Bh05v00 |
Bh07v08 |
Bh09v09 |
Bh11v09 |
Bh13v07 |
Bh15v09 |
|
|
Bh05v01 |
Bh07v09 |
Bh09v10 |
Bh11v10 |
Bh13v08 |
Bh15v10 |
|
|
Bh05v02 |
Bh07v10 |
Bh09v11 |
Bh11v11 |
Bh13v09 |
Bh15v11 |
|
|
Bh05v03 |
Bh08v01 |
Bh09v12 |
Bh11v12 |
Bh13v10 |
Bh15v12 |
|
|
Bh05v04 |
Bh08v02 |
Bh09v13 |
Bh11v13 |
Bh13v11 |
Bh15v13 |
Spatial Resolution: 30 m x 30 m
Temporal Coverage: 1984-01-01 to 2014-12-31
Temporal Resolution: Annual
Study Areas (All latitude and longitude given in decimal degrees)
|
Site |
Westernmost Longitude |
Easternmost Longitude |
Northernmost Latitude |
Southernmost Latitude |
|---|---|---|---|---|
|
Alaska and Alberta, British Columbia, Northwest Territories, Nunavut, Saskatchewan and Yukon, Canada |
-170.0058 |
-98.97401389 |
75.01385833 |
50.25900556 |
Data File Information
There are 8,788 data files in this dataset in GeoTIFF (.tif) format. Seasonality: 8 variables x 169 tiles = 1,352 files. Peak greenness: TM, 28 years x 169 tiles = 4,732 files; ETM+: 16 years x 169 tiles = 2,704 files.
The files are organized by data product type:
- Seasonality: phenology (pheno) variables estimated using the Landsat phenology algorithm (LPA)
- Peak greenness (pkgreen) derived from NDVI
Missing values: Indicated with -32767. Any missing data denotes that either phenology or peak greenness dates were undetectable due to missing or poor quality Landsat imagery during the greenup, greendown or peak summer periods when dates are typically detected.
Projection: EPSG 102001 (ABoVE standard Alber’s equal area projection)
Seasonality data
Each file has 31 bands, one for each of the 31 years (1984-2014). In summary, 8 variables x 169 tiles = 1,352 files.
The files are named as Bh#v#.pheno.NAME.tif
Where:
Bh#v# is the ABoVE "B" grid tile designation. There are 169 tiles reported.
NAME is the variable reported in the file. It can be one of the following:
- nobs - total number of clear observations
- rsquare - coefficient of determination (R2) between observed and spline-predicted EVI
- minEVI - long-term average winter minimum EVI
- maxEVI - long-term average summer maximum EVI
- sprLTM - long-term average spring onset (day of year)
- autLTM - long-term average autumn onset (day of year)
- spr - annual spring onset (day of year)
- aut - annual autumn onset (day of year)
Example file name: Bh01v02.pheno.minEVI.tif
Peak Greenness data
Data are provided for both TM and ETM+ sensors with some overlapping years [TM (1984 to 2011) and ETM+ (1999 to 2014)]. In summary, TM has 28 years x 169 tiles = 4,732 files and ETM+ has 16 years x 169 tiles = 2,704 files.
The files are named as Bh#v#.pkgreen.SSS.YYYY.tif
Where:
Bh#v# is the ABoVE "B" grid tile designation. There are 169 tiles reported.
SSS is the sensor used: tm5 for Landsat 5 TM and etm for Landsat 7 ETM+
YYYY is the year
Example file name: Bh14v12.pkgreen.tm5.1995.tif
Each file has 8 bands:
- Annual peak NDVI magnitude
- Annual NBR magnitude
- Associated red reflectance (band 3) magnitude
- Associated near infrared reflectance (band 4) magnitude
- Associated shortwave infrared reflectance (band 6) magnitude
- Associated shortwave infrared reflectance (band 7) magnitude
- Number of observations used to generate composite (of the above)
- Associated day of year of composite
Application and Derivation
The vegetation trends and disturbance data included in this dataset are useful for characterizing the nature and magnitude of greening and browning directly associated with climate change.
Results from this work support the utility of land surface phenology information derived from Landsat for improving information and understanding of ecosystem processes at landscape scales.
Quality Assessment
The assessment and validation of remotely sensed estimates of phenology dates with the Landsat phenology algorithm (LPA) was reported in Melaas et al. (2016).
Data Acquisition, Materials, and Methods
Study Area
The study domain covered parts of Alaska and Canada in the ABoVE Core Domain.
Seasonality data
The Landsat phenology algorithm (LPA) described by Melaas et al. (2013) and subsequently refined and validated in Melaas et al. (2016) was used to estimate the long-term average and the annual day of year (DOY) associated with leaf emergence (spring onset) and autumn senescence (autumn onset) at 30-m spatial resolution from time series of Landsat 5 and 7 images. Average spring onset and autumn onset were estimated using the LPA at each pixel based on the day of year when the cubic smoothing spline reached 50% of its amplitude (Melaas et al., 2016).
Peak Greenness data
For each site, 28 years (1984 to 2011) of Landsat 5 Thematic Mapper (TM) data and 16 years of Landsat 7 Enhanced Thematic Mapper (ETM+) data (1999 to 2014) were collected and the maximum greenness observations for each Landsat pixel for that year were identified. Two indices were calculated from the peak-summer greenness observations for vegetated pixels, the Normalized Difference Vegetation Index (NDVI) and the Normalized Burn Ratio (NBR). We then extracted maximum NDVI values at each pixel for each growing season, which we define here as occurring between day of year 180 and 240 (June 29–August 28 in non-leap years) (Sulla-Menashe et al 2018).
The Landsat 5 and 7 data were previously stored in HDF format in the WRS2 path/row system in UTM projection. Taking these files as inputs, the tiles were reprojected and each scene was tiled into the ABoVE standard Alber’s equal projection and 30-m grid.
Data Access
These data are available through the Oak Ridge National Laboratory (ORNL) Distributed Active Archive Center (DAAC).
ABoVE: Annual Phenology Derived from Landsat across the ABoVE Core Domain, 1984-2014
Contact for Data Center Access Information:
- E-mail: uso@daac.ornl.gov
- Telephone: +1 (865) 241-3952
References
Melaas, E.K., M.A. Fridel, and D. Sulla-Menashe. 2018. Multidecadal Changes and Interannual Variation in Springtime Phenology of North American Temperate and Boreal Deciduous Forests. Geophysical Research Letters. https://doi.org/10.1002/2017GL076933
Melaas, E.K., D. Sulla-Menashe, J.M. Gray, T.A. Black, T.H. Morin, A.D. Richardson, and M.A. Friedl. 2016. Multisite analysis of land surface phenology in North American temperate and boreal deciduous forests from Landsat. Remote Sensing of Environment, 186, 452–464. https://doi.org/10.1016/j.rse.2016.09.014
Melaas, E.K., M.A. Friedl, and Z. Zhu. 2013. Detecting interannual variation in deciduous broadleaf forest phenology using Landsat TM/ETM + data. Remote Sensing of Environment, 132, 176–185. https://doi.org/10.1016/j.rse.2013.01.011
Sulla-Menashe, D., C.E. Woodcock, and M.A. Friedl. 2018. Canadian boreal forest greening and browning trends: an analysis of biogeographic patterns and the relative roles of disturbance versus climate drivers. Environmental Research Letters, 13(1): 014007. https://dx.doi.org/10.1088/1748-9326/aa9b88