Documentation Revision Date: 2024-01-18
Dataset Version: 2
Summary
The data was collected by a NASA ABoVE team to study the impact of alder shrub expansion into graminoid tundra in interior Alaska, specifically changes in soil carbon storage and permafrost state. Alder expansion was quantified by combining dendrochronology with an assessment of remote sensing products related to vegetation type and productivity and fire history. Permafrost state was assessed by measuring thaw depth in late August (a proxy for active layer thickness) with a tile probe. Soil properties (horizons, depth to permafrost or parent material, C and N stock) were assessed by collecting soil samples that were analyzed in the laboratory for bulk properties. Soil moisture and conductivity was measured in the field.
The dataset includes two files: a file in comma-separated values (CSV) format holding the data and a field photograph in JPEG image format.
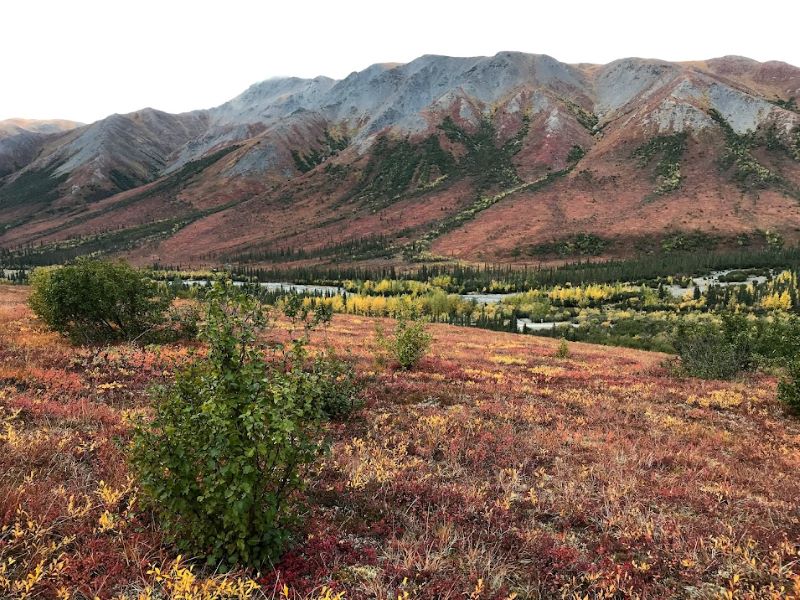
Figure 1. Alder shrubs expanding into graminoid tundra. Coldfoot Valley, Alaska. 2019.
Citation
Pedron, S., A. Welch, R.G. Jespersen, Xiaomei Xu, B. Martinez, Y. Khazindar, N. Fiore, M.L. Goulden, and C.I. Czimczik. 2023. ABoVE: Alder Shrub Cover and Soil Properties, Alaska, 2019, V2. ORNL DAAC, Oak Ridge, Tennessee, USA. https://doi.org/10.3334/ORNLDAAC/2300
Table of Contents
- Dataset Overview
- Data Characteristics
- Application and Derivation
- Quality Assessment
- Data Acquisition, Materials, and Methods
- Data Access
- References
- Dataset Revisions
Dataset Overview
This dataset holds measures of vegetative cover and soil characteristics for sites in interior Alaska, U.S., along the James W. Dalton Highway (Alaska Route 11). The field data were collected during August in 2018 and 2019 to study the expansion of shrub cover, particularly alders (Alnus spp.) in tundra ecosystems and the potential impact of shrubs on soil properties. Samples were measured along transects at 5- to 10-m intervals. Soil samples were collected and analyzed in the laboratory. Vegetation variables include percent cover of mosses, lichens, graminoid species, shrubs, alder, birch (Betula spp.), and willow (Salix spp.) along with the biomass, size, and age structure of alder. An allometric model to estimate alder biomass was developed. Soil metrics include moisture content, conductivity, bulk density, carbon and nitrogen content and isotope ratios. The data include the maximum annual Normalized Difference Vegetation Index (NDVI) for 2019 and the trend in maximum NDVI for 2000-2020.
The data was collected by a NASA ABoVE team to study the impact of alder shrub expansion into graminoid tundra in interior Alaska, specifically changes in soil carbon storage and permafrost state. Alder expansion was quantified by combining dendrochronology with an assessment of remote sensing products related to vegetation type and productivity and fire history. Permafrost state was assessed by measuring thaw depth in late August (a proxy for active layer thickness) with a tile probe. Soil properties (horizons, depth to permafrost or parent material, C and N stock) were assessed by collecting soil samples that were analyzed in the laboratory for bulk properties. Soil moisture and conductivity was measured in the field.
This is version 2 of this dataset.
Project: Arctic-Boreal Vulnerability Experiment
The Arctic-Boreal Vulnerability Experiment (ABoVE) is a NASA Terrestrial Ecology Program field campaign being conducted in Alaska and western Canada, for 8 to 10 years, starting in 2015. Research for ABoVE links field-based, process-level studies with geospatial data products derived from airborne and satellite sensors, providing a foundation for improving the analysis, and modeling capabilities needed to understand and predict ecosystem responses to, and societal implications of, climate change in the Arctic and Boreal regions.
Related Publications
Fiore, N.M, M.L. Goulden, C.I. Czimczik, S.A. Pedron, and M.A.Tayo. 2020. Do recent NDVI trends demonstrate boreal forest decline in Alaska? Environmental Research Letters 15:095007. https://doi.org/10.1088/1748-9326/ab9c4c
Allison M. Welch, Shawn A. Pedron, Robert Gus Jespersen, Xiaomei Xu, Brittney Martinez, Yezzen Khazindar, Nicole M. Fiore, Michael L. Goulden & Claudia I. Czimczik (2023) Implications of alder shrub growth for alpine tundra soil properties in Interior Alaska, Arctic, Antarctic, and Alpine Research, 55:1. https://doi.org/10.1080/15230430.2023.2285334
Related Dataset
Fiore, N., S. Pedron, M. Tayo, C.I. Czimczik, and M.L. Goulden. 2021. NDVI, Species Cover, and LAI, Burned and Unburned sites, Interior Alaska, 2017-2018. ORNL DAAC, Oak Ridge, Tennessee, USA. https://doi.org/10.3334/ORNLDAAC/1797
- This dataset is from a similar ABoVE field study.
Acknowledgements
This work was funded by NASA's ABoVE program (grant NNX15AU16A) (to M.L.G. and C.I.C.), the National Science Foundation (NSF-OPP 1836873, NSF-DGE 1735040), and the University of California-Irvine’s Undergraduate Research Opportunity Program. The ABoVE field office and NSF Toolik Field Station provided logistical assistance.
Data Characteristics
Spatial Coverage: Alaska, USA
ABoVE Reference Locations
Domain: Core
State/Territory: Alaska
Grid cells: Ah001v000, Bh006v004, Bh007v003, Ch041v025, Ch046v022
Spatial Resolution: Samples spaced at 5 to 10 m intervals along 30-m transects
Temporal Coverage: 2018-08-14 to 2019-08-28
Temporal Resolution: One time estimates
Study Areas: Latitude and longitude are given in decimal degrees.
| Site | Westernmost Longitude | Easternmost Longitude | Northernmost Latitude | Southernmost Latitude |
|---|---|---|---|---|
| Alaska | -150.714 | -149.707 | 68.019 | 66.340 |
Data File Information
The dataset includes two files:
ABoVE_alder_data_2019_v2.csv holds the data in comma-separated values (CSV) format. Variables are listed in Table 1.
ABoVE_alder_photo_2019_v2.jpg (Figure 1) is a photograph, in JPEG format, illustrating the tundra ecosystem dominated by graminoid species with some alder shrubs.
Table 1. Variables in ABoVE_alder_data_2019.csv.
| Variable | Unit | Description |
|---|---|---|
| campaign | YYYY | Year of field sampling |
| date | YYYY-MM-DD | Date of field sampling |
| location_id | - | Unique identifier for each sampling location |
| site | - | Site name |
| transect | - | Transect number |
| transect_stop | m | Total distance from transect start |
| lat | degrees_north | Latitude of transect in decimal degrees |
| long | degrees_east | Longitude of transect in decimal degrees |
| elevation | m | Elevation of transect |
| vwc_20 | m3 m-3 | Volumetric water content at depth of 20 cm |
| conductivity_20 | mS m-1 | Conductivity measured at depth of 20 cm in milliSiemens (mS) per meter |
| thaw_depth | cm | Depth of unfrozen soil from surface; proxy for active layer thickness |
| bedrock_depth | cm | Depth to bedrock using a 100-cm probe |
| stem_density | 4 m-2 | Number of stems in 0.25-m2 quadrat |
| parent_material | - | Geological parent material at transect |
| aspect | - | Terrain aspect at transect |
| comments | - | Comments about sampling or transect conditions |
| burn | - | Burn status of transect: Y = yes, N = no |
| vwc_12 | m3 m-3 | Volumetric water content at depth of 12 cm |
| conductivity_12 | mS m-1 | Conductivity measured at depth of 12 cm in milliSiemens (mS) per meter |
| c_stock_above_mean | g cm-2 | Mean total carbon content in organic soil horizons |
| c_stock_above_sd | g cm-2 | Standard deviation of total carbon content in organic soil horizons |
| c_stock_above_se | g cm-2 | Standard error of total carbon content in organic soil horizons |
| c_stock_above_n | 1 | Sample size for total carbon content in organic soil horizons |
| n_stock_above_mean | g cm-2 | Mean total nitrogen content in organic soil horizons |
| n_stock_above_sd | g cm-2 | Standard deviation of total nitrogen content in organic soil horizons |
| n_stock_above_se | g cm-2 | Standard error of total nitrogen content in organic soil horizons |
| n_stock_above_n | 1 | Sample size for total nitrogen content in organic soil horizons |
| organic_thickness | cm | Sum of thickness of all organic soil horizons |
| cn_mean | 1 | Mean ratio of total carbon to total nitrogen |
| cn_sd | 1 | Standard deviation for ratio of total carbon to total nitrogen |
| cn_se | 1 | Standard error for ratio of total carbon to total nitrogen |
| cn_n | 1 | Sample size for ratio of total carbon to total nitrogen |
| d13c_mean | 1000-1 | Mean stable carbon isotope ratio in delta notation (per 1000) |
| d13c_sd | 1000-1 | Standard deviation of stable carbon isotope ratio in delta notation (per 1000) |
| d13c_se | 1000-1 | Standard error for stable carbon isotope ratio in delta notation (per 1000) |
| d13c_n | 1 | Sample size for stable carbon isotope ratio in delta notation (per 1000) |
| d15n_mean | 1000-1 | Mean stable nitrogen isotope ratio in delta notation (per 1000) |
| d15n_sd | 1000-1 | Standard deviation of stable nitrogen isotope ratio in delta notation (per 1000) |
| d15n_se | 1000-1 | Standard error for stable nitrogen isotope ratio in delta notation (per 1000) |
| d15n_n | 1 | Sample size for stable nitrogen isotope ratio in delta notation (per 1000) |
| bulk_d_mean | g cm-3 | Mean bulk density of soil samples |
| bulk_d_sd | g cm-3 | Standard deviation of bulk density of soil samples |
| bulk_d_se | g cm-3 | Standard error of bulk density of soil samples |
| bulk_d_n | 1 | Sample size for bulk density of soil samples |
| vwc_lab_mean | m3 m-3 | Mean volumetric water content measured in laboratory |
| vwc_lab_sd | m3 m-3 | Standard deviation for volumetric water content measured in laboratory |
| vwc_lab_se | m3 m-3 | Standard error for volumetric water content measured in laboratory |
| vwc_lab_n | 1 | Sample size for volumetric water content measured in laboratory |
| basal_d | cm | Basal diameter of alder (Alnus viridis) |
| biomass_mod_stem | kg | Modeled mean dry biomass of an individual alder plants |
| biomass_mod_stem_sd | kg | Standard deviation for modeled mean dry biomass of an individual alder plants |
| biomass_mod_stem_se | kg | Standard error for modeled mean dry biomass of an individual alder plants |
| biomass_mod_stem_n | 1 | Sample size for modeled mean dry biomass of an individual alder plants |
| biomass_mod | kg m-2 | Modeled dry biomass of alders per area |
| biomass_mod_se | kg m-2 | Standard error for modeled dry biomass of alders per area |
| biomass_mod_n | 1 | Sample size for modeled dry biomass of alders per area |
| biomass_c_mod | kg C m-2 | Modeled carbon content of alders per area |
| biomass_c_mod_se | kg C m-2 | Standard error for modeled carbon content of alders per area |
| biomass_c_mod_n | 1 | Sample size for modeled carbon content of alders per area |
| biomass | kg | Observed mean dry biomass of an individual alder plants |
| ndvi_max_trend | 1 y-1 | Trend (slope) of yearly maximum Normalized Difference Vegetation Index (NDVI) over 2000-2020 for transect |
| ndvi_max_2019 | NDVI | Maximum NDVI for 2019 |
| age_mean | y | Mean maximum age of alder along transect |
| age_sd | y | Standard deviation of maximum age of alder along transect |
| age_se | y | Standard error of maximum age of alder along transect |
| age_n | 1 | Sample size for maximum age of alder along transect |
| percent_bare_mean | percent | Mean coverage of bare ground |
| percent_bare_sd | percent | Standard deviation of coverage of bare ground |
| percent_bare_se | percent | Standard error of coverage of bare ground |
| percent_bare_n | 1 | Sample size for coverage of bare ground |
| percent_moss_mean | percent | Mean coverage of mosses |
| percent_moss_sd | percent | Standard deviation of coverage of mosses |
| percent_moss_se | percent | Standard error of coverage of mosses |
| percent_moss_n | 1 | Sample size for coverage of mosses |
| percent_lichen_mean | percent | Mean coverage of lichens |
| percent_lichen_sd | percent | Standard deviation of coverage of lichens |
| percent_lichen_se | percent | Standard error of coverage of lichens |
| percent_lichen_n | 1 | Sample size for coverage of lichens |
| percent_dwarf_shrub_mean | percent | Mean coverage of dwarf shrubs |
| percent_dwarf_shrub_sd | percent | Standard deviation of coverage of dwarf shrubs |
| percent_dwarf_shrub_se | percent | Standard error of coverage of dwarf shrubs |
| percent_dwarf_shrub_n | 1 | Sample size for coverage of dwarf shrubs |
| percent_graminoid_mean | percent | Mean coverage of graminoid species |
| percent_graminoid_sd | percent | Standard deviation of coverage of graminoid species |
| percent_graminoid_se | percent | Standard error of coverage of graminoid species |
| percent_graminoid_n | 1 | Sample size for coverage of graminoid species |
| percent_alder_mean | percent | Mean coverage of alder |
| percent_alder_sd | percent | Standard deviation of coverage of alder |
| percent_alder_se | percent | Standard error of coverage of alder |
| percent_alder_n | 1 | Sample size for coverage of alder |
| percent_willow_mean | percent | Mean coverage of willow (Salix spp.) |
| percent_willow_sd | percent | Standard deviation of coverage of willow |
| percent_willow_se | percent | Standard error of coverage of willow |
| percent_willow_n | 1 | Sample size for coverage of willow |
| percent_aspen_mean | percent | Mean coverage of aspen (Populus spp.) |
| percent_aspen_sd | percent | Standard deviation of coverage of aspen |
| percent_aspen_se | percent | Standard error of coverage of aspen |
| percent_aspen_n | 1 | Sample size for coverage of aspen |
| percent_paper_birch_mean | percent | Mean coverage of paper birch (Betula neoalaskana) |
| percent_paper_birch_sd | percent | Standard deviation of coverage of paper birch |
| percent_paper_birch_se | percent | Standard error of coverage of paper birch |
| percent_paper_birch_n | 1 | Sample size for coverage of paper birch |
| percent_alder_max_mean | percent | Mean of the maximum coverage of alder observed among upper, middle, and lower vertical strata |
| percent_alder_max_sd | percent | Standard deviation of maximum coverage of alder observed among all three vertical strata |
| percent_alder_max_se | percent | Standard error of maximum coverage of alder observed among all three vertical strata |
| percent_alder_max_n | 1 | Sample size for maximum coverage of alder observed among all three vertical strata |
| percent_alder_upper_mean | percent | Mean coverage of alders in stratum ≥2 m above ground |
| percent_alder_upper_sd | percent | Standard deviation of coverage of alders in stratum ≥2 m above ground |
| percent_alder_upper_se | percent | Standard error of coverage of alders in stratum ≥2 m above ground |
| percent_alder_upper_n | 1 | Sample size for coverage of alders in stratum ≥2 m above ground |
| percent_alder_mid_mean | percent | Mean coverage of alders in stratum 1 to 2 m above ground |
| percent_alder_mid_sd | percent | Standard deviation of coverage of alders in stratum 1 to 2 m above ground |
| percent_alder_mid_se | percent | Standard error of coverage of alders in stratum 1 to 2 m above ground |
| percent_alder_mid_n | 1 | Sample size for coverage of alders in stratum 1 to 2 m above ground |
| percent_alder_lower_mean | percent | Mean coverage of alders in stratum <1 m above ground |
| percent_alder_lower_sd | percent | Standard deviation of coverage of alders in stratum <1 m above ground |
| percent_alder_lower_se | percent | Standard error of coverage of alders in stratum <1 m above ground |
| percent_alder_lower_n | 1 | Sample size for coverage of alders in stratum <1 m above ground |
| shrub_size_coverage | - | Binary categorical variable which indicates the presence of shrubs >2 m in height. Values: ">2" (tall shrubs present) or "<2" (tall shrubs absent). |
| shrub_size_biomass | - | Binary categorical variable which indicates whether modeled alder biomass was >2 kg m-2. Values: ">2" (biomass >2 kg m-2) or "<2" (biomass <2 kg m-2) . |
Application and Derivation
The data document the expansion of alder shrubs into graminoid tundra in interior Alaska over the past decades, a land cover change process observed across the Arctic. While many studies have documented this phenomenon, this dataset was obtained to study the implications of alder shrub expansion on soil properties, such as active layer thickness and the storage of carbon and nitrogen in soils and biomass. The data indicates that the expansion of alder shrubs results in the loss of organic soil horizons and a deeper thaw of minerals. Thus, alder shrub expansion contributes to the degradation of permafrost and reduces the amount of carbon stored in Arctic soils.
Quality Assessment
Measured variables are provided with mean, standard deviation, standard error, and sample size.
Data Acquisition, Materials, and Methods
Shrub biomass data and soil samples were collected at five alpine tundra sites in interior Alaska along the James W. Dalton Highway (Alaska Route 11) during August in 2018 and 2019. Sites were selected to minimize differences in vegetation composition, aspect, and parent material. At each site, three parallel 30-meter transects were established, separated by 10 m, incorporating areas of higher and lower shrub density. GPS location and elevation, and active layer thickness were recorded every 5 m along transects.
Vegetation height, cover, and composition were determined along each transect in 10-m intervals. The proportional cover of alder (Alnus viridis (CHAIX) DC.) within two canopy layers (<2 m and ≥2 m), along with ground cover, were recorded at 10-m intervals. Vegetations and cover types included dwarf shrub, graminoid, moss, lichen, and bare soil. For each location, alder height was estimated based on the presence or absence of alder in the canopy. All locations with alder ≥2 m tall also had shorter alders present. For locations overlapped by two surveys (i.e. 10 and 20 m), presence/absence data was averaged. Additionally, the maximum alder coverage (percent_alder_max) was estimated at each location as the greater proportional alder coverage of the two canopies. Where two surveys overlapped, the percent_alder_max value was averaged.
User Note: In this dataset, the canopy layer <2 m is separated into two strata: percent_alder_mid (1-2 m) and percent_alder_lower (0-1 m). However, these two strata were combined in the analysis presented in Welch et al. (2023).
Alder biomass was quantified by recording the number of alder stems within a 0.5 m × 0.5 m grid every 5 m along each transect and measuring the basal diameter of each stem. An allometric relationship between biomass and basal stem diameter, based on harvesting of 5-6 representative stems (including foliage) at sites 2-4, was developed to estimate aboveground biomass.
Alder growth history was reconstructed from basal stem desks collected from multiple individuals in each transect.
To study alder expansion over time, trends in NDVI over 2000-2020 were measured. NDVI trends were derived from Landsat Collection 1 (Tiers 1 and 2; https://www.usgs.gov/landsat-missions/landsat-collection-1). Images were extracted for Julian days 152-243 of years 2000-2020 using the Google Earth Engine Python API (2000 to 2020), filtered for clouds, snow, water, band saturation, and geometric uncertainty. Landsat NDVI was calculated for each image using the red and infrared bands from each sensor (bands 3 and 4 for Landsat 5 and 7; bands 4 and 5 for Landsat 8). Maximum NDVI (ndvi_max_2019) was taken as the maximum observation per year per site, based on a minimum of 7 observations per year.
Soil cores were collected with an electric auger with a scalloped edge and an inner diameter of 2.54 cm to a depth of 6 to 36 cm below the surface, determined by the distance to frozen or saturated ground, parent material, or auger length. Only complete organic layers were analyzed. Cores were stored intact in capped plastic liners and frozen (-20° C) within 24 hours until analysis. Frozen soils were sectioned by horizon, oven-dried, and homogenized to <40 μm diameter or ground to powder, respectively. Aliquots (1-6 mg of organic and 8-25 mg of mineral soil) were weighed into tin capsules and analyzed for their total C and N content with an elemental analyzer coupled with an isotope ratio mass spectrometer. The total amount of C or N in each complete organic layer was calculated using bulk density, depth, and elemental data.
See Welch et al. (2023) for more details of methods and the findings of this study.
Data Access
These data are available through the Oak Ridge National Laboratory (ORNL) Distributed Active Archive Center (DAAC).
ABoVE: Alder Shrub Cover and Soil Properties, Alaska, 2019, V2
Contact for Data Center Access Information:
- E-mail: uso@daac.ornl.gov
- Telephone: +1 (865) 241-3952
References
Fiore, N.M, M.L. Goulden, C.I. Czimczik, S.A. Pedron, and M.A.Tayo. 2020. Do recent NDVI trends demonstrate boreal forest decline in Alaska? Environmental Research Letters 15:095007. https://doi.org/10.1088/1748-9326/ab9c4c
Fiore, N., S. Pedron, M. Tayo, C.I. Czimczik, and M.L. Goulden. 2021. NDVI, Species Cover, and LAI, Burned and Unburned sites, Interior Alaska, 2017-2018. ORNL DAAC, Oak Ridge, Tennessee, USA. https://doi.org/10.3334/ORNLDAAC/1797
Allison M. Welch, Shawn A. Pedron, Robert Gus Jespersen, Xiaomei Xu, Brittney Martinez, Yezzen Khazindar, Nicole M. Fiore, Michael L. Goulden & Claudia I. Czimczik (2023) Implications of alder shrub growth for alpine tundra soil properties in Interior Alaska, Arctic, Antarctic, and Alpine Research, 55:1. https://doi.org/10.1080/15230430.2023.2285334
Dataset Revisions
| Version | Release Date | Revision Notes |
|---|---|---|
| 2.0 | 2024-01-18 | In V1, stock (C and N) variable definitions did not accurately define the published data. The stock data was defined as "Mean total [carbon or nitrogen] content in organic soil horizons", while the data that was published was the mean total [carbon or nitrogen] content in all sampled soil horizons. The data has been updated in V2 to accurately reflect the original definition which was and is "Mean total [carbon or nitrogen] content in organic soil horizons |
| 1.0 | 2022-12-29 | Original publication (V1) |