Documentation Revision Date: 2021-02-03
Dataset Version: 1.1
Summary
At high latitudes, large solar zenith angles (SZA) and the presence of reflective snow- and ice-covered surfaces necessitate the consideration of multiple scattering events in the calculation of a more accurate blue sky albedo. Based on the source of the data, quality flags represent high-latitude potential sources of error, including MCD43A2_qflag, Snow_BRDF_Alb, maximum SZA, and the aerosol optical depth (AOD), which were used to derive the blue sky albedo. In addition, the four quality flags are combined to make a meta-quality flag with values from 0 to 63. Each meta-quality flag value corresponds to a unique combination of the four individual flags. Users can filter observations based on the desired values of each flag. Details about quality flags can be found in the data characteristics section of this documentation and the "bluesky_quality_flag_key.csv” data file.
There are 12,532 data files in GeoTIFF (.tif) format with this dataset. This includes one file with daily mean shortwave blue sky albedo and one quality flag file for each day of the year for the years 2001-2016. For the year 2000, the data are for the days 55-366, and for the year 2017, the data are for day 1 thru day 112. In addition, there is one file in comma-separated format (.csv) which provides the meta-quality flag values and corresponding individual quality control flag values. There are a total of 12,533 files with this dataset.
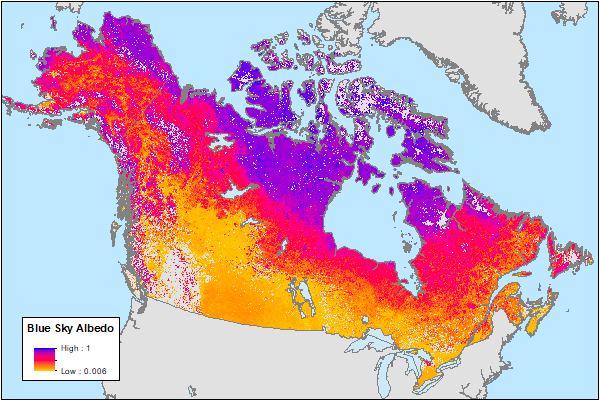
Figure 1. Daily mean shortwave blue sky albedo for April 7, 2017. Blue sky refers to albedo calculated under real-world conditions with a combination of both diffuse and direct lighting based on atmospheric and view-geometry conditions. Source file: bluesky_albedo_2017_097_albedo.tif.
Citation
Solvik, K.K., S. Potter, A.M. Erb, M. Roman, C. Schaaf, Q. Sun, Z. Wang, and B.M. Rogers. 2019. ABoVE: MODIS-Derived Daily Mean Blue Sky Albedo for Northern North America, 2000-2017. ORNL DAAC, Oak Ridge, Tennessee, USA. https://doi.org/10.3334/ORNLDAAC/1605
Table of Contents
- Dataset Overview
- Data Characteristics
- Application and Derivation
- Quality Assessment
- Data Acquisition, Materials, and Methods
- Data Access
- References
- Dataset Revisions
Dataset Overview
This dataset contains MODIS-derived daily mean shortwave blue sky albedo for northern North America (i.e., Canada and Alaska) and a set of quality control flags for each albedo value to aid in user interpretation. The data cover the period of February 24, 2000 through April 22, 2017. The blue sky albedo data were derived from the MODIS 500-m version 6 Bidirectional Reflectance Distribution Function and Albedo (BRDF/Albedo) Model Parameters MCD43A1 dataset (MCD43A1.006; Schaaf & Wang, 2015a, please refer to the MCD43 documentation and user guides for more information). Blue sky refers to albedo calculated under real-world conditions with a combination of both diffuse and direct lighting based on atmospheric and view-geometry conditions. Daily mean albedo was calculated by averaging hourly instantaneous blue sky albedo values weighted by the solar insolation for each time interval. Potter et al. (2019) is the associated paper for this dataset. Note the actual extent of the dataset in Figure 1 of the User Guide. Users are encouraged to refer to the User Guide for further important information about the use of this dataset.
At high latitudes, large solar zenith angles (SZA) and the presence of reflective snow- and ice-covered surfaces necessitate the consideration of multiple scattering events in the calculation of a more accurate blue sky albedo. Based on the source of the data, quality flags represent high-latitude potential sources of error, including MCD43A2_qflag, Snow_BRDF_Alb, maximum SZA, and the aerosol optical depth (AOD), which were used to derive the blue sky albedo. In addition, the four quality flags are combined to make a meta-quality flag with values from 0 to 63. Each meta-quality flag value corresponds to a unique combination of the four individual flags. Users can filter observations based on the desired values of each flag. Details about quality flags can be found in the data characteristics section of this documentation and the "bluesky_quality_flag_key.csv” data file.
Project: Arctic-Boreal Vulnerability Experiment
The Arctic-Boreal Vulnerability Experiment (ABoVE) is a NASA Terrestrial Ecology Program field campaign based in Alaska and western Canada, for 8 to 10 years, starting in 2015. Research for ABoVE links field-based, process-level studies with geospatial data products derived from airborne and satellite sensors, providing a foundation for improving the analysis and modeling capabilities needed to understand and predict ecosystem responses and societal implications.
Related Publication:
Potter, S. K. Solvik, A. Erb, S.J. Goetz, J.F. Johnstone, M.C. Mack, J.T. Randerson, M.O. Román, C.L. Schaaf, M.R. Turetsky, S. Veraverbeke, X.J. Walker, Z. Wang, and B.M. Rogers. 2019. Climate change decreases the cooling effect from post-fire albedo in boreal North America. Global Change Biology. 2019; 00: 1–16. https://doi.org/10.1111/gcb.14888
Acknowledgements:
This work was funded by NASA ABoVE with grant number NNX15AU56A.
Data Characteristics
Spatial Coverage: northern North America (i.e., Canada and Alaska)
ABoVE Reference Locations:
Domain: Core ABoVE
Grid cells: All "A" grid tiles excluding Ah005v000, Ah005v001, Ah000v003, and Ah000v002
Spatial Resolution: 500 m (nominal)
Temporal Coverage: 2000-02-24 to 2017-04-22
Temporal Resolution: Daily
Study Areas (All latitude and longitude given in decimal degrees)
|
Site |
Westernmost Longitude |
Easternmost Longitude |
Northernmost Latitude |
Southernmost Latitude |
|---|---|---|---|---|
|
Northern North America, in the ABoVE grid study area |
-173.089 |
-52.618 |
79.045 |
41.681 |
Data File Information
There are 12,532 data files in GeoTIFF (.tif) format with this dataset. This includes one file with daily mean shortwave blue sky albedo and one quality flag file for each day of the year for the years 2001-2016. For the year 2000, the data are for the days 55-366, and for the year 2017, the data are for day 1 thru day 112. In addition, the file bluesky_quality_flag_key.csv provides the meta-quality flag values and corresponding individual quality control flag values. The meta flag values range from 0 - 63. There are a total of 12,533 files with this dataset.
The data files are named as:
bluesky_albedo_YYYY_DDD_XXX.tif and
Where:
YYYY is year 2000 to 2017
DDD is the day of year
XXX is “albedo” for the blue sky albedo data or “quality” for the albedo quality flag files
Example file names: bluesky_albedo_2013_007_albedo.tif
bluesky_albedo_2013_007_quality.tif
Properties of the GeoTIFF Albedo and Quality Files:
Spatial Data
Bands: 1
Scaling: 0.001 (albedo), 1 (quality)
No Data Value: 32767 (albedo), 255 (quality)
Map units: meter
Native data type: Int 16 (albedo), Byte (quality)
Spatial Reference
The files are in the ABoVE standard projection:
EPSG: 102001 (Canada Albers Equal Area Conic, North American Datum, 1983)
PROJCS["unnamed",
GEOGCS["unnamed ellipse",
DATUM["unknown",
SPHEROID["unnamed",6371007.181,0]],
PRIMEM["Greenwich",0],
UNIT["degree",0.0174532925199433]],
PROJECTION["Sinusoidal"],
PARAMETER["longitude_of_center",0],
PARAMETER["false_easting",0],
PARAMETER["false_northing",0],
UNIT["metre",1,
AUTHORITY["EPSG","9001"]]]
Data file bluesky_quality_flag_key.csv
This file provides four quality flags and a meta flag. The flags (column headers in the file) are described below.
1. meta_flag_value: This flag provides a value representing a unique combination of the four individual flags described below. The meta_flag is provided to enable users to filter observations based on the desired combination of individual flag values. The flag values range from 0 - 63.
2. sza_above_70: A flag to indicate that the calculation only included albedo values when the solar zenith angle was less than 70 degrees or up to 90 degrees. Albedo observation quality suffers at high zenith angles. Time points where SZA was above 70 degrees were not considered, unless they were the only observations available at that location/day.
The flag values are 0 or 1:
0 = Calculation only included albedo values when SZA < 70.
1 = SZAs up to 90 degrees included. <70 was not available.
3. snow_flag: This is the Snow_BRDF_Albedo flag provided by the MCD43A2 version 6 BRDF/Albedo Quality dataset (MCD43A2.006; Schaaf & Wang, 2015b).
The values are 0 or 1:
0 = Snow-free Albedo retrieved
1 = Snow Albedo retrieved
4. mcd43a2_qflag: Quality flag derived from per-band flags in MCD43A1.006 (Schaaf & Wang, 2015a). A single summary flag was calculated as the highest value (corresponding to the lowest quality) from the per-band quality flags (1-7).
Note: Low quality observations, particularly those with a mcd43a2_qflag of 3, should be used with care as they likely have high error. The flag values are 0, 1, 2, or 3:
0 = best quality, full inversion (WoDs, RMSE majority good)
1 = good quality, full inversion (also including the cases that no clear sky observations over the day of interest or the Solar Zenith Angle is too large even WoDs, RMSE majority good)
2 = Magnitude inversion (numobs >=7)
3 = Magnitude inversion (numobs >=2 and <7)
5. aod_data_source: Aerosol Optical Depth was taken from one of several sources, depending on availability. This flag provides the source of the AOD value used in the target pixel's calculation, with higher flags representing lower quality AOD sources. The flag values are 0, 1, 2, or 3.
Application and Derivation
These data were utilized to train random forest models to investigate the effects of fire on surface albedo. Fire is a primary disturbance in boreal forests and can generate both positive and negative climate forcings. Quantifying the influence of fire on surface albedo and relationships to soils, topography, climate, land cover/vegetation type, successional dynamics, time since fire, and fire severity, and predicting post-fire albedo is increasingly important as the climate changes and management frameworks evolve to consider climate impacts (Potter et al., 2019).
Quality Assessment
Quality control data files with quality control flags are included with this dataset for each mean blue sky albedo data file.
The blue sky albedo product compared favorably to the publicly-available inputs of MODIS black and white sky albedo. As expected, blue sky albedo was considerably higher than both inputs (more so for black sky) due to the representation of multiple scattering. It's believed this represents a more accurate product for assessing the impacts of high latitude dynamics on land surface albedo and the climate system.
Data Acquisition, Materials, and Methods
Daily “blue sky” shortwave albedo product was created for every pixel and day in the study domain between 24 February 2000 and 22 April 2017.
“Blue sky” refers to albedo under real-world conditions from a combination of both diffuse and direct lighting and can be calculated using the three-parameter RossThick–LiSparse–Reciprocal (RTLSR) kernel equations with modified coefficients based on atmospheric and view-geometry conditions. At high latitudes, large SZA and the presence of reflective snow- and ice-covered surfaces necessitate the consideration of multiple scattering events in the calculation of a more accurate blue sky albedo.
To obtain the daily mean albedo, instantaneous blue sky albedo was calculated for each hour by estimating the SZA based on time, latitude, and day of the year. Hourly values were then weighted by their relative proportion of the total insolation over the whole day.
Because BRDF/albedo calculations have been shown to have higher error at high SZAs (Román et al., 2010), SZAs over 70º were used only if no observation with a lower SZA was available, for example during the shoulder seasons when the sun does not rise more than 20º above the horizon for large parts of our study domain.
Daily BRDF model parameters were provided by the MODIS MCD43A1.V006 product (Schaaf & Wang, 2015a). Solar insolation was obtained from the CERES SYN1deg top-of-atmosphere (TOA) flux values. The SYN1deg-M3Hour provides 3-hourly estimates of insolation for each month. These were interpolated to hourly intervals using a periodic spline and resampled to MODIS 500-m resolution. Multiple sources were used to provide AOD estimates. When available, the MOD08 daily product was preferentially used. A lower priority product was used when this was not the case, including (in descending order) the MOD08 monthly product, the monthly MISR MIL3MAE product resampled to the MODIS 500-m grid, or the approximate global AOD mean of 0.2 that is often assumed. The source of AOD for each pixel-date was recorded in the output quality flags, along with the presence or absence of snow, and the quality flag from the MCD43A1.006 BRDF inputs (Potter et al., 2019).
Potter et al. (2019), the paper accompanying this dataset, provides more detailed information about data methods and quality assessment approach. Users may contact Stefano Potter (spotter@whrc.org) for related questions.
Data Access
These data are available through the Oak Ridge National Laboratory (ORNL) Distributed Active Archive Center (DAAC).
ABoVE: MODIS-Derived Daily Mean Blue Sky Albedo for Northern North America, 2000-2017
Contact for Data Center Access Information:
- E-mail: uso@daac.ornl.gov
- Telephone: +1 (865) 241-3952
References
Potter, S. K. Solvik, A. Erb, S.J. Goetz, J.F. Johnstone, M.C. Mack, J.T. Randerson, M.O. Román, C.L. Schaaf, M.R. Turetsky, S. Veraverbeke, X.J. Walker, Z. Wang, and B.M. Rogers. 2019. Climate change decreases the cooling effect from post-fire albedo in boreal North America. Global Change Biology. 2019; 00: 1–16. https://doi.org/10.1111/gcb.14888
Román, M.O., Schaaf, C B., Lewis, P., Gao, F., Anderson, G.P., Privette, J.L., Strahler, A.H., Woodcock, C.E. and Barnsley, M. (2010). Assessing the coupling between surface albedo derived from MODIS and the fraction of diffuse skylight over spatially-characterized landscapes. Remote Sensing of Environment, 114(4), 738-760. https://doi.org/10.1016/j.rse.2009.11.014
Schaaf, C., Z. Wang. MCD43A1 MODIS/Terra+Aqua BRDF/Albedo Model Parameters Daily L3 Global - 500m V006. 2015a, distributed by NASA EOSDIS Land Processes DAAC, https://doi.org/10.5067/MODIS/MCD43A1.006
Schaaf, C., Z. Wang. MCD43A2 MODIS/Terra+Aqua BRDF/Albedo Quality Daily L3 Global - 500m V006. 2015b, distributed by NASA EOSDIS Land Processes DAAC, https://doi.org/10.5067/MODIS/MCD43A2.006
Dataset Revisions
| Version | Release Date | Description of Changes |
|---|---|---|
| 1.1 | 2021-02-22 | Updated earlier version to 1) exclude data in CONUS and Greenland and 2) remove data files in Sinusoidal projection |
| 1.0 | 2020-01-23 | Initial data added for North America above 40 degrees North and included data files in both ABoVE standard projection and Sinusoidal projection. |