Documentation Revision Date: 2018-09-21
Data Set Version: 1
Summary
There are 17 data files in GeoTIFF (.tif) format with this dataset.
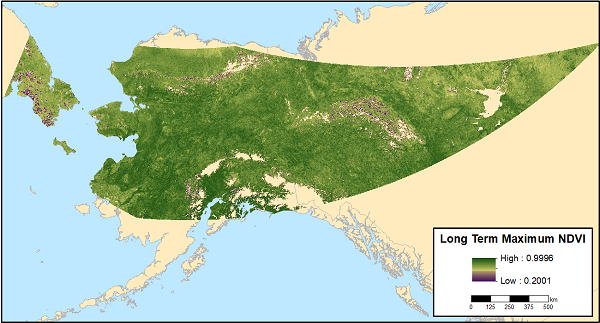
Figure 1. Long-term maximum NDVI for the Alaska, USA and the Yukon Territory, Canada study area covering the years 2002-2017.
Citation
Verbyla, D. 2018. ABoVE: MODIS-derived Maximum NDVI, Northern Alaska and Yukon Territory for 2002-2017. ORNL DAAC, Oak Ridge, Tennessee, USA. https://doi.org/10.3334/ORNLDAAC/1614
Table of Contents
- Data Set Overview
- Data Characteristics
- Application and Derivation
- Quality Assessment
- Data Acquisition, Materials, and Methods
- Data Access
- References
Data Set Overview
This dataset provides the maximum Normalized Difference Vegetation Index (NDVI) at 1-km resolution over northern Alaska, USA and the Yukon Territory, Canada for each year from 2002-2017, as well as a 16 year maximum NDVI product. MODIS products MOD13Q1 and MYD13Q1 from Collection 6 were acquired at 250-m pixel size from June 1-August 30 of each year. Within each growing season from 2002-2017, the maximum NDVI was determined for each pixel. These maximum NDVI values were then aggregated to 1-km by selecting the maximum NDVI from the sixteen 250-m pixels values nested within each 1-km pixel. A long-term 16-year maximum NDVI was then derived from the time series of annual maximum NDVI values.
Project: Arctic-Boreal Vulnerability Experiment
The Arctic-Boreal Vulnerability Experiment (ABoVE) is a NASA Terrestrial Ecology Program field campaign based in Alaska and western Canada between 2016 and 2021. Research for ABoVE links field-based, process-level studies with geospatial data products derived from airborne and satellite sensors, providing a foundation for improving the analysis and modeling capabilities needed to understand and predict ecosystem responses and societal implications.
Acknowledgements:
This research was funded under NASA grant number NNX15AU21A
Data Characteristics
Spatial Coverage: Northern Alaska and Yukon Territory, Canada
ABoVE Reference Locations:
Domain: Core ABoVE
State/territory: Alaska and Yukon Territory, Canada
Spatial resolution: 1 km
Temporal coverage: 2002-06-01 to 2017-08-30
Temporal resolution: Annual and long-term (16 year) maximum
Study Areas (All latitude and longitude given in decimal degrees)
| Site | Westernmost Longitude | Easternmost Longitude | Northernmost Latitude | Southernmost Latitude |
|---|---|---|---|---|
| Alaska and Canada | -175.763 | -97.9319 | 68.96583 | 52.16944 |
Data file information and description
There are 17 data files in GeoTIFF (.tif) format with this dataset. Sixteen files provide maximum NDVI at 1-km resolution over northern Alaska, USA and the Yukon Territory, Canada for each year from 2002-2017, and one file contains the long-term (2002-2017) maximum NDVI in each 1-km pixel.
Scale Factor: The maximum NDVI values reported here are scaled by a factor of 10,000, thus values range from 2000 (representing NDVI = 0.2) to greater than 9000 (representing NDVI vales > 0.9).
Fill value: Pixel values of -1 represent missing data due to unvegetated conditions (NDVI < 0.2), fill pixels, or pixels contaminated by cloud and cloud shadow.
The file names and summary of the NDVI data values are provided in the table below.
Table 1. Properties of the GeoTIFF files.
| File name | Minimum value | Maximum value | Mean | Std deviation |
|---|---|---|---|---|
| long_term_max_NDVI.tif | 2001 | 9996 | 7972 | 1109.9 |
| max_NDVI_2002.tif | 2001 | 9996 | 7459.2 | 991.4 |
| max_NDVI_2003.tif | 2001 | 9996 | 7481.3 | 986.5 |
| max_NDVI_2004.tif | 2001 | 9995 | 7468.8 | 1004.8 |
| max_NDVI_2005.tif | 2001 | 9994 | 7388.3 | 1005 |
| max_NDVI_2006.tif | 2001 | 9996 | 7515.3 | 975.3 |
| max_NDVI_2007.tif | 2001 | 9995 | 7555.7 | 959.8 |
| max_NDVI_2008.tif | 2001 | 9994 | 7514.6 | 955.3 |
| max_NDVI_2009.tif | 2001 | 9993 | 7371.2 | 958.5 |
| max_NDVI_2010.tif | 2001 | 9995 | 7422 | 975.2 |
| max_NDVI_2011.tif | 2001 | 9994 | 7510.5 | 948.2 |
| max_NDVI_2012.tif | 2001 | 9995 | 7568.9 | 930.4 |
| max_NDVI_2013.tif | 2001 | 9995 | 7682.2 | 982.9 |
| max_NDVI_2014.tif | 2001 | 9994 | 7503 | 945.6 |
| max_NDVI_2015.tif | 2001 | 9996 | 7563.9 | 1042.3 |
| max_NDVI_2016.tif | 2001 | 9995 | 7605.6 | 953.3 |
| max_NDVI_2017.tif | 2001 | 9966 | 7512.9 | 1053 |
Projection information
PROJCS: NAD 1983 Alaska Albers,
DATUM: North American Datum 1983
SPHEROID GRS 1980,6378137,298.2572221010042
AUTHORITY: EPSG, 7019, AUTHORITY: EPSG, 6269
PRIMEM: Greenwich ,0
UNIT: degree, 0.0174532925199433
AUTHORITY: EPSG 4269
PROJECTION: Albers Conic Equal Area
PARAMETER: standard parallel 1, 55
PARAMETER: standard parallel 2, 65
PARAMETER: latitude of center, 50
PARAMETER: longitude of center, -154
PARAMETER: false easting, 0
PARAMETER: false northing, 0
AUTHORITY: EPSG 9001
Application and Derivation
NDVI is the most widely used proxy for vegetation cover and productivity. The long-term trend in maximum NDVI in the Arctic may indicate responses of that ecosystem to climate change.
Quality Assessment
Only NDVI values with a MODIS reliability flag of "good quality" or zero were used. Any input 250-m NDVI value less than 0.2 as "unvegetated" or poor quality was excluded. These pixels were assigned a value of -1. There was a strong relationship between maximum NDVI values and elevation for alpine areas within the extent of this dataset.
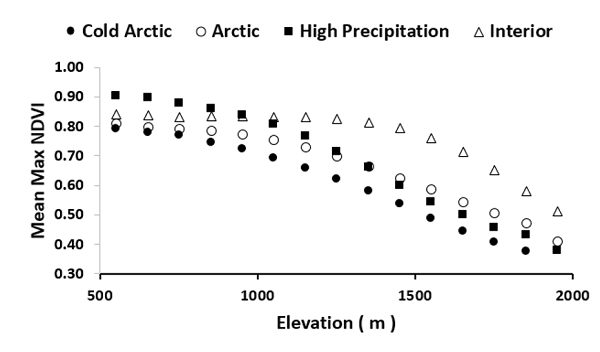
Figure 2. Example of long term NDVI declining with elevation for four climatic classes of mountain areas in Alaska and western Canada.
Data Acquisition, Materials, and Methods
MODIS products MOD13Q1 and MYD13Q1, Collection 6, were acquired at 250-m pixel size from June 1-August 30 each summer from 2002 through 2017 to determine the maximum Normalized Difference Vegetation Index (NDVI) for northern Alaska and the Yukon Territory, Canada. The MODIS global tiles of H10V02, H11V02, and H12V02 were mosaiced and re-projected to the Alaska Albers NAD83 Equal Area Projection at 250-m pixel size. For each summer, 2002-2017, the maximum NDVI was determined for each 250-pixel.
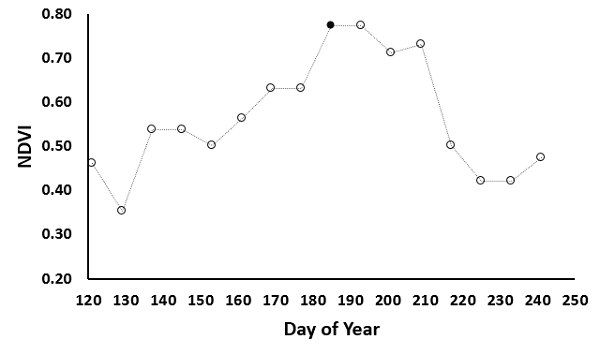
Figure 3. Example of summer maximum NDVI derived from an 8-day time series. In this example, the maximum NDVI of 0.78 for the pixel (black marker symbol) was selected from early July.
The 16-year maximum NDVI for each pixel was then derived from the time series of annual maximum NDVI values.
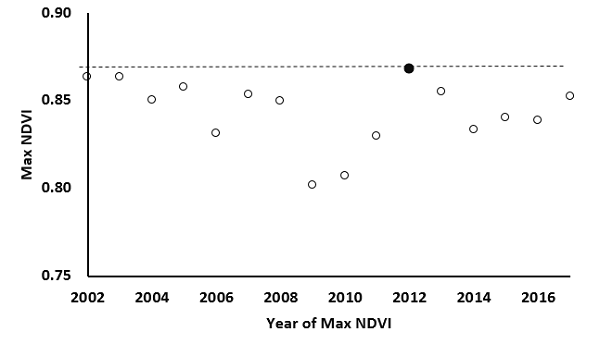
Figure 4. Long-term maximum NDVI for a 250-m pixel. In this example, the long-term maximum NDVI (black marker symbol) was 0.87 from 2012 for the pixel.
These long-term NDVI values were then aggregated to 1-km by selecting the maximum NDVI from the sixteen 250-m pixels maximum NDVI values nested within each 1-km pixel.
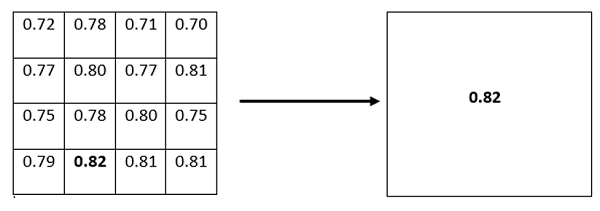
Figure 5. Long term maximum NDVI for 1-km pixel size derived from sixteen 250-m pixels.
Scale Factor: Since floating point values require 4-bytes, the NDVI values are scaled as 2-byte integers. The maximum NDVI values at 1-km pixel size are scaled to integer values by 10,000 ranging from 2000 (representing NDVI 0.2) to greater than 9000 (representing NDVI vales > 0.9). Pixel values of -1 represent missing data due to unvegetated conditions (NDVI < 0.2), fill pixels, or pixels contaminated by cloud and cloud shadow.
Data Access
These data are available through the Oak Ridge National Laboratory (ORNL) Distributed Active Archive Center (DAAC).
ABoVE: MODIS-derived Maximum NDVI, Northern Alaska and Yukon Territory for 2002-2017
Contact for Data Center Access Information:
- E-mail: uso@daac.ornl.gov
- Telephone: +1 (865) 241-3952
References
None provided.