Documentation Revision Date: 2019-05-30
Dataset Version: 1
Summary
The AirSWOT (Surface Water and Ocean Topography) data collection flights were flown in support of the NASA Arctic-Boreal Vulnerability Experiment (ABoVE). Radar and CIR data were collected over the YFB from a Beechcraft Super King Air B200 aircraft from an altitude of >8,770 m. The core of NASA AirSWOT is the Ka-band SWOT Phenomenology Airborne Radar (KaSPAR). Ka-band radar uses interferometry to measure surface elevation, particularly focusing on open surface water, producing novel swath water surface elevation measurements. The radar products include noise equivalent radar backscatter, gridded height, random height error, magnitude (backscatter), incidence angle, and signal to noise ratio. The orthomosaic was generated from individual CIR images collected by a Cirrus Designs Digital Camera System (DCS) mounted on the aircraft.
There are 67 data files with this dataset. This includes 60 radar data files in GeoTIFF (.tif) format (six radar products for each of the ten flight paths), five water masks in shapefile format provided in compressed (.zip) files, one shapefile with flight path data provided in compressed (.zip) format, and one orthomosaic provided in .tif format. In addition, there are six companion files in .kmz format created for quick referencing in Google Earth for each of the shapefiles.
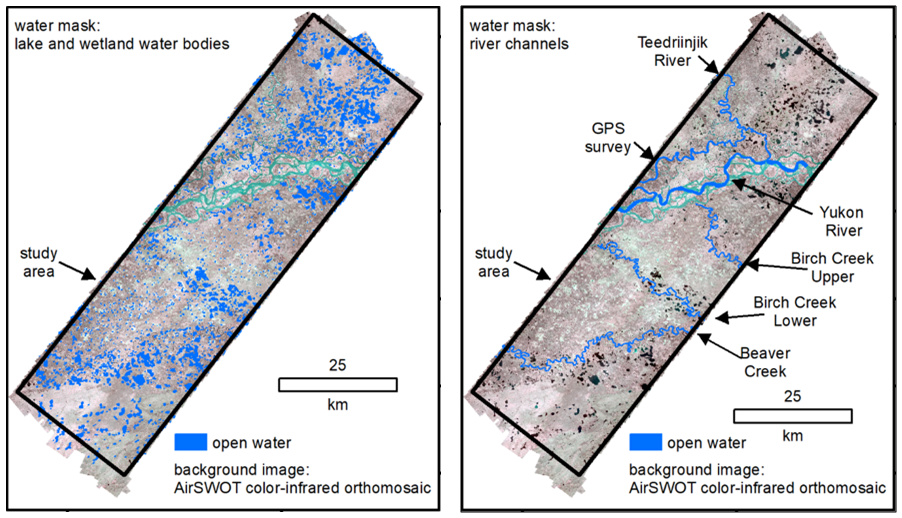
Figure 1. AirSWOT water masks for lakes and wetlands (left) and river channel reaches (right) in the ~3,300 km2 Yukon Flats Basin study area. Image is from Pitcher et al. (2019).
Citation
Pitcher, L.H., L.C. Smith, T.M. Pavelsky, J.V. Fayne, S.W. Cooley, E.H. Altenau, D.K. Moller, and J. Arvesen. 2019. ABoVE: AirSWOT Radar, Orthomosaic, and Water Masks, Yukon Flats Basin, Alaska, 2015. ORNL DAAC, Oak Ridge, Tennessee, USA. https://doi.org/10.3334/ORNLDAAC/1655
Table of Contents
- Dataset Overview
- Data Characteristics
- Application and Derivation
- Quality Assessment
- Data Acquisition, Materials, and Methods
- Data Access
- References
Dataset Overview
This dataset provides NASA AirSWOT Ka-band (35.75 GHz) radar interferometry data products for water surface elevation (WSE), a derived color-infrared (CIR) digital image orthomosaic, and derived lake/wetland and river channel water masks at 3.6 x 3.6 m resolution for a study area of ~3,300 km2 in the Yukon Flats Basin (YFB) in eastern interior Alaska. The data were collected during a flight over the region on June 15, 2015. These data were collected to validate AirSWOT WSE mappings and to improve the understanding of surface water flow through complex Arctic-Boreal wetland systems.
The AirSWOT (Surface Water and Ocean Topography) data collection flights were flown in support of the NASA Arctic-Boreal Vulnerability Experiment (ABoVE). Radar and CIR data were collected over the YFB from a Beechcraft Super King Air B200 aircraft from an altitude of >8,770 m. The core of NASA AirSWOT is the Ka-band SWOT Phenomenology Airborne Radar (KaSPAR). Ka-band radar uses interferometry to measure surface elevation, particularly focusing on open surface water, producing novel swath water surface elevation measurements. The radar products include noise equivalent radar backscatter, gridded height, random height error, magnitude (backscatter), incidence angle, and signal to noise ratio. The orthomosaic was generated from individual color-infrared (CIR) images collected by a Cirrus Designs Digital Camera System (DCS) mounted on the aircraft.
Project: Arctic-Boreal Vulnerability Experiment
The Arctic-Boreal Vulnerability Experiment (ABoVE) is a NASA Terrestrial Ecology Program field campaign based in Alaska and western Canada between 2016 and 2021. Research for ABoVE links field-based, process-level studies with geospatial data products derived from airborne and satellite sensors, providing a foundation for improving the analysis and modeling capabilities needed to understand and predict ecosystem responses and societal implications.
Related Datasets:
Kyzivat, E.D., L.C. Smith, L.H. Pitcher, J. Arvesen, T.M. Pavelsky, S.W. Cooley, and S. Topp. 2018. ABoVE: AirSWOT Color-Infrared Imagery Over Alaska and Canada, 2017. ORNL DAAC, Oak Ridge, Tennessee, USA. https://doi.org/10.3334/ORNLDAAC/1643
Fayne, J.V., L.C. Smith, L.H. Pitcher, and T.M. Pavelsky. 2019. ABoVE: AirSWOT Ka-band Radar over Surface Waters of Alaska and Canada, 2017. ORNL DAAC, Oak Ridge, Tennessee, USA. https://doi.org/10.3334/ORNLDAAC/1646
Related Publication:
Pitcher, L.H, Pavelsky, T.M., Smith, L.C., Moller, D.K., Altenau, E.H., Allen, G.H., Lion, C., Butman, D., Cooley, S.W., Fayne, J., and M. Bertram. (2019). AirSWOT InSAR mapping of surface water elevations and hydraulic gradients across the Yukon Flats Basin, Alaska. Water Resources Research, 55. https://doi.org/10.1029/2018WR023274
Acknowledgements:
These data were collected in support of the NASA Terrestrial Hydrology Program grant NNX13AD05G. Additional funds were provided by NASA Surface Water and Ocean Topography mission grant NNX16AH83G. Lincoln Pitcher was funded by a NASA Earth and Space Sciences Fellowship Program grant NNX14AP57H.
Data Characteristics
Spatial Coverage: Yukon Flats Basin, Alaska
ABoVE Reference Locations:
Domain: Core ABoVE
State/territory: Alaska
Grid cells: Ch044v029, Ch045v029, Ch046v029, Ch047v029, Ch044v030, Ch045v030, Ch046v030, Ch047v030
Spatial Resolution: The pixel size of the AirSWOT images and derived CIR orthomosaic and water masks is 3.6 x 3.6 m
Temporal Coverage: 2015-06-15
Temporal Resolution: One day
Study Areas: (All latitude and longitude given in decimal degrees)
| Site | Westernmost Longitude | Easternmost Longitude | Northernmost Latitude | Southernmost Latitude |
|---|---|---|---|---|
| Yukon Flats Basin, Alaska | -147.289111 | -145.134486 | 66.897817 | 65.928239 |
Data file information
There are 67 data files with this dataset:
- 60 radar data files in GeoTIFF (.tif) format (six radar products for each of the ten flight paths)
- 5 water masks in shapefile format provided in compressed (.zip) files
- 1 shapefile with flight path data provided in compressed (.zip) format
- 1 color-infrared orthomosaic provided in .tif format
In addition, there are six companion files in .kmz format created for quick referencing in Google Earth for each of the shapefiles.
Table 1. File names and descriptions
| Data File | Description |
| GeoTIFF Files | |
|
product_20150615_path.tif There are 60 radar data files, made up of six radar products for each of the ten flight paths. |
Radar products where: product is one of: backscatter, heights, height_error, incidence_angle, magnitude, or signal_noise_ratio path is the six-digit flight path number File name example: backscatter_20150615_000121.tif Refer to Table 2 for a description of each product. |
| color_infrared_orthomosaic_20150615.tif | Color-infrared orthomosiac in GeoTIFF (.tif) format generated from digital images collected on June 15, 2015 coincident with radar data collection |
| Shapefiles | |
| water_mask_rivers.zip | A compressed shapefile which contains a water mask for open water pixels prior to isolating data along the centerline orthogonal in shapefile format (.shp). Only a subset of river reaches in the YFB were investigated; therefore river channel masks do not cover all river channels in the YFB study area extent and were also manually modified to be single-thread. |
| water_mask_river_centerline_orthogonals.zip | A compressed shapefile which contains a water mask for open water pixels after isolating data along the centerline orthogonal. |
| river_centerline_points.zip | A compressed shapefile which contains centerline points for the water mask. |
| river_centerline_orthogonals.zip | A compressed shapefile which contains centerline orthogonals for the river channel mask. |
| water_mask_lakes.zip | A compressed shapefile which contains a water mask for lakes. |
| radar_paths.zip | A compressed shapefile which delimits the extent of *hgt* pixels for each radar path and provides a numeric identifier for each path. |
Table 2. Radar data product descriptions. The products are named as they appear in the file names.
| Radar data product | Units/format | Description |
| noise equivalent radar backscatter | dB | Noise equivalent radar backscatter NEσ0. Original data provided as lists of NEσ0 and incidence angle. We calculate the second-order polynomial coefficients for best fit between incidence angle and NEσ0. We then apply these coefficients to each *inc* layer to create NEσ0 layers. |
| heights | Meters (pixel units) | Gridded heights relative to the WGS84 ellipsoid |
| height_error | Meters | Random height error from the interferometric correlation |
| incidence_angle | Radians (pixel units) | Gridded incidence angle with respect to the local vertical |
| magnitude | Linear units | Radar magnitude or calibrated backscatter coefficients (σ0) in linear units. To convert to dB: 20*log10(mag). |
| signal_noise_ratio | Units of dB | Signal to noise ratio (SNR). This is calculated as the difference between σ0 (*mag* in dB) and NEσ0 (*nesig0* in dB) |
GeoTIFF File Information
Spatial Data Properties common to all Radar Product GeoTIFF Files:
Bands: 1
Scaling: 1
No data value: -9999
Map units: meter
Pixels: 3.6 m x 3.6 m
Spatial Reference Properties: Projection: WGS 84, UTM zone 6N. EPSG: 32606
Spatial Data Properties of color_infrared_orthomosaic_20150615.tif :
Bands: 4
- B1: NIR
- B2: red
- B3: green
- B4: data mask. data = 65535; no data = 0
Scaling: 1
No data value: -9999
Map units: meter
Pixels: 3.6 x 3.6 m
Spatial Reference Properties: Projection: WGS 84, UTM zone 6N. EPSG: 32606
Shapefile Information
File Attributes: (Note: Four shapefiles refer to Figure 4 in Section 5 of this document which provides a schematic representation of the water masks).
Table 3. water_mask_rivers.shp (equivalent to teal ‘open water mask’ designation in Figure 4)
| Attributes | Description |
|---|---|
| name | Name of river channel |
| area_m2 | Area in m2 of river channel mask |
| area_km2 | Area in km2 of river channel mask |
Table 4. water_mask_river_centerline_orthogonals.shp (equivalent to blue ‘orthogonal open water mask’ designation in Figure 4)
| Attributes | Description |
|---|---|
| name | Name of river channel |
| area_m2 | Area in m2 of river channel mask |
| area_km2 | Area in km2 of river channel mask |
Table 5. water_mask_river_centerline_points.shp (equivalent to blue points in Figure 4)
| Attributes | Description |
|---|---|
| name | Name of river channel |
| dist_m | Downstream distance in meters for each river channel |
| point_x | Longitude of point in decimal degrees |
| point_y | Latitude of point in decimal degrees |
Table 6. river_centerline_orthogonals.shp (equivalent to black lines in Figure 4)
| Attributes | Description |
|---|---|
| name | Name of river channel |
| dist_m | Downstream distance in meters for each river channel |
| width | Orthogonal width in meters |
Table 7. water_mask_lakes.shp
| Attributes | Description |
|---|---|
| manual_mod | Manual modification: field = 1 if vector file was manually modified after visual inspection to better match color-infrared orthomosaic |
| area_m2 | Area in m2 of river channel mask |
| area_km2 | Area in km2 of river channel mask |
| lake | Numeric identifier for feature |
| gps_x | Longitude in decimal degrees of GNSS* water surface elevation survey |
| gps_y | Latitude in decimal degrees of GNSS water surface elevation survey |
| gps_doy | Day of year in 2015 of GNSS water surface elevation survey |
| gps_wse | Water surface elevation in m from GNSS survey |
| gps_err | Uncertainty in water surface elevation in m from GNSS survey |
*Global navigation satellite system (GNSS), aka differential global positioning system (DGPS)
Table 8. radar_paths.shp
| Attributes | Description |
|---|---|
| gridcode | Grid code: set to ‘1’, indicating that there is *hgt* data at this location |
| path | A unique numeric identifier for each of the 10 flight paths |
Application and Derivation
This research illustrated that AirSWOT is a useful tool for bridging the gap between field observations and forthcoming global SWOT satellite products.
Quality Assessment
Random height error from the interferometric correlation and uncertainty in water surface elevation in m from the GNSS survey are provided in the data files.
AirSWOT WSE precisions in rivers generally meet or exceed SWOT standards, however, the RMSE of 21 cm for lake WSE is less encouraging, particularly from a SWOT validation perspective. From an airborne remote sensing perspective, these precisions remain high, especially considering no additional ground calibrations were used in AirSWOT data processing. Additional calibrations such as height correction using ground-based GPS surveys could be applied to further increase the derived WSE precision (Pitcher et al., 2019).
Data Acquisition, Materials, and Methods
Study area
The study area was the Yukon Flats Basin (YFB), a protected wetland area within the Yukon Flats National Wildlife Refuge, which straddles the Arctic Circle. The area is crossed by a large anabranching reach of the Yukon River and a network of tributary channels, all referred to as rivers.
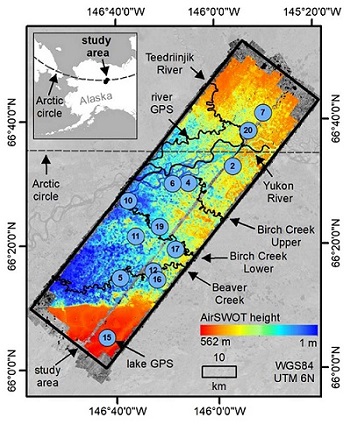
Figure 2. Map of study area in the Yukon Flats Basin (YFB), eastern interior Alaska, USA. The rivers (named) and lakes (numbered circles) are the locations of water surface elevation (WSE) surveys. The dashed gray line denotes the Arctic circle boundary. Image is from Pitcher et al. (2019).
In situ surface water elevation measurements
The Yukon River water surface elevation (WSE) global positioning system (GPS) survey data were collected along with reaches of tributaries -- Birch Creek-Upper, Birch Creek-Lower, Beaver Creek, and the Teedriinjik River (Figure 2) WSE was measured using a custom engineered GPS system on 15 June 2015, coincident with the AirSWOT overflight. A custom GPS system and a pressure transducer system were used to survey the WSE of 13 lakes across the YFB between 27 May 2015 and 12 June 2015. The lake locations (blue circles with numeric identifiers) are shown in Figure 2.
In situ WSE data are available in Pitcher et al. (2019).
AirSWOT radar data
On June 15, 2015 AirSWOT color-infrared digital images and Ka-band 35.75GHz radar interferometry data were collected over an area approximately 3,300 km2 of the YFB from a Beechcraft Super King Air B200 aircraft from an altitude of >8,770 m. The study area was mapped using 10 AirSWOT overpasses resulting in 10 individual flight paths. AirSWOT uses a Ka-band (8.4 mm wavelength) interferometer to collect topographic information of water and land surfaces. For each path, data layers for the radar signal-to-noise ratio, magnitude, noise equivalent radar backscatter, error, incidence angle, and interferometric derived heights are provided. All radar data were processed by the AirSWOT processing group at NASA’s Jet Propulsion Laboratory (JPL) using custom, AirSWOT specific, software.
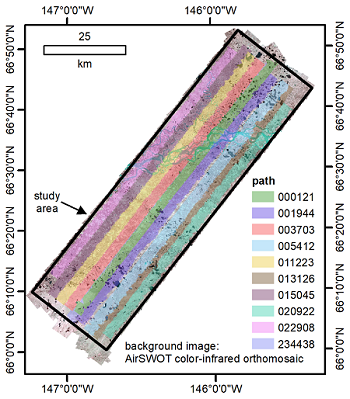
Figure 3: AirSWOT radar data was collected as 10 individual flight transects or paths, each path has a unique 6-digit numeric identifier.
Please note that the *mag*, *nesig0* and *snr* files for path 003703 have been updated from those used in Pitcher et al (2019) in order to correct an inconsistency in file geolocation. That is, an inconsistency in the originally used header file for the *mag* layer resulted in a spatial offset that translated during creation of the *snr* file (which is computed as the difference between *mag* and *nesig0*). This update does not alter the *hgt*, *inc*, or *err* layers for path 003703 that are also used in Pitcher et al (2019).
Water masks
An open water mask was generated separately for lake and wetland water bodies and river channels using the CIR data to select only open water pixels from the radar data. A statistical outlier filter was applied that removed AirSWOT water surface elevation (WSE) pixels >3 median absolute deviations from the median, and then the median value of remaining pixels in each lake was calculated. The AirSWOT CIR open water mask over rivers was used to extract only water pixels from the KaSPAR data. Cross section segments orthogonal to the river centerline and average AirSWOT WSE along each orthogonal cross section were generated. The centerline was created using ChanGeom v0.3 as described in Fisher et al. (2013). The output from ChanGeom is a raster file with pixel values corresponding to downstream distances starting from the upstream end of the water mask. Note that only a subset of river reaches in the YFB were investigated. Therefore, river channel masks do not cover all river channels in the YFB study area extent and were also manually modified to be single-thread.
For orthogonal and downstream spatial averaging in river channels, both channel centerlines and channel orthogonals were established at right angles to the centerline. Orthogonal polylines spanning the width of a river mask at 3.6 m downstream spacing along the river centerline were generated by calculating the negative reciprocal of the slope between downstream centerline points and extending a polyline from a centerline pixel across the river. Lastly, the derived orthogonal cross sections were intersected with AirSWOT data for spatial averaging along the length of the cross section (refer to Figure 4).
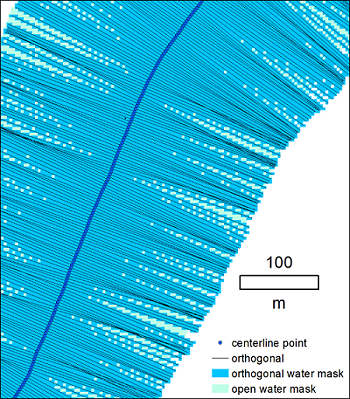
Figure 4: Schematic showing open water mask (teal) clipped to orthogonal pixels (blue), orthogonal polylines drawn perpendicular to channel centerline (black), and points along the channel centerline (blue).
Color-infrared orthomosaic
Camera system and data processing:
- AirSWOT color-infrared images were collected with a 16 MP Cirrus Digital Systems camera.
- The camera was mounted within the pressurized cabin of NASA aircraft #801, a B200 King Air, and was enclosed within a box sealed by thick glass that the camera records data through.
- The camera was mounted with a 12.43-degree look angle to match the view angle and footprint of AirSWOT.
- The camera was deployed with a Zeiss 60 mm focal length lens, resulting in a 34 x 34-degree field of view.
- The orthomosaic was produced using Agisoft photogrammetric software.
- For comparison with AirSWOT radar data, the 33 quadrangles were mosaicked into one orthomosaic, projected into a WGS-1984 UTM-6N projection and resampled into a 3.6-m x 3.6-m pixel size to match the AirSWOT radar pixel size.

Figure 5: Color-infrared orthomosiac generated using AgiSoft photogrammetric software from digital images collected on June 15, 2015 coincident with radar data collection. Lakes and wetlands are shown as black and rivers are blue.
Refer to Pitcher et al. (2019) for additional details.
Data Access
These data are available through the Oak Ridge National Laboratory (ORNL) Distributed Active Archive Center (DAAC).
ABoVE: AirSWOT Radar, Orthomosaic, and Water Masks, Yukon Flats Basin, Alaska, 2015
Contact for Data Center Access Information:
- E-mail: uso@daac.ornl.gov
- Telephone: +1 (865) 241-3952
References
Fisher, G. B., Bookhagen, B., and Amos, C. B. (2013). Channel planform geometry and slopes from freely available high-spatial resolution imagery and DEM fusion: Implications for channel width scalings, erosion proxies, and fluvial signatures in tectonically active landscapes. Geomorphology, 194, 46– 56. https://doi.org/10.1016/j.geomorph.2013.04.011
Pitcher, L.H, Pavelsky, T.M., Smith, L.C., Moller, D.K., Altenau, E.H., Allen, G.H., Lion, C., Butman, D., Cooley, S.W., Fayne, J., and M. Bertram. (2019). AirSWOT InSAR mapping of surface water elevations and hydraulic gradients across the Yukon Flats Basin, Alaska. Water Resources Research, 55. https://doi.org/10.1029/2018WR023274