Documentation Revision Date: 2019-01-25
Data Set Version: 1
Summary
The burned area algorithm (Pu et al., 2007) was developed using the Hotspot and NDVI Differencing Synergy (HANDS) mapping method (Fraser et al., 2000). The algorithm incorporates pre- and post-burn hotspot detections and NDVI fluctuations to confirm the presence of a fire. Regional NDVI thresholds are applied to create burned scar patches. The hotspot dataset provided an indication of the date-of-occurrence of active fires within the monitored fire season while the burned area data provide a spatial estimate of the cumulative area-burned for the year.
There are 24 shape files provided in this dataset (compressed as .zip files) representing the annual total burned areas and the daily hot spot areas as vector polygons for each of the 12 years of data. Burned area and hotspots are provided as separate files. Shapefiles are also provided as 24 separate .kmz files for viewing in Google Earth.
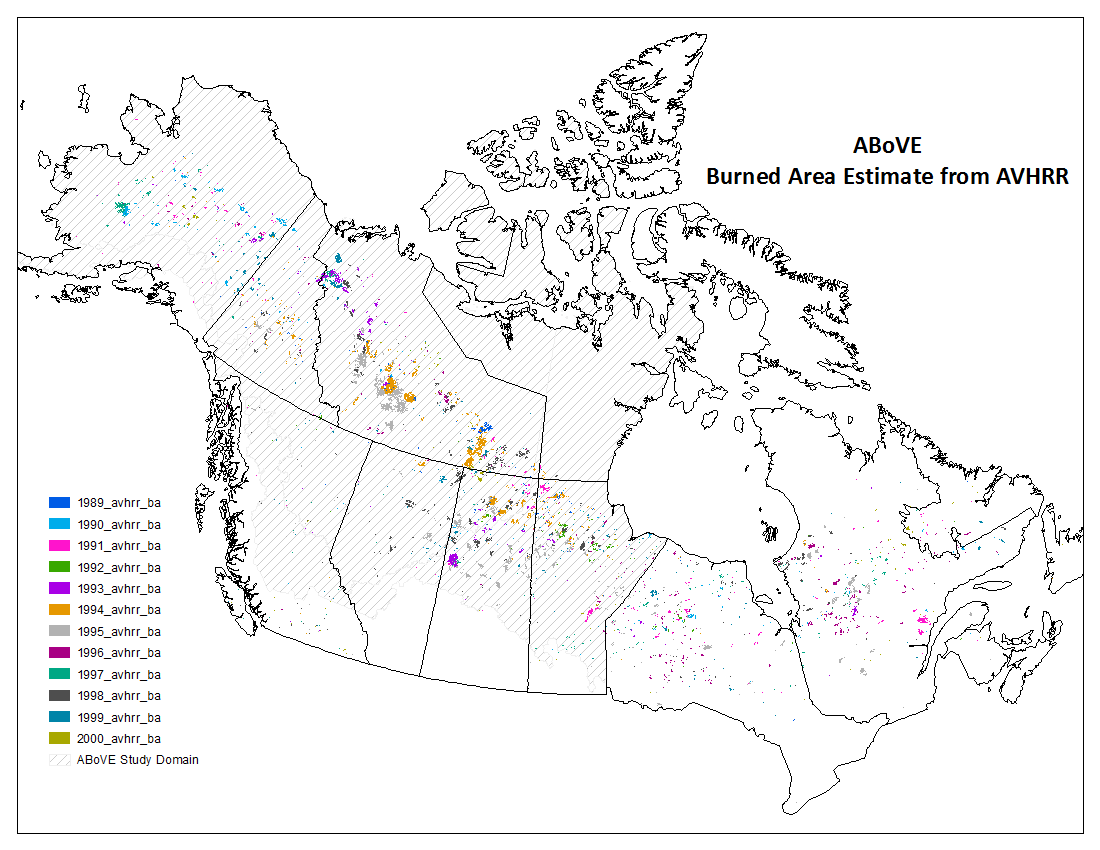
Figure 1: The ABoVE study domain showing cumulative annual burned areas derived from AVHRR for 1989 - 2000.
Citation
Pu, R., Z. Li, P. Gong, I.A. Csiszar, R. Fraser, W.M. Hao, S. Kondragunta, T.V. Loboda, J.V. Hall, and V.S. Shevade. 2018. ABoVE: AVHRR-Derived Forest Fire Burned Area-Hot Spots, Alaska and Canada, 1989-2000. ORNL DAAC, Oak Ridge, Tennessee, USA. https://doi.org/10.3334/ORNLDAAC/1545
Table of Contents
- Data Set Overview
- Data Characteristics
- Application and Derivation
- Quality Assessment
- Data Acquisition, Materials, and Methods
- Data Access
- References
Data Set Overview
This dataset provides annual forest fire burned area and daily hotspot products developed using data acquired from the Advanced Very-High-Resolution Radiometer (AVHRR) instruments carried aboard two NOAA polar-orbiting satellites (NOAA-11 and NOAA-14). The fire products were generated over 12 fire seasons (1st May - 31st October) from 1989-2000 across North America and subset to the ABoVE spatial domain of Alaska and Canada at 1-km resolution.
The burned area algorithm (Pu et al., 2007) was developed using the Hotspot and NDVI Differencing Synergy (HANDS) mapping method (Fraser et al., 2000). The algorithm incorporates pre- and post-burn hotspot detections and NDVI fluctuations to confirm the presence of a fire. Regional NDVI thresholds are applied to create burned scar patches. The hotspot dataset provided an indication of the date-of-occurrence of active fires within the monitored fire season while the burned area data provide a spatial estimate of the cumulative area-burned for the year
Note that the designated standard projection for the all ABoVE products is the Canadian Albers Equal Area projection.
Project: Arctic-Boreal Vulnerability Experiment (ABoVE)
ABoVE is a NASA Terrestrial Ecology Program field campaign that will take place in Alaska and western Canada between 2016 and 2021. Climate change in the Arctic and Boreal region is unfolding faster than anywhere else on Earth, resulting in reduced Arctic sea ice, thawing of permafrost soils, decomposition of long-frozen organic matter, widespread changes to lakes, rivers, coastlines, and alterations of ecosystem structure and function. ABoVE seeks a better understanding of the vulnerability and resilience of ecosystems and society to this changing environment.
Data Characteristics
Spatial Coverage: ABoVE study domain: including all of Alaska and all provinces of Canada
Spatial Resolution: 1-km vector polygon
Temporal Coverage: The dataset covers the period 19890501 – 20001031
Temporal Resolution: Daily hotspots and annual burn area
Study Area: (All latitude and longitude given in decimal degrees.)
| Site |
Westernmost Longitude |
Easternmost Longitude |
Northernmost Latitude |
Southernmost Latitude |
|---|---|---|---|---|
| ABoVE Study Domain | -165.186111 | -53.167758 | 69.007032 | 41.721594 |
Data File Information
There are 24 shapefiles (compressed in .zip format) provided in this dataset.
There are two sets of data; 12 files with fire season daily hotspots estimated from AVHRR thermal reflectance spectral signatures, one for each year 1989 - 2000; and 12 files with estimates of cumulative burn area for the fire season, one for each year 1989 - 2000. The shapefile data are also provided as companion files in .kmz format for viewing in Google Earth.
File names follow this syntax:
YYYY_avhrr_xx.zip
where: YYYY = year
xx = either ba for burned area or hs for hotspot data
Attributes for the hotspot files
| Variable | Unit | Description |
|---|---|---|
| YYYYMMDD | Date mapped for the hotspot |
Attributes for the burned area files
| Variable | Unit | Description |
|---|---|---|
| Area_ha | hectares | Burned area in hectares |
| Area_ac | acres | Burned area in acres |
Spatial Reference Properties:
A Standard Projection has been chosen for all ABoVE data products.
Projected Geographic Coordinate Reference: GCS_North_American_1983
Projection: Albers Equal Area Conic
The Canadian Albers Equal Area Conic projection system and parameters:
WKID (EPSG): 102001 Authority: ESRI
PROJCS["Canada_Albers_Equal_Area_Conic",
GEOGCS["GCS_North_American_1983",
DATUM["North_American_Datum_1983",
SPHEROID["GRS_1980",6378137.0,298.257222101]],
PRIMEM["Greenwich",0.0],
UNIT["Degree",0.0174532925199433]],
PROJECTION["Albers_Conic_Equal_Area"],
PARAMETER["False_Easting",0.0],
PARAMETER["False_Northing",0.0],
PARAMETER["longitude_of_center",-96.0],
PARAMETER["Standard_Parallel_1",50.0],
PARAMETER["Standard_Parallel_2",70.0],
PARAMETER["latitude_of_center",40.0],
UNIT["Meter",1.0]]
A companion user guide is provided:
AVHRR_Fire_Product_User_Guide.pdf: This user guide provides additional assessments not found in this guide comparing yearly burned area from the Alaskan Interagency Coordination Center and Natural Resources Canada and the AVHRR burned area product.
Application and Derivation
Provide temporal evolution and spatial expansion of forest fires in the boreal and temperate forests which can be useful in modeling fire emissions and also evaluate whether the boreal forests serve as a sink or source in global carbon cycling. This dataset can help to quantify fire emissions such as CO2, CO, CH4, PM2.5 (particulate matter < 2.5 μm in diameter) and PM10 (particulate matter < 10 μm in diameter) which requires accurate measurements of fuel consumption and burned area. This dataset improves the understanding of annual fire point locations and the spatial distribution and temporal variation of fires in the ABoVE spatial domain. Exploits the long historical archive at a spatial resolution suitable for regional-scale studies by processing daily AVHRR 1-km datasets to develop a coherent long-term forest fire inventory over a period of 12 years (May through October from 1989 to 2000).
Quality Assessment
Overall, the AVHRR burned area product provides a consistently reasonable estimate of area burned over Alaska and Canada both cumulatively and per individual burn scar with R2 exceeding 0.8 in 10 out of 12 years. Although the AVHRR based estimate of area burned are consistently lower than that reported by the Alaskan Interagency Coordination Center and Natural Resources Canada, the established statistical relationships allow for developing robust adjustment factors.
Known Caveats:
- 1994 burned area comprises of data from 1st May – 13th September.
- 1997 hotspots and burned area contain anomalous stripes over eastern-central Canada leading to an overestimation in burned area.
Pu et al. (2007) report a geometric correction pixel location accuracy as better than 1 km, but varies with the density of georeferenced images. In comparison with ground observations, omission and commission errors are approximately 20%.
The quality of the burned area data generated by the HANDS method (Fraser et al., 2000) was assessed using the wildfire burned area point dataset of the National Fire Occurrence Database (NFOD: http://www.fs.fed.us/fire/fuelman) maintained by the Fire Science Laboratory, the Rocky Mountain Research Station, and the U.S. Forest Service for the period of May through October in 1996.
Data Acquisition, Materials, and Methods
AVHRR data acquired by two NOAA polar orbiting satellites (NOAA-11 and NOAA-14) were employed to generate the fire history over North America for the period May 1 to October 31 in each year from 1989 to 2000 (except for 1994 when the period analyzed was May 1 to September 13). The AVHRR data for 1994 were received from the Canada Centre for Remote Sensing and all other AVHRR data were downloaded from the NOAA Satellite Active Archive. All AVHRR data were acquired in the afternoon with the local crossing time ranging from 12:00 to 16:00.
The Geocomp-N satellite data processing and retrieval system (Cihlar et al., 2002) was used to geocode and composite daily NOAA/AVHRR data. In the geocoding stage, radiometric correction and calibration and spatial geometric corrections are conducted on data in 5 AVHRR channels using a calibration auxiliary file, an orbit parameter file, as well as georeferenced chip images. Calibration for visible (Ch1) and near-IR (Ch2) measurements employs time-dependent offset and gain values recommended by Rao and Chen (1996). The thermal AVHRR channels (Ch3-5) are calibrated using an onboard blackbody reference. The original AVHRR data, having a variable pixel size, were re-sampled to a constant 1-km resolution. NA-wide composites are registered to the Lambert Conformal Conic projection using an orbital model and high-resolution Landsat Thematic Mapper image chips.
A hybrid burn mapping method, dubbed Hotspot and NDVI Differencing Synergy (HANDS), was primarily used in this study while the methods of Li et al., 2003, 2000a were used to initially detect active fires. Major features of the method are described as follows (Fraser et al., 2000). The algorithm takes advantage of both hotspot detection and changes in NDVI (or other vegetation index) before and after burning. First, the detected hotspots are confirmed as real fires if there are significant decreases in NDVI in the subsequent year. Second, the NDVI difference statistics (mean and standard deviation) are computed from the confirmed active fires and are used to identify potential burned pixels. Third, regional thresholds are executed to reclaim the missing burned pixels. Finally, pixels passing regional thresholds are connected to create burned scar patches. Any burned patches that contain less than 5% of confirmed hotspot pixels are removed because, for this case, we assume that the NDVI decrease is caused by other factors, such as seasonal vegetation senescence, drought timber harvesting, image misregistration, and cloud contamination.
After the AVHRR data were geocoded and composited, the modified active fire detection algorithm (Li et al., 2003, 2000) was first applied to detect hotspots from daily AVHRR data throughout the 1989–2000 fire seasons. The hotspots and NDVI maximum values obtained for the same month but in two consecutive years (for yearly or seasonal burn scar mapping) or two consecutive months (for monthly burn scar mapping) were composited and the HANDS algorithm (Fraser et al., 2000) was applied. Monthly burned areas were computed from May through October and were accumulated to obtain yearly burned areas. Burn scar results for the 6 months across the 12 years (1989–2000) were obtained except for 1994 where burn scar results for May through August were included.
Data Access
These data are available through the Oak Ridge National Laboratory (ORNL) Distributed Active Archive Center (DAAC).
ABoVE: AVHRR-Derived Forest Fire Burned Area-Hot Spots, Alaska and Canada, 1989-2000
Contact for Data Center Access Information:
- E-mail: uso@daac.ornl.gov
- Telephone: +1 (865) 241-3952
References
Cihlar, J., Chen, J., Li, Z., Latifovic, R., Fedosejevs, G., Adair, M., et al. (2002). GeoComp-N, An advanced system for the processing of coarse and medium resolution satellite data. Part 2: Biophysical products for northern ecosystems. Canadian Journal of Remote Sensing, 28, 21−44.
Fraser, R. H., Li, Z., & Cihlar, J. (2000). Hotspot and NDVI differencing synergy (HANDS): A new technique for burned area mapping over boreal forest. Remote Sensing of Environment, 74(3), 362-376.
Li, Z., Fraser, R., Jin, J., Abuelgasim, A. A., Csiszar, I., Gong, P., et al. (2003). Evaluation of algorithms for fire detection and mapping across North America from satellite. Journal of Geophysical Research, 108(D2), 4076. doi:10.1029/2001JD001377.
Li, Z., Nadon, S., & Cihlar, J. (2000). Satellite detection of Canadian boreal forest fires: Development and application of an algorithm. International Journal of Remote Sensing, 21, 3057−3069.
Pu, R., Li, Z., Gong, P., Csiszar, I., Fraser, R., Hao, W. M., Kondragunta & Weng, F. (2007). Development and analysis of a 12-year daily 1-km forest fire dataset across North America from NOAA/AVHRR data. Remote sensing of environment, 108(2), 198-208. http://dx.doi.org/10.1016/j.rse.2006.02.027
Rao, C.R.N. and J. Chen Post-launch calibration of the visible and near-infrared channels of the Advanced Very High Resolution Radiometer on NOAA-14 spacecraft. International Journal of Remote Sensing, 17 (1996), pp. 2743-2747