Documentation Revision Date: 2024-03-25
Dataset Version: 1
Summary
This dataset holds three files in cloud optimized GeoTIFF format.
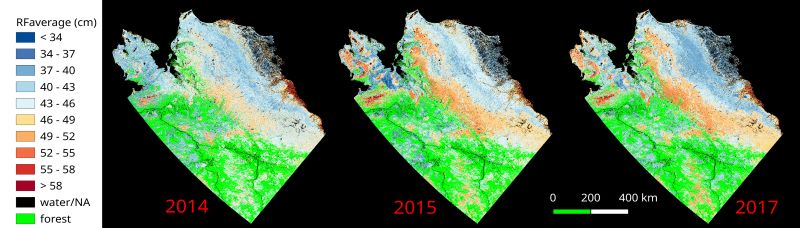
Figure 1. Maps of active layer thickness (ALT) for northern Alaska in 2014, 2015, and 2017 estimated from P-band PolSAR imagery analyzed using a random forests (RF) machine learning regression algorithm.
Citation
Whitcomb, J., R.H. Chen, D. Clewley, J. Kimball, N.J. Pastick, Y. Yi, and M. Moghaddam. 2024. ABoVE: Upscaled Active Layer Thickness in Northern Alaska, 2014-2017. ORNL DAAC, Oak Ridge, Tennessee, USA. https://doi.org/10.3334/ORNLDAAC/2332
Table of Contents
- Dataset Overview
- Data Characteristics
- Application and Derivation
- Quality Assessment
- Data Acquisition, Materials, and Methods
- Data Access
- References
Dataset Overview
The dataset consists of maps of estimated Active Layer Thickness (ALT) at 30-m resolution throughout the northern half of Alaska for the years 2014, 2015, and 2017. The maps are generated by using a machine learning-based regression and a set of spatial data layers to upscale ALT from narrow swaths of ALT that were retrieved from high-resolution P-band Polarimetric Synthetic Aperture Radar (PolSAR) imagery.
Project: Arctic-Boreal Vulnerability Experiment (ABoVE)
The Arctic-Boreal Vulnerability Experiment (ABoVE) is a NASA Terrestrial Ecology Program field campaign being conducted in Alaska and western Canada, for 8 to 10 years, starting in 2015. Research for ABoVE links field-based, process-level studies with geospatial data products derived from airborne and satellite sensors, providing a foundation for improving the analysis, and modeling capabilities needed to understand and predict ecosystem responses to, and societal implications of, climate change in the Arctic and Boreal regions.
Related Publication:
Whitcomb, J., R. Chen, D. Clewley, J.S. Kimball, N.J. Pastick, Y. Yi, and M. Moghaddam. 2023. Maps of active layer thickness in northern Alaska by upscaling P-band polarimetric synthetic aperture radar retrievals. Environmental Research Letters 19:014046. https://doi.org/10.1088/1748-9326/ad127f
Related Dataset:
Chen, R.H., A. Tabatabaeenejad, and M. Moghaddam. 2019. ABoVE: Active Layer and Soil Moisture Properties from AirMOSS P-band SAR in Alaska. ORNL DAAC, Oak Ridge, Tennessee, USA. https://doi.org/10.3334/ORNLDAAC/1657
- This dataset contains the narrow swaths of ALT, which were used to create the upscaled ALT.
Acknowledgments:
This project was funded by NASA's Arctic-Boreal Vulnerability Experiment (grant 80NSSC19M0114).
Data Characteristics
Spatial Coverage: northern Alaska
ABoVE Reference Locations:
Domain: Core ABoVE
State/Territory: Alaska
Grid Cells: Ah000v000, Ah000v001, Ah001v000, Ah001v001, Ah002v000
Spatial Resolution: 30 m
Temporal Coverage: 2014, 2015, and 2017
Temporal Resolution: Annual
Study Area (All latitude and longitude given in decimal degrees)
| Site | Westernmost Longitude | Easternmost Longitude | Northernmost Latitude | Southernmost Latitude |
|---|---|---|---|---|
| Alaska | -171.803 | -133.048 | 74.720 | 59.349 |
Data file information
This dataset provides ALT estimates in three cloud-optimized GeoTIFF (.tif) files.
The file naming convention is upscaled_alt_<year>.tif, where <year> is 2014, 2015, or 2017.
GeoTIFF characteristics:
- Coordinate system: ABoVE Standard Projection (NAD 1983 Albers Canada), EPSG 102001,
PROJ4: "+proj=aea +lat_1=50 +lat_2=70 +lat_0=40 +lon_0=-96 +x_0=0 +y_0=0 +ellps=GRS80 +units=m +no_defs" - Spatial resolution: 30 m
- 41,333 rows x 40,000 columns
- Pixel values: >0.0 to <1.00 = Active layer thickness in meters. 1.0 = open water, 2.0 = forest.
- No data value = -9999
Application and Derivation
The maps were used to investigate regional patterns and underlying physical controls affecting permafrost degradation in the tundra biome. They offer a new source of insights into the influence of climate, land cover, and terrain factors affecting active layer development and permafrost stability in the Arctic.
Quality Assessment
The accuracies of the maps were validated by calculating error performance statistics including root-mean-square error (RMSE), bias, and unbiased RMSE (ubRMSE). In an initial validation step, thousands of randomly selected samples of SAR-derived active layer thickness (ALT) estimates were excluded from training in order to serve as validation pixels; error performance calculations relative to these samples yielded RMSEs of 7.5-9.1 cm and bias errors of magnitude less than 0.1 cm. The maps were then validated by comparison to field based ALT measurements collected at a number of in situ test sites; error performance relative to the site measurements yielded RMSEs of approximately 11-12 cm and bias of 2.7-6.5 cm.
Since these maps were generated by training a regression based on samples taken from PolSAR-derived swaths of ALT, they are constrained by the limited penetration depth of P-band PolSAR in Arctic soils. This depth limits the maximum value of upscaled ALT attainable in the maps to no more than about 65 cm. Although this depth is deep enough for most locations in northern Alaska, it is too shallow for many areas south of the Brooks Range. Also, the error performance of our maps is bounded by that of the PolSAR-derived ALT data used for model training, which limits the utility of the maps for detecting inter-annual variability and longer-term climate trends.
Data Acquisition, Materials, and Methods
The maps were produced by upscaling from high-resolution swaths of estimated ALT retrieved from airborne P-band PolSAR images collected for three different years: 2014, 2015, and 2017. The upscaling was accomplished by repeated runs of the Random Forests (RF) ensemble decision tree algorithm, with each run constructing a regression model expressing ALT as a nonlinear function of numerous independent spatial variables. The regression is trained using hundreds of thousands of samples randomly selected from the PolSAR-derived ALT swaths.
See Whitcomb et al. (2023) for additional details.
Data Access
These data are available through the Oak Ridge National Laboratory (ORNL) Distributed Active Archive Center (DAAC).
ABoVE: Upscaled Active Layer Thickness in Northern Alaska, 2014-2017
Contact for Data Center Access Information:
- E-mail: uso@daac.ornl.gov
- Telephone: +1 (865) 241-3952
References
Chen, R.H., A. Tabatabaeenejad, and M. Moghaddam. 2019. ABoVE: Active Layer and Soil Moisture Properties from AirMOSS P-band SAR in Alaska. ORNL DAAC, Oak Ridge, Tennessee, USA. https://doi.org/10.3334/ORNLDAAC/1657
Whitcomb, J., R. Chen, D. Clewley, J.S. Kimball, N.J. Pastick, Y. Yi, and M. Moghaddam. 2023. Maps of active layer thickness in northern Alaska by upscaling P-band polarimetric synthetic aperture radar retrievals. Environmental Research Letters 19:014046. https://doi.org/10.1088/1748-9326/ad127f