Documentation Revision Date: 2022-05-31
Dataset Version: 1.1
Summary
This is Version 1.1 of this dataset. This version contains updates to 36 files. Additional details can be found in Section 8. Dataset Revisions.
There are 280 data files included in this dataset. 168 files in Cloud-Optimized GeoTIFF (*.tif) format, 56 color map (*.clr) files that serve as a default symbolization for use in ArcGIS software with the top cover maps and 56 dBASE (*.dbf) files containing raster attribute tables, specifically frequency distribution tables (count of the number of pixels for each value), that can be associated with the top cover maps in ArcGIS software.
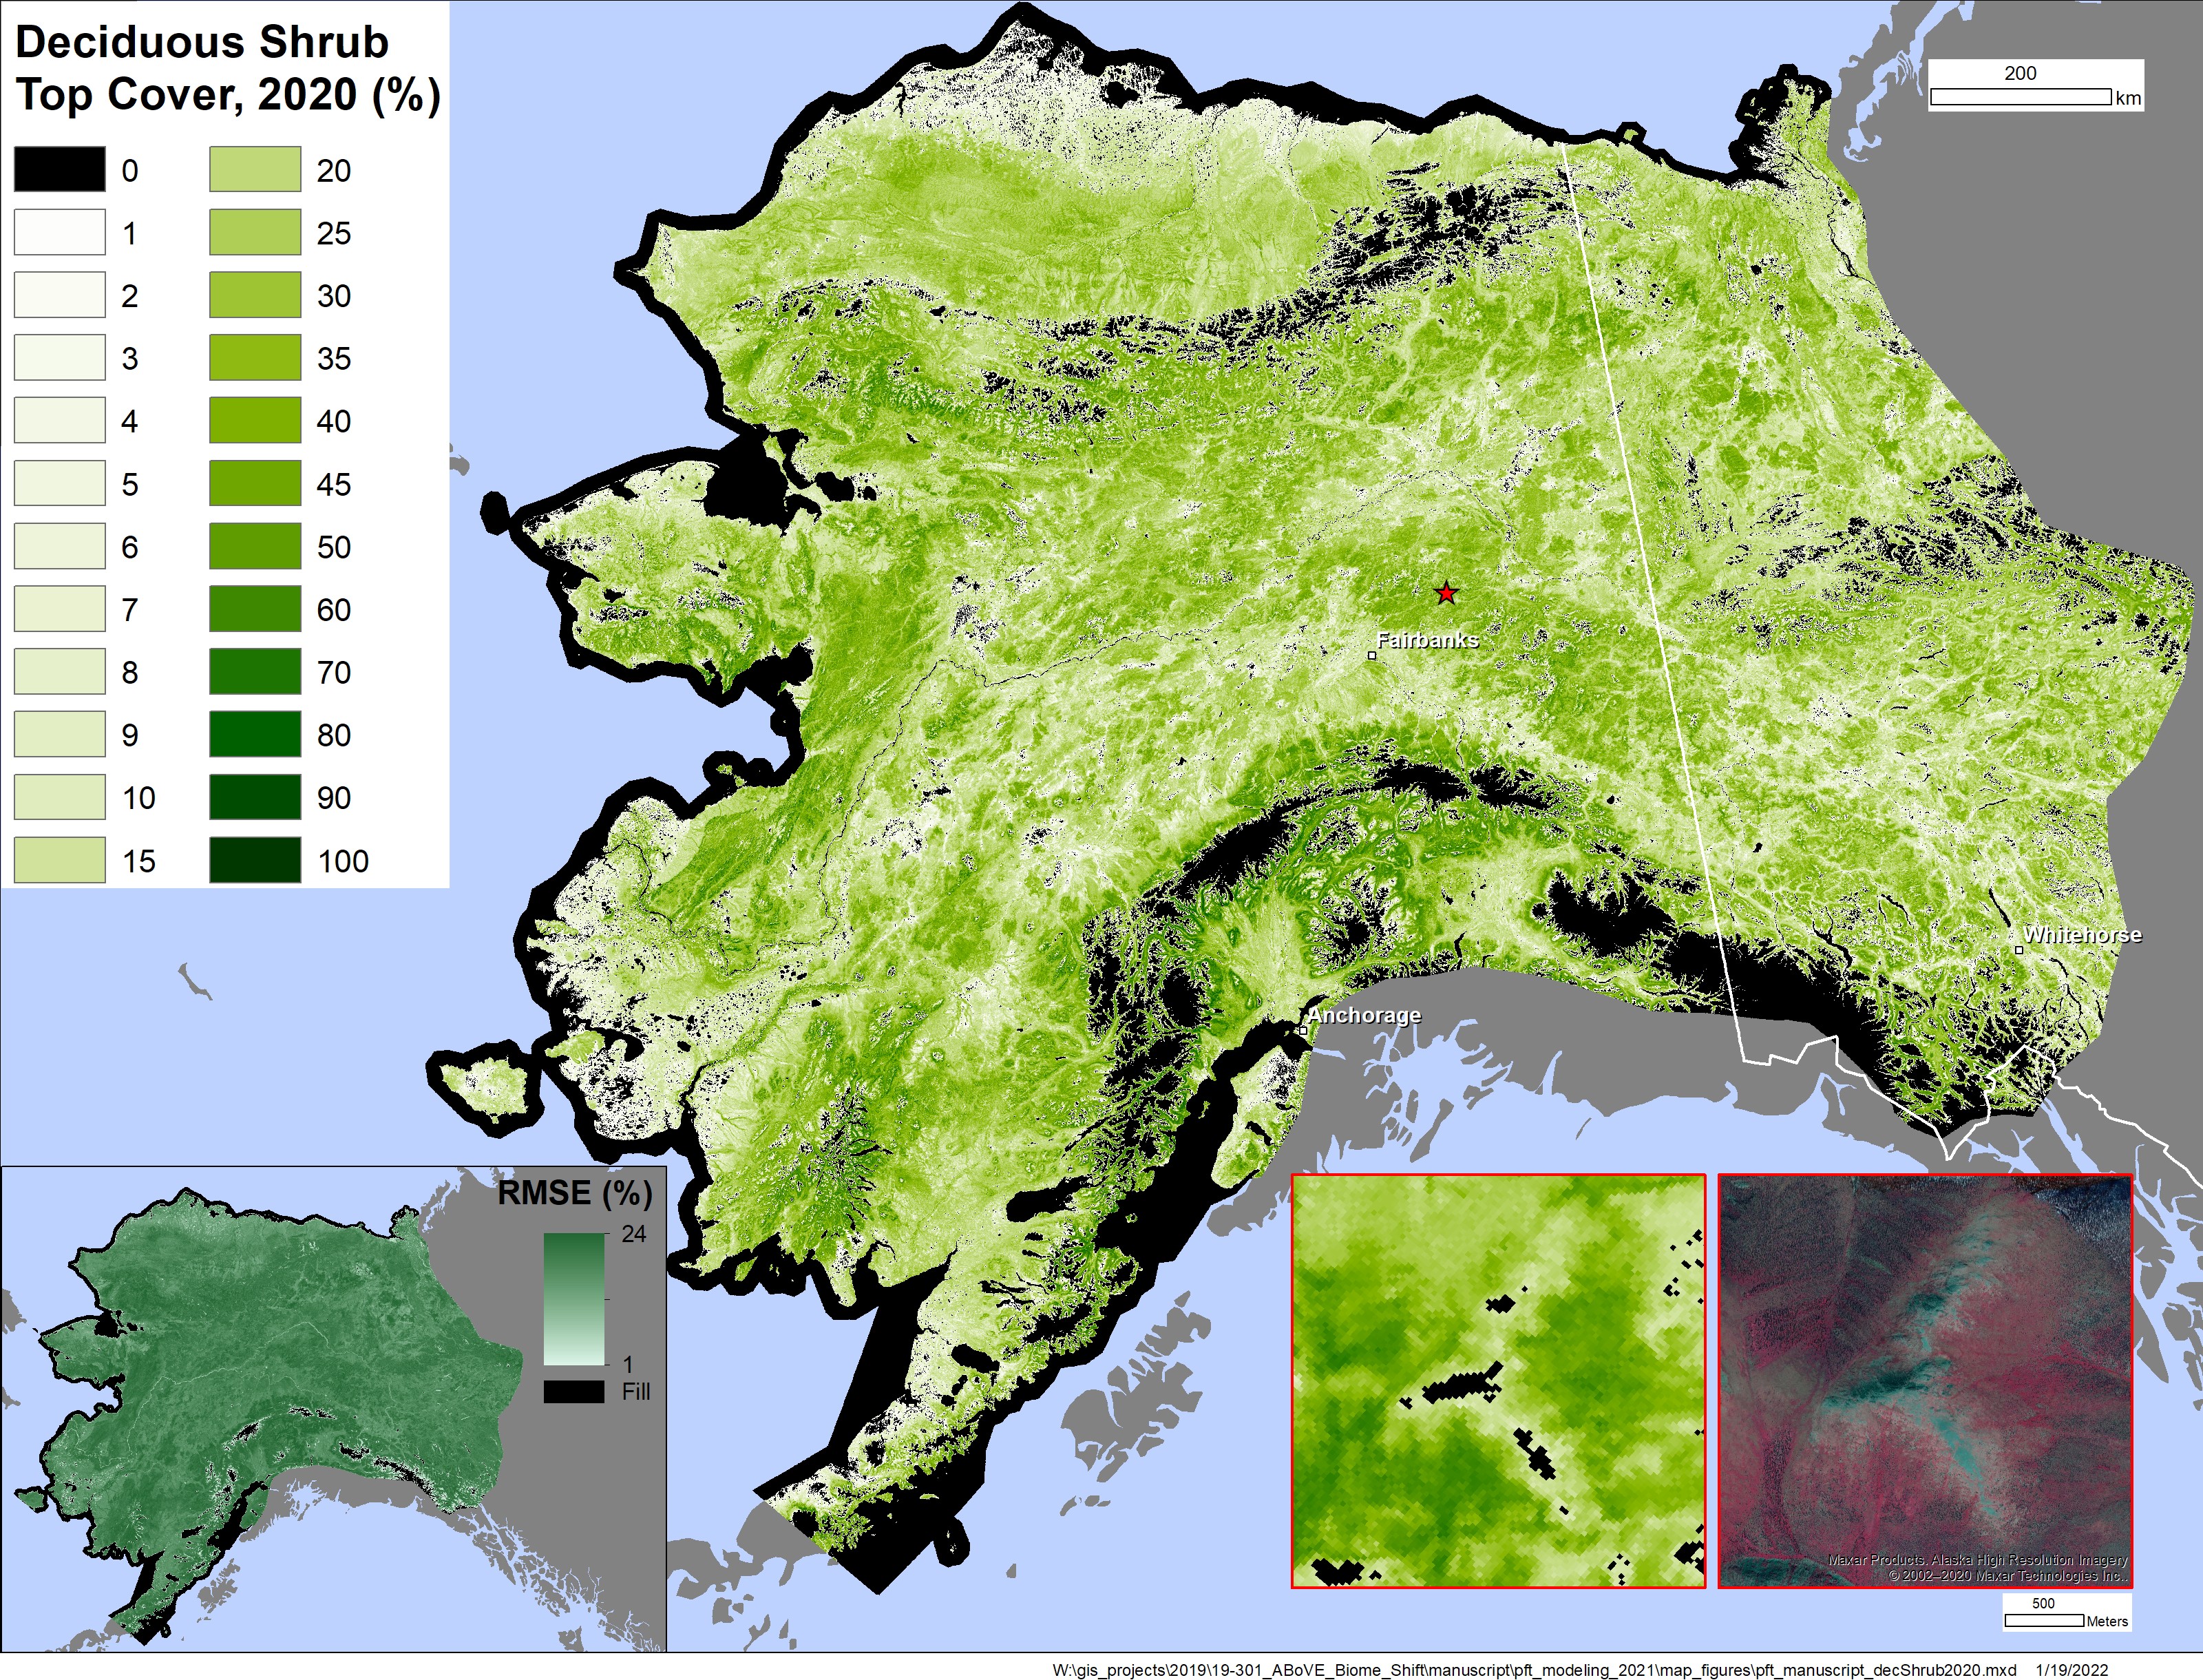
Figure 1. Map of deciduous shrub top cover over the study region in 2020.
Citation
Macander, M.J., and P.R. Nelson. 2022. ABoVE: Modeled Top Cover by Plant Functional Type over Alaska and Yukon, 1985-2020. ORNL DAAC, Oak Ridge, Tennessee, USA. https://doi.org/10.3334/ORNLDAAC/2032
Table of Contents
- Dataset Overview
- Data Characteristics
- Application and Derivation
- Quality Assessment
- Data Acquisition, Materials, and Methods
- Data Access
- References
- Dataset Revisions
Dataset Overview
This dataset contains GeoTIFF (*.tif) data files of modeled top cover estimates by plant functional type (PFT) for the Arctic and Boreal Alaska and Yukon regions. Estimates are presented for single years at 5-year intervals from 1985 to 2020. Also included are root mean square error (RMSE) and source year, which indicate the specific year from which pixels in the top cover maps were derived. Plant functional types include conifer trees, broadleaf trees, deciduous shrubs, evergreen shrubs, graminoids, forbs, and light macrolichens. Estimates were derived through the combination of two stochastic gradient-boosting models that used environmental and spectral covariates. Environmental covariates represented topographic, climatic, permafrost, hydrographic, and phenological gradients, and spectral covariates were based on Landsat Thematic Mapper (TM), Enhanced Thematic Mapper Plus (ETM+), and Operational Land Imager (OLI) data collected between 1984–2020. These maps catalog widespread changes in the distribution of PFTs occurring in the Arctic and boreal forest ecosystems, such as tundra shrub expansion, due to the intensification of disturbances such as fire and climate-driven vegetation dynamics.
Project: Arctic-Boreal Vulnerability Experiment
The Arctic-Boreal Vulnerability Experiment (ABoVE) is a NASA Terrestrial Ecology Program field campaign being conducted in Alaska and western Canada, for 8 to 10 years, starting in 2015. Research for ABoVE links field-based, process-level studies with geospatial data products derived from airborne and satellite sensors, providing a foundation for improving the analysis, and modeling capabilities needed to understand and predict ecosystem responses to, and societal implications of, climate change in the Arctic and Boreal regions.
Related Publication
Macander, M.J., P.R. Nelson, T. Nawrocki, G.V. Frost, K. Orndahl, E.C. Palm, A.F. Wells, and S.J. Goetz. 2022. Time-series maps reveal widespread change in plant functional type cover across arctic and boreal Alaska and Yukon. In Environmental Research Letters. IOP Publishing. https://doi.org/10.1088/1748-9326/ac6965
Related Datasets
Wang, J.A., D. Sulla-Menashe, C.E. Woodcock, O. Sonnentag, R.F. Keeling, and M.A. Friedl. 2019. ABoVE: Landsat-derived Annual Dominant Land Cover Across ABoVE Core Domain, 1984-2014. ORNL DAAC, Oak Ridge, Tennessee, USA. https://doi.org/10.3334/ORNLDAAC/1691.
- Contains maps of Landsat-derived dominant land cover classes across Alaska and Canada.
Data Characteristics
Spatial Coverage: Alaska, USA; and Yukon Territory, Canada
ABoVE Reference Locations
Domain: Core
State/Territory: Alaska and Yukon
Grid cells: Bh000v002, Bh003v002, Bh004v002, Bh005v002, Bh006v002, Bh007v002, Bh008v002, Bh009v002, Bh003v001, Bh004v001, Bh005v001, Bh006v001, Bh007v001, Bh008v001, Bh001v002, Bh002v002, Bh000v003, Bh001v003, Bh002v003, Bh006v003, Bh007v003, Bh008v003, Bh009v003, Bh003v003, Bh004v003, Bh005v003, Bh001v004, Bh002v004, Bh003v004, Bh004v004, Bh005v004, Bh006v004, Bh007v004, Bh008v004, Bh009v004, Bh010v004, Bh011v004, Bh000v005, Bh001v005, Bh002v005, Bh003v005, Bh004v005, Bh005v005, Bh006v005, Bh007v005, Bh008v005, Bh009v005, Bh010v005, Bh011v005, Bh000v006, Bh001v006, Bh002v006, Bh003v006, Bh004v006, Bh005v006, Bh006v006, Bh007v006, Bh008v006, Bh009v006, Bh010v006, Bh000v007, Bh001v007, Bh002v007, Bh003v007, Bh004v007, Bh005v007, Bh006v007, Bh007v007, Bh008v007, Bh009v007, Bh010v007, Bh006v008, Bh007v008, Bh008v008, Bh009v008, Bh010v008, Bh006v009, Bh007v009, Bh008v009, Bh009v009, Bh010v009, Bh006v010, Bh007v010, Bh008v010, Bh003v000, Bh004v000, Bh005v000, Bh006v000, Bh007v000
Spatial Resolution: 30 m
Temporal Coverage: 1985 to 2020
Temporal Resolution: 1 year
Study Areas: Latitude and longitude are given in decimal degrees.
| Site | Westernmost Longitude | Easternmost Longitude | Northernmost Latitude | Southernmost Latitude |
|---|---|---|---|---|
| Alaska and Canada | -169.50 | -128.50 | 71.80 | 55.50 |
Data File Information
There are 280 data files included in this dataset. 168 files in Cloud-Optimized GeoTIFF (*.tif) format consisting of three types of data: top cover maps, root mean square error (RMSE) maps, and source year maps. 56 color map (*.clr) files that serve as a default symbolization for use in ArcGIS software with the top cover maps and 56 dBASE (*.dbf) files containing raster attribute tables, specifically frequency distribution tables (count of the number of pixels for each value), that can be associated with the top cover maps in ArcGIS software.
Files are named ABoVE_PFT_File_Type_PFT_Name_Year.tif (e.g., ABoVE_PFT_Top_Cover_DeciduousShrub_2020.tif), where:
- File_Type is Top_Cover, RMSE, or SourceYear
- PFT_Name indicates the type of PFT (plant functional type)
- Year indicates the nominal year of the estimate, though the value in the source year raster may indicate that the data for specific pixels was derived from a different year. The estimates are derived from spectral data for a specific year, not a 5-year period.
Table 1. File names and descriptions.
| File Name | Description |
|---|---|
| ABoVE_PFT_Top_Cover_PFT_Name_Year.tif | Top cover maps contain model-derived estimates of top cover for seven PTFs (conifer trees, broadleaf trees, deciduous shrubs, evergreen shrubs, graminoids, forbs, and light macrolichens). Values indicate the percent of top cover (0–100). There are 56 top cover maps (7 PFTs X 8 time increments). |
| ABoVE_PFT_RMSE_PFT_Name_Year.tif | RMSE maps show the RMSE of top cover estimates. Values indicate RMSE in units of % top cover. There are 56 RMSE maps. |
| ABoVE_PFT_SourceYear_PFT_Name_Year.tif | Source year maps contain the year for each pixel in the top cover maps. Values represent number of years since 1900 where a prediction was made (i.e. a value of 85 represents 1985). Zero is a special value indicating that predictors were missing for the pixel but top cover is assumed to be zero (predictors were missing for permanent snow and some water bodies due to masking rules applied to the Landsat imagery). There are 56 source year maps. |
Data File Details
Characteristics of GeoTIFFs include:
- Projection: Canada Albers Equal Area Conic (EPSG:102001)
- 30 m raster cells in 1 band
- 65536 rows and 65536 columns
- no data value is 255
Application and Derivation
This dataset provides a 35-year time-series (1985–2020, 5 year tempo) of top cover (TC, %) for seven plant functional types (PFTs) across northern and central Alaska and northwestern Canada. Widespread changes in the distribution of PFTs are occurring in Arctic and boreal forest ecosystems due to the intensification of disturbances such as fire and climate-driven vegetation dynamics, such as tundra shrub expansion.
To understand how these changes affect boreal and tundra ecosystems, it is necessary to first quantify distribution shifts for multiple PFTs across many years. While most landscape patches are a mixture of PFTs, previous moderate resolution (30 m) remote sensing analyses have mapped vegetation distribution and change within land cover categories that are based on the dominant PFT; or else the continuous distribution of one or a few PFTs, but for a single point in time. This dataset maps top cover, a continuous measure of plant abundance, for seven PFTs and for multiple time steps. The PFTs collectively include all vascular plants within the study area (conifer trees, broadleaf trees, deciduous shrubs, evergreen shrubs, graminoids, and forbs), and light macrolichens, a nonvascular class of high importance to caribou management. The classes are separated by growth form and leaf habit to optimize detectability in optical remote sensing, and to characterize ecologically important distinctions related to vegetation dynamics and wildlife habitats.
These maps enable PFTs observed or modeled in observational and experimental studies to be more directly connected to observed changes in abundance through time. More importantly, land managers can better assess current resources and plan for future conditions through understanding changes in browse availability and habitat changes for animals, fuel for fires, or shifts towards or away from species important for human subsistence. In addition, quantitative continuous cover maps for individual PFTs improve on traditional categorical vegetation maps, which suffer limitations for temporal change detection because many vegetation shifts are likely to occur within the range of variability of a given map class, rather than with a transition from one class to another.
Quality Assessment
Spatial autocorrelation of the responses were assessed before modeling. A spatially blocked cross-validation approach (Roberts et al., 2017) was applied to mitigate bias from spatial autocorrelation in model optimization and assessment. Model performance was assessed from the predictions in independent, spatially blocked test folds. Mean absolute error (MAE), root mean square error (RMSE), bias, and R² from the observed and predicted cover values were calculated to further understand error. Accuracy and area under the receiver-operating characteristic curve (AUC) for the presence/absence predictions were also assessed.
RMSE was summarized for each 1% bin of predicted cover based on the predictions in the test folds. The value for the absence bin (0% cover) was used directly, and a smoothed loess curve was fit through the range of values from 1% to the highest predicted cover. Map predictions above the highest predicted cover from the test folds were very rare but could occur, so RMSE estimates were filled from the highest observed value to cover the full range to 100% top cover.
Data Acquisition, Materials, and Methods
A suite of environmental and spectral covariates was used for the training and prediction of the time-series PFT models. The environmental covariates represent topographic, climatic, permafrost, hydrographic, and phenological gradients across the study area; and were constant for all models. The spectral covariates are based on Landsat TM, ETM+, and OLI data collected over 1984 to 2020 and follow the approach used to derive the ABoVE land cover product (Wang et al., 2019).
Field-based vegetation cover data were compiled and normalized. These data were collected between 1994 and 2019 from a variety of sources in Alaska and Yukon, including resource management agencies, academic researchers, industry, and consultants. Data included both ocular and quantitative vegetation cover estimates collected from the ground and/or from aerial platforms (i.e., helicopters). Fractional cover derived from classified unmanned aerial systems (UAS) imagery was also included.
Spatial autocorrelation of response variables was assessed before modeling and a spatially blocked cross-validation approach (Roberts et al., 2017) was applied. Two stochastic gradient-boosting models were applied to map PFT distributions based on the training data and spatial predictors. A binary probability model was applied to map PFT distribution, and a regression model was applied to map PFT abundance. The two models were combined for a final prediction of PFT cover.
Complete details on the methodology can be found in Macander et al. (2022).
Data Access
These data are available through the Oak Ridge National Laboratory (ORNL) Distributed Active Archive Center (DAAC).
ABoVE: Modeled Top Cover by Plant Functional Type over Alaska and Yukon, 1985-2020
Contact for Data Center Access Information:
- E-mail: uso@daac.ornl.gov
- Telephone: +1 (865) 241-3952
References
Macander, M.J., P.R. Nelson, T. Nawrocki, G.V. Frost, K. Orndahl, E.C. Palm, A.F. Wells, and S.J. Goetz. 2022. Time-series maps reveal widespread change in plant functional type cover across arctic and boreal Alaska and Yukon. In Environmental Research Letters. IOP Publishing. https://doi.org/10.1088/1748-9326/ac6965
Roberts, D.R., V. Bahn, S. Ciuti, M.S. Boyce, J. Elith, G. Guillera-Arroita, S. Hauenstein, J.J. Lahoz-Monfort, B. Schröder, W. Thuiller, and D.I. Warton. 2017. Cross-validation strategies for data with temporal, spatial, hierarchical, or phylogenetic structure. Ecography 40:913-929. https://doi.org/10.1111/ecog.02881
Wang, J.A., D. Sulla-Menashe, C.E. Woodcock, O. Sonnentag, R.F. Keeling, and M.A. Friedl. 2019. ABoVE: Landsat-derived Annual Dominant Land Cover Across ABoVE Core Domain, 1984-2014. ORNL DAAC, Oak Ridge, Tennessee, USA. https://doi.org/10.3334/ORNLDAAC/1691
Dataset Revisions
| Version | Release Date | Description |
|---|---|---|
| 1.1 | 2022-05-31 |
Thirty-six Top_Cover files were replaced with an updated version. In the initial release (V1.0), these files were incomplete causing pixels to show the no data value in some areas where data values should have been present. The following files were updated:
|
| 1.0 | 2022-05-01 | Initial release of 280 data files. |