Documentation Revision Date: 2018-05-15
Data Set Version: 1
Summary
Arctic ecosystems are major global sources of methane. Year-round eddy flux observations for CH4 in the Arctic tundra over continuous permafrost were collected to address the critical knowledge gap in cold season CH4 emissions.
There are 10 data files in comma-separated (.csv) format with this data set.
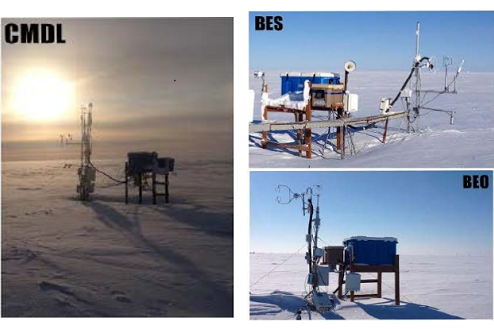
Figure 1. Three tower sites at Barrow, Alaska: Barrow Environmental Observatory (BEO) tower, Biocomplexity Experiment, South (BES) tower, and the Climate Monitoring and Diagnostics Laboratory (CMDL) tower.
Citation
Oechel, W., and A. Kalhori. 2018. ABoVE: CO2 and CH4 Fluxes and Meteorology at Flux Tower Sites, Alaska, 2015-2017. ORNL DAAC, Oak Ridge, Tennessee, USA. https://doi.org/10.3334/ORNLDAAC/1562
Table of Contents
- Data Set Overview
- Data Characteristics
- Application and Derivation
- Quality Assessment
- Data Acquisition, Materials, and Methods
- Data Access
- References
Data Set Overview
This dataset provides CO2 and CH4 fluxes and meteorological parameters from five eddy covariance (EC) tower sites located at Barrow (three sites), Atqasuk (ATQ) and Ivotuk (IVO), Alaska. These locations form a 300-km north-south transect across Alaska's North Slope. Flux measurements include CO2, CH4, and H2O fluxes plus sensible and latent heat fluxes. Meteorological data include air temperature, wind speed, rain, soil temperature, PAR, radiation, soil water content, RH, ground heat fluxes, and air pressure. All data are reported at half-hourly intervals and cover the period 2015-01-01 to 2017-03-09.
Year-round eddy flux observations for CH4 in the Arctic tundra over continuous permafrost were collected to address the critical knowledge gap in cold season CH4 emissions.
Project: Arctic-Boreal Vulnerability Experiment
The Arctic-Boreal Vulnerability Experiment (ABoVE) is a NASA Terrestrial Ecology Program field campaign based in Alaska and western Canada between 2016 and 2021. Research for ABoVE links field-based, process-level studies with geospatial data products derived from airborne and satellite sensors, providing a foundation for improving the analysis and modeling capabilities needed to understand and predict ecosystem responses and societal implications.
Related datasets
These data provide a continuation of:
Oechel, W., J. Verfaillie, G. Vourlitis, and R. Zulueta. 2016. CARVE: L1 In-situ Carbon and CH4 Flux and Meteorology at EC Towers, Alaska, 2011-2015. ORNL DAAC, Oak Ridge, Tennessee, USA. http://dx.doi.org/10.3334/ORNLDAAC/1424
Zona, D., W. Oechel, C.E. Miller, S.J. Dinardo, R. Commane, J.O.W. Lindaas, R.Y-W. Chang, S.C. Wofsy, C. Sweeney, and A. Karion. 2015. CARVE-ARCSS: Methane Loss From Arctic- Fluxes From the Alaskan North Slope, 2012-2014. ORNL DAAC, Oak Ridge, Tennessee, USA. https://doi.org/10.3334/ORNLDAAC/1300
Acknowledgements:
This study was funded by NASA's Arctic-Boreal Vulnerability Experiment (Grant number: NNX16AF94A).
Data Characteristics
Spatial Coverage: Five EC tower sites located at Atqasuk (one site), Barrow (three sites), and Ivotuk (one site) on the North Slope of Alaska
ABoVE Reference Locations:
Domain: Core ABoVE
State/territory: Alaska
Grid cell(s): Ahh1Avv0Bh2Bv1, Ahh1Avv0Bh1Bv1, Ahh1Avv0Bh1Bv2
Spatial Resolution: Point
Temporal Coverage: 2015-01-01 to 2017-03-09
Temporal Resolution: half hourly
Study Areas (All latitude and longitude given in decimal degrees)
Three tower sites were located at Barrow and include the Barrow Environmental Observatory (BEO) tower, Biocomplexity Experiment, South (BES) tower, and the Climate Monitoring and Diagnostics Laboratory (CMDL) tower. Two other tower sites were located at Atqasuk (ATQ) and Ivotuk (IVO), Alaska.
|
Site |
Latitude |
Longitude |
Tower Site Description |
|---|---|---|---|
|
BES |
71.28088 |
-156.596467 |
Barrow-BES tower (US-Bes) is located 10 km east of the town of Barrow, Alaska at the Barrow Environmental Observatory reserve. Elevation 3 m ASL. Instrument height 2 m. Vegetation at the site consists of moist acidic tundra - wet sedges, grasses, moss, and assorted lichens. |
|
BEO |
71.281001 |
-156.61235 |
Barrow-BEO tower is located 10 km east of the town of Barrow, Alaska at the Barrow Environmental Observatory reserve. Elevation 3 m ASL. Instrument height 3 m. Vegetation at the site consists of moist acidic tundra - wet sedges, grasses, moss, and assorted lichens. |
|
CMDL |
71.280881 |
-156.596467 |
Barrow-CMDL tower (US-Brw) is located 10 km east of the town of Barrow, Alaska, adjacent to the NOAA CMDL Laboratory. Elevation 4 m ASL. Instrument height 5 m. Vegetation at the site consists of moist acidic tundra - wet sedges, grasses, moss, and assorted lichens. |
|
ATQ |
70.469622 |
-157.408947 |
Atqasuk tower (US-Atq) is located 100 km south of Barrow. Elevation 25 m ASL. Instrument height 2 m. Vegetation at the site is a variety of moist-wet coastal sedge tundra and moist-tussock tundra surfaces in the more well-drained upland. |
|
IVO |
68.48649 |
-155.75022 |
Ivotuk tower (US-Ivo) is located 300 km south of Barrow at 579 m elevation in polar tundra. Instrument height 4 m. |
Data File Information
There are two files in comma-separated format (.csv) for each of the five study sites.
- The files with _fluxes provide CO2 and CH4 flux data and are averages over half-hour periods calculated from raw data using EddyPro software (LI-COR). Missing CH4 flux data were gap-filled.
- The files with _meteo in the file name provide meteorology data, snow depth, soil volumetric water content, and soil temperature measurements. The measurements were made every 10-15 seconds and averaged over half-hour periods using CR-23X data logger (Campbell Scientific) or similar. Note that the column names of _meteo files have been harmonized.
The meteorological measurements in the current dataset are a continuation of the previously archived data in Oechel et al. (2016).
Missing data or data not provided are reported as -9999.
Flux data files
These are half-hourly data. Missing CH4 flux data were gap-filled. Temporal coverage varies by site.
Atqasuk_ATQ_fluxes_2015-2017.csv (2015-02-01 to 2017-03-07)
Barrow_BES_fluxes_2015-2017.csv (2015-02-08 to 2017-01-15)
Barrow_BEO_fluxes_2015-2017.csv (2015-01-01 to 2017-01-31)
Barrow_CMDL_fluxes_2015-2017.csv (2015-02-08 to 2017-02-17)
Ivotuk_IVO_fluxes_2015-2017.csv (2015-02-01 to 2017-03-07)
Table 1. Data Dictionary for flux data
| Column name | Units/format | Description |
|---|---|---|
| month | M | Month |
| day | D | Day |
| year | YYYY | Year (2015-2017) |
| time | hh:mm:ss | Time hh:mm |
| doy | ddd.ddd | Julian date in units of day of year and decimal fractional days |
| daytime | Code: T = daytime, F = night. | |
| h | W m-2 | Sensible heat |
| qc_h | Quality flag (0-2, standard flags (0-1-2) defined by Mauder and Foken (2006), flag = 0 best quality, flag = 2 worse quality, see Goodrich et al., 2016) | |
| le | W m-2 | Latent heat |
| qc_le | Quality flag (0-2, standard flags (0-1-2) defined by Mauder and Foken (2006), flag = 0 best quality, flag = 2 worse quality, see Goodrich et al., 2016) | |
| co2_flux | umol m-2 s-1 | CO2 fluxes (µmol+1s-1m-2) |
| qc_co2_flux | Quality flag (0-2, standard flags (0-1-2) defined by Mauder and Foken (2006), flag = 0 best quality, flag = 2 worse quality, see Goodrich et al., 2016) | |
| h2o_flux | mmol m-2 s-1 | H2O fluxes (mmol+1s-1m-2) |
| qc_h2o_flux | Quality flag (0-2, standard flags (0-1-2) defined by Mauder and Foken (2006), flag = 0 best quality, flag = 2 worse quality, see Goodrich et al., 2016) | |
| ch4_flux | umol m-2 s-1 | CH4 fluxes (µmol+1s-1m-2) |
| qc_ch4_flux | Quality flag (0-2, standard flags (0-1-2) defined by Mauder and Foken (2006), flag = 0 best quality, flag = 2 worse quality, see Goodrich et al., 2016) | |
| co2_molar_density | mmol m-3 | CO2 molar density (mmol+1m-3) |
| co2_mole_fraction | µmol a-1 | Units indicate mole fraction per mole of air (a-1) |
| co2_mixing_ratio | µmol d-1 | Units indicate mole fraction per mole of dry air (d-1) |
| air_temperature | Degrees K | Air temperature from the sonic anemometer |
| air_pressure | Pa | Fixed value used for the flux calculation |
Meteorological data files
These are half-hourly data. Temporal coverage varies by site.
Atqasuk_ATQ_meteo_2015-2017.csv (2015-02-01 to 2017-03-09)
Barrow_BES_meteo_2015-2017.csv (2015-01-01 to 2017-02-03)
Barrow_BEO_meteo_2015-2017.csv (2015-01-01 to 2017-02-03)
Barrow_CMDL_meteo_2015-2017.csv (2015-01-01 to 2017-02-03)
Ivotuk_IVO_meteo_2015-2017.csv (2015-01-01 to 2017-03-09)
Table 2. Data Dictionary for meteorological data
Note that not every file will have all of these columns, some column names will be variations due to the harminization process noted in section 5 below, and some columns, that have been included for consistency across sites, may have all missing values. Missing values are coded with -9999.
| Column name | Units/format | Description |
|---|---|---|
| month | mm | Month |
| day | dd | Day |
| year | yyyy | Year |
| time | hh:mm:ss | Time |
| panel_temp | C | Temperature of the panel of the datalogger |
| multiplex_ref_temp | C | Reference temperature of the multiplexer (optional) |
| Tair | C | Air temperature |
| RH | % | Relative humidity |
| Tsurf | C | Surface temperature from infrared sensor |
| Dsnow | m | Snow depth |
| WS | m/s | Wind speed |
| WD | deg | Wind direction |
| WD_sd1 | deg | St. Deviation in wind direction |
| Rnet_wc | W_m2 | Net Radiation wind corrected |
| Rnet_nwc | W_m2 | Net Radiation not wind corrected (includes Rnet) |
| Rnet_raw | W_m2 | Net Radiation raw data |
| Rsolar | W_m2 | Solar radiation |
| PPT | mm | Total rainfall |
| PARdown_incoming | umolm-2s-1 | Incoming photosynthetically-active radiation PAR |
| PARup_outgoing | umolm-2s-1 | Reflected photosynthetically-active radiation PAR |
| Rsolar_umol | umolm-2s-1 | Solar radiation |
| Rdiffuse_umol | umolm-2s-1 | Diffuse solar radiation |
| BP | Kpa | Air pressure |
| G_1 | W_m2 | Soil heat flux sensor #1 |
| G_2 | W_m2 | Soil heat flux sensor #2 |
| G_3 | W_m2 | Soil heat flux sensor #3 |
| G_4 | W_m2 | Soil heat flux sensor #4 |
| G_all_4_avg | W_m2 | Average of all four soil heat flux sensors |
| SoilT1_X | C | Soil temperature at X cm depth from profile 1 |
| SoilT2_X | C | Soil temperature at X cm depth from profile 2 |
| SoilT3_X | C | Soil temperature at X cm depth from profile 3 |
| SoilT4_X | C | Soil temperature at X cm depth from profile 4 |
| P1_SWC_X | % | Soil moisture at X cm depth for profile 1 (volumetric water content) |
| P2_SWC_X | % | Soil moisture at X cm depth for profile 2 (volumetric water content) |
| P3_SWC_X | % | Soil moisture at X cm depth for profile 3 (volumetric water content) |
Companion Files:
- The crosswalk mapping of the meteorological data file column names as provided to the harmonized names is shown in the companion file. [Harmonized_meteo_column_crosswalk.csv]
- The column descriptions as provided for each file are preserved in a companion file [Provided_meteo_column_descriptions.pdf]
User Notes:
The PAR measurements are explicitly named to denote incoming/downwelling and outgoing/upwelling/reflected values (PARdown_incoming, PARup_outgoing) to minimize confusion with names that indicate the orientation of the sensor.
The columns in the data dictionary for soil temperature profiles, show a generic list of sensors and depths. The sites may have different numbers of profiles, sensors, and sensor depths as noted in Section 5. The soil temperature profile columns have been named as (SoilT), (the profile or sensor number), and (_depth), (e.g., SoilT1_0, SoilT1_10, SoilT1_20).
The columns for soil moisture profiles, also may have a different number of profiles, sensors, and sensor depths at each site as noted in Section 5. The soil moisture profile columns have been named as (Px, for profile number), (_SWC, for soil water content), and (_depth), (e.g., P2_SWC_15) when possible. If only the sensor number is provided the name is SWC_1. Another variation is for SWC measured in high-centered and low-centered polygons at Barrow BEO and Barrow BES, with HCP and LCP indicating the profile location (e.g., HCP_SWC_40, LCP_SWC_10).
Note that not every file will have all of these columns, some column names will be variations as noted above, and some columns, that have been included for consistency across sites, may have all missing values. Missing values are coded with -9999.
Application and Derivation
These data are used to monitor seasonal variation of CO2, H2O, and CH4 fluxes and the inter-annual differences in Arctic landscapes. The data may also be used to identify patterns in Arctic-boreal CO2 and CH4 fluxes to determine environmental drivers of GPP, ecosystem respiration and changes in landscape carbon sink and source activity. Measurements from eddy covariance towers are also necessary to calibrate and validate ecosystem models.
Quality Assessment
Gap-filling of the observations from the three towers was performed using a satellite data driven modeling approach described in Watts et al. (2014). Gap-filled data are susceptible to model inaccuracies. CH4 gap-filling used a method devised by the Max Planck Institute for Biogeochemistry (http://www.bgc-jena.mpg.de/~MDIwork/eddyproc/method.php). Gap-filled data points are denoted by a value of 1 in the quality flag columns of the data files.
Data Acquisition, Materials, and Methods
Site Descriptions
Atqasuk
The Atqasuk site is located 100-km south of Barrow. Site elevation is 25 meters ASL and instrument heights are at two meters. Vegetation at the site is a variety of moist-wet coastal sedge tundra and moist-tussock tundra surfaces in the more well-drained upland. The International Geosphere-Biosphere Programme (IGBP) land cover is classified as permanent wetlands. Mean annual temperature is -10.8 degrees C.
Barrow
The Barrow site is located 10-km east of the town of Barrow, AK, adjacent to the NOAA CMDL Laboratory. Site elevation is four meters ASL and instrument heights are at five meters. The vegetation is mature in an unmanaged and undisturbed Arctic tundra environment and consist of wet sedges, grasses, moss, and assorted lichens. The IGBP land cover is classified as permanent wetlands. The local landscape surrounding the site has a history absent of any disturbances and the terrain was not heavily glaciated during the last period of glaciation. Mean annual temperature is -11.3 degrees C.
Barrow and include the Barrow Environmental Observatory (BEO) tower, Biocomplexity Experiment, South (BES) tower, and the Climate Monitoring and Diagnostics Laboratory (CMDL) tower.
Ivotuk
The Ivotuk tower site is the most southerly site located near the IVO Airstrip at the foothills of the Brooks Range Mountains, about 300-km south of Barrow, in polar tundra. Site elevation is 579 meters ASL and instrument height is at four meters. The IGBP land cover is classified as permanent wetlands and vegetation of the area is comprised of tussock sedge, dwarf-shrub, and moss tundra. Mean annual temperature is −8.9 degrees C (Zona et al., 2015).
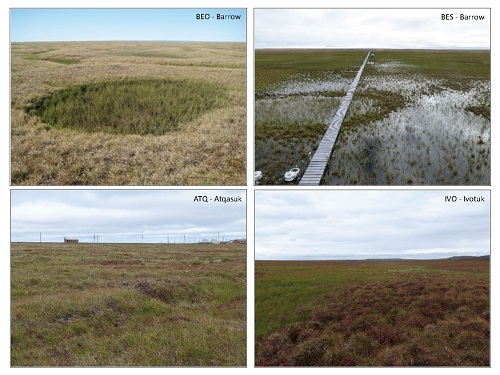
Figure 2. Vegetation at the flux tower field sites at Barrow, Atqasuk and Ivotuk, Alaska.
Flux Measurements
Los Gatos Research FGGA gas analyzers were used at all sites, except in IVO, where low power availability restricted use to the open-path LI-7700 analyzer. A second LI-7700 was also implemented in CMDL alongside the FGGA to ensure comparability of the results using these two instruments.
Half-hourly fluxes were calculated from raw data using the EddyPro software (LI-COR). Missing CH4 flux data were gap-filled.
Environmental Variables
A wide range of meteorological variables were recorded every 10-15 s and averaged over half hour periods using a CR-23X data logger (Campbell Scientific) at each of the five EC towers:
Solar Radiation:
- Photosynthetic active radiation (PAR) measured with quantum sensors (LI-190; Li-COR) in all sites
- Net radiation recorded using a net radiometer (REBS Q7 (Radiation & Energy Balance Systems, Inc.) in BES, BEO, CMDL, and ATQ; and an NR Lite (Kipp and Zonen) in IVO)
- Incoming solar radiation measured using pyranometers (CMP3; Kipp and Zonen) in all sites
General:
- Air temperature and relative humidity (RH) measured with a Vaisala HMP 45 (in CMDL, BES, and ATQ), and a Vaisala 155a in IVO and BEO
- Soil heat flux at 2 to 5-cm depth measured in four to six locations in all sites with REBS HFT3 (Radiation & Energy Balance)
- Wind speed and direction (03001 Wind Sentry Set)
- Precipitation (TE525WS; Texas Electronics)
Soil:
- Soil heat flux at 2 to 5-cm depth measured in four to six locations in all sites with REBS HFT3 (Radiation & Energy Balance)
- Soil temperatures were measured with thermocouples (either type-T or type-E; Omega Engineering) at the following depths at BES, ATQ, and IVO:
BES: At the surface, 1, 5, 10, 20, and 30 cm
ATQ: Four profiles at 5, 15, and 30 cm
IVO: Four profiles at the surface, 5, 15, 30, and 40 cm
- Soil moisture was measured with a Water Content Reflectometer CS616 (Campbell Scientific) at BES, ATQ, and IVO:
BES: Measured with the Reflectometer inserted perpendicularly (0–30 cm) or diagonally in different soil layers (0–10 cm and 20/−30 cm)
ATQ: Measured horizontally at 5, 15, and 30 cm (two profiles)
IVO: Measured at the surface, 5, 15, and 30 cm (three profiles)
Snow depth was measured with a Sonic Ranging Sensor in BEO, BES, ATQ, and at IVO with a SR50A-L snow sensor (Campbell Scientific).
Harmonization of meteorological variables
As noted, the meteorological measurements at these sites are a continuation of the previously archived data in Oechel et al. (2016).
This common set of meteorological variables were measured with similar instruments at the five tower sites in this current dataset. However, the measurements were not originally reported in consistently named columns and structured files. To facilitate appending the current site meteorological data to the Oechel et al. (2016) data, the current data file variable names were harmonized (when appropriate) with one of the Oechel et al. (2016) files (i.e., SDSU_BRW_2013.csv) by the ORNL DAAC Data Center.
Data Access
These data are available through the Oak Ridge National Laboratory (ORNL) Distributed Active Archive Center (DAAC).
ABoVE: CO2 and CH4 Fluxes and Meteorology at Flux Tower Sites, Alaska, 2015-2017
Contact for Data Center Access Information:
- E-mail: uso@daac.ornl.gov
- Telephone: +1 (865) 241-3952
References
Goodrich, J.P, W.C. Oechel, B. Gioli, V. Moreaux, P.C. Murphy, G. Burba, and D. Zona. 2016. Impact of different eddy covariance sensors, site set-up, and maintenance on the annual balance of CO2 and CH4 in the harsh arctic environment. Agricultural and Forest Meteorology pp 239–251. http://dx.doi.org/10.1016/j.agrformet.2016.07.008
Mauder, M. and T. Foken. 2006. Impact of post-field data processing on eddy covariance flux estimates and energy balance closure. Meteorologische Zeitschrift 15:597–609.
Oechel, W.C., C.A. Laskowski, G. Burba,B. Gioli, and A.A. M. Kalhori. 2014. Annual patterns and budget of CO2 flux in an Arctic tussock tundra ecosystem, J. Geophys. Res. Biogeosci., 119, 323–339. http://dx.doi.org/10.1002/2013JG002431
Zona, D., Z., B. Gioli, R. Commane, J. Lindaas, S.C. Wofsy, C.E. Miller, S.J. Dinardo, S. Dengel, C. Sweeney, A. Karion, R.Y.-W. Chang, J.M. Henderson, P.C. Murphy, J.P. Goodrich, V. Moreauxa, A. Liljedahl, J.D. Watts, J.S. Kimball, D.A. Lipson, and W.C. Oechel. 2015. Cold season emissions dominate the Arctic tundra methane budget. PNAS 2016 113 (1) 40-45. http://dx.doi.org/10.1073/pnas.1516017113
Watts, J.D., J.S. Kimball, A. Bartsch, and K.C. McDonald. 2014. Surface water inundation in the boreal-Arctic: Potential impacts on regional methane emissions. Environ Res Lett 9(7):1–13. http://dx.doi.org/10.1088/1748-9326/9/7/075001