Documentation Revision Date: 2022-04-20
Dataset Version: 1
Summary
There are 28 data files with this dataset; 25 data files in GeoTIFF (*.tif) format and three files in comma-separated value format (.csv).
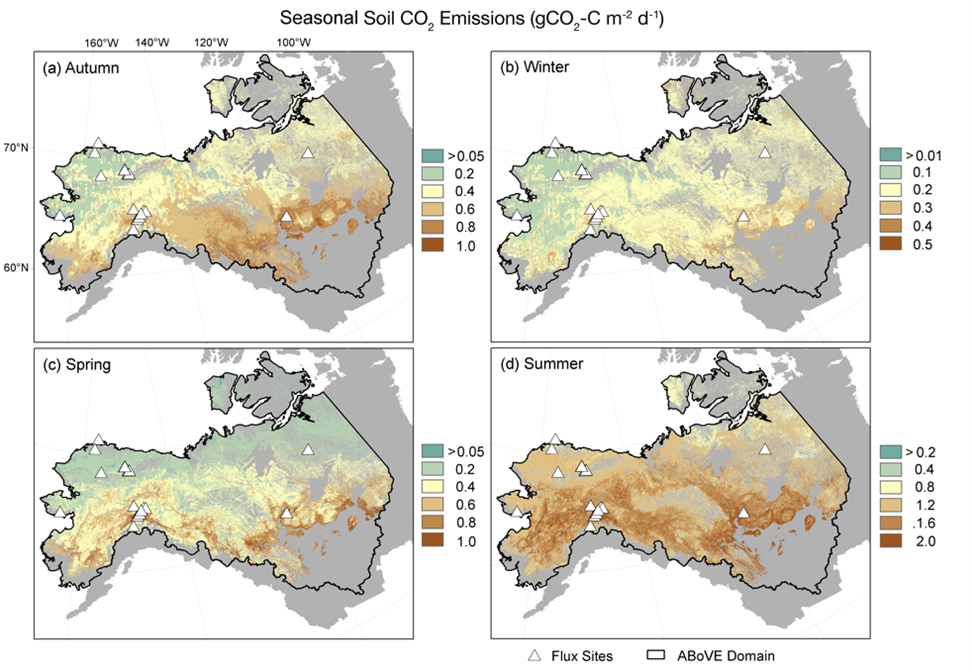
Figure 1. Seasonal average soil respiration emissions (gCO2 C m-2 d-1) for autumn (September-October), winter (November-March), spring (April-May), and summer (June-August ) at a 300 m spatial resolution. Source: Watts et al. (2021)
Citation
Watts, J.D., S. Natali, and C. Minions. 2022. Soil Respiration Maps for the ABoVE Domain, 2016-2017. ORNL DAAC, Oak Ridge, Tennessee, USA. https://doi.org/10.3334/ORNLDAAC/1935
Table of Contents
- Dataset Overview
- Data Characteristics
- Application and Derivation
- Quality Assessment
- Data Acquisition, Materials, and Methods
- Data Access
- References
Dataset Overview
This dataset provides gridded estimates of carbon dioxide (CO2) emissions from soil respiration occurring within permafrost-affected tundra and boreal ecosystems of Alaska and Northwest Canada at a 300 m spatial resolution for the period 2016-08-18 to 2018-09-12. The estimates include monthly average CO2 flux (gCO2 C m-2 d-1), daily average CO2 flux and error estimates by season (Autumn, Winter, Spring, Summer), estimates of annual offset of CO2 uptake (i.e., vegetation GPP), annual budgets of vegetation gross primary productivity (GPP; gCO2 C m-2 yr-1), and the fraction of open (non-vegetated) water within each 300 m grid cell. Belowground sources of respiration (i.e., root and microbial) are included. The gridded soil CO2 estimates were obtained using seasonal Random Forest models, information from remote sensing, and a new compilation of in-situ soil CO2 flux from Soil Respiration Stations and eddy covariance towers. The flux tower data are provided along with daily gap-filled flux observations for each Soil Respiration station forced diffusion (FD) chamber record. The data cover the NASA ABoVE Domain.
Project: Arctic-Boreal Vulnerability Experiment
The Arctic-Boreal Vulnerability Experiment (ABoVE) is a NASA Terrestrial Ecology Program field campaign focused on Alaska and western Canada. Research for ABoVE links field-based, process-level studies with geospatial data products derived from airborne and satellite sensors, providing a foundation for improving analysis and modeling capabilities needed to understand and predict ecosystem responses to, and societal implications of, climate change in the Arctic and Boreal regions. Our ABoVE-sponsored study focuses on the spatiotemporal patterns and magnitudes of soil CO2, which are not well quantified across rapidly warming pan-Arctic ecosystems.
Related Publication
Watts, J.D., S.M. Natali, C. Minions, D. Risk, K. Arndt, D. Zona, E.S. Euskirchen, A.V. Rocha, O. Sonnentag, M. Helbig, A. Kalhori, W. Oechel, H. Ikawa, M. Ueyama, R. Suzuki, H. Kobayashi, G. Celis, E.A. Schuur, E. Humphreys, Y. Kim, B.-Y. Lee, S. Goetz, N. Madani, L.D. Schiferl, R. Commane, J.S. Kimball, Z. Liu, M.S. Torn, S. Potter, J.A. Wang, M.T. Jorgenson, J. Xiao, X. Li, and C. Edgar. 2021. Soil respiration strongly offsets carbon uptake in Alaska and Northwest Canada. Environmental Research Letters 16:084051. https://doi.org/10.1088/1748-9326/ac1222
Related Dataset
Minions, C., S. Natali, J.D. Watts, S. Ludwig, D. Risk 2019. ABoVE: Year-Round Soil CO2 Efflux in Alaskan Ecosystems, Version 2. ORNL DAAC, Oak Ridge, Tennessee, USA. https://doi.org/10.3334/ORNLDAAC/1762
Acknowledgments
This research was funded as part of NASA's Arctic Boreal Vulnerability Experiment (grants NNX15AT81A, 80NSSC19M0209).
Data Characteristics
Spatial Coverage: permafrost-affected tundra and boreal landscapes in Alaska and Canada (ABoVE core domain); excludes barren lands and water bodies
ABoVE Reference Locations
Domain: Core ABoVE
Grid cells (240 m "A" cells): Ah000v000, Ah000v00, Ah001v002, Ah002v002, Ah003v002, Ah001v000,Ah002v000, Ah003v000,
Ah000v001, Ah001v001, Ah002v001, Ah003v001
Spatial Resolution: 300 m grid cells, point resolution for site data
Temporal Coverage: 2016-08-18 to 2018-09-12
Temporal Resolution: daily, monthly
Study Area: Latitude and longitude are given in decimal degrees.
| Site | Westernmost Longitude | Easternmost Longitude | Northernmost Latitude | Southernmost Latitude |
|---|---|---|---|---|
| Alaska and Canada | -169.5052 | -98.7366 | 76.6874 | 55.8072 |
Data File Information
There are 25 data files in GeoTIFF (*.tif) format and three files in comma-separated value format (*.csv) included in this dataset.
Table 1. File names and descriptions
| File Name | Units | Description |
|---|---|---|
| soil_resp_flux_YYYY-XX.tif | g m-2 d-1 | Twelve files. Daily average emissions from soil respiration (gCO2 C m-2 d-1) over monthly time steps where YYYY is 2016 or 2017 and XX for the 2016 files is 09–12, and for the 2017 files is 01–08. Missing values are represented by 0. |
| soil_resp_flux_AAA_YYYY.tif | g m-2 d-1 | Four files. Average estimates (gCO2 C m-2 d-1) for sampling periods, where AAA is the season and YYYY is the year. Missing values are represented by 0. |
| soil_resp_flux_est_error_AAA_YYYY.tif | g m-2 d-1 | Four files. Average flux estimate error (gCO2 C m-2 d-1) for sampling periods, where AAA is the season and YYYY is the year. Missing values are represented by -3. |
| soil_resp_budget_annual_2016-2017.tif | g m-2 | Annual soil respiration budgets (gCO2 C m-2) for September 2016–August 2017. Missing values are represented by 0. |
| soil_resp_budget_annual_percent_offset_GPP_2016-2017.tif | percent | Annual percentage offset of growing season GPP by soil respiration emissions for September 2016–August 2017. An offset of 100% indicates that soil respiration equaled or exceeded annual GPP. Missing values are represented by 0. |
| GPP_budget_annual_2016-2017.tif | g m-2 | Annual GPP budgets (gCO2 C m-2) averaged for the 2016–2017 growing seasons. A composite of SMAP, GOSIF, and MODIS GPP products. Missing values are represented by 0. |
| ecosystem_resp_budget_annual_percent_offset_GPP_2016-2017.tif | percent | Annual percentage offset of growing season GPP by ecosystem (soil + aboveground) respiration forSeptember 2016–August 2017. An offset of 100% indicates that ecosystem respiration equaled or exceeded annual GPP. Missing values are represented by 0. |
| fractional_water.tif | 1 | Provides 300 m grid fractional water (FW) information for the study domain, derived from Wang et al. (2019). FW values of 1 indicate that the 300 m pixel contains 100% surface open water coverage. Missing values are represented by 0. |
| soil_resp_station_descriptions.csv | Provides descriptive data of site respiration stations. See Table 2 for variable descriptions. Missing values are represented by -9999. | |
| site_monthly_soil_respiration_flux.csv | Table of average monthly soil respiration fluxes for the ABoVE domain in gCO2 C m-2 d-1, used to develop the Random Forest models. These include flux data from Soil Respiration Stations and eddy covariance sites for 2016–2017 (Watts et al., 2021). The Soil Respiration Station record also includes more recent data for 2018. See Table 3 for variable descriptions. Missing values are represented by -9999. | |
| soil_resp_station_daily_soil_respiration_flux_gap_filled_2016-2018.csv | Table of daily gap filled flux observations for each Alaska Soil Respiration station forced diffusion (FD) chamber record (Watts et al., 2021). The record includes all available data from 2016–2018. See Table 4 for variable descriptions. Missing values are represented by -9999. |
Data File Details
- Scaling factors: For the file fractional_water.tif (water mask), the scaling factor is 100.
- CRS: Cylindrical Equal Area, WGS 84 datum, EPSG: 6933.
- Missing data values: Missing values are represented by -3 for the files named soil_resp_flux_est_error_AAA_YYYY.tif, 0 for other GeoTIFF files, and -9999 for CSV files.
Table 2. Variables names and descriptions for the file soil_resp_station_descriptions.csv.
| Variable | Units | Description |
|---|---|---|
| site_code | Abbreviated site station name | |
| site_name | Site station name | |
| latitude | Decimal degrees | Latitude of site |
| longitude | Decimal degrees | Longitude of site |
| description | Site description (vegetation type, burned information) |
Table 3. Variables names and descriptions for the file site_monthly_soil_respiration_flux.csv.
| Variable | Units | Description |
|---|---|---|
| site | Abbreviated site station name | |
| system | System used to collect data: EC (eddy covariance towers), SRS (Soil Respiration Stations), or Eosense FD (forced diffusion chamber) | |
| latitude | Decimal degrees | Latitude of site |
| longitude | Decimal degrees | Longitude of site |
| month | Month of measurement | |
| flux | g m-2 d-1 | Monthly average flux observations (gCO2 C m-2 d-1) from Soil Respiration Stations and eddy covariance towers |
Table 4. Variables names and descriptions for the file soil_resp_station_daily_soil_respiration_flux_gap_filled_2016-2018.csv.
| Variable | Units | Description |
|---|---|---|
| date | Abbreviated site station name | |
| XXX_FDZZ (site code names_chamber record) | g m-2 d-1 | Gap-filled flux data (gCO2 C m-2 d-1) for 31 respiration sites, in columns B–AF, for each soil respiration station forced diffusion (FD_ZZ) chamber record. For site code names, refer to Table 2. |
Application and Derivation
The soil emission and budget maps provide new insight into the regional patterns of soil respiration within the domain. The resulting respiration budgets can be used in baseline comparisons against estimates from regional process-based and Earth System models.
Quality Assessment
Soil respiration emissions were derived from models trained using a new CO2 flux database for the ABoVE domain (Watts et al., 2021). The flux database includes observations from 10 Soil Respiration Stations (Minions et al. 2019), one Eosense eosFD station, and 15 eddy covariance towers. In total, 268 monthly average flux (gCO2 C m-2 d-1) estimates, from September 2016 to August 2017, were used to develop the regional soil respiration models. Uncertainty was measured from Random Forest model error using Root Mean Square Error (RMSE), coefficient of determination (R2), and Mean Absolute Error (MAE) based on internal and external accuracy assessments (Table 2). Regional uncertainty maps (Fig. 3) for each seasonal Random Forest model were obtained using the quadrature method: sqrt(global RMSE2 + (pixel-level uncertainty – global RMSE)2). Pixel-level level uncertainty was obtained through bootstrapping of the Random Forest input observations (20% removed) to provide an estimate of deviation (uncertainty) around the estimated mean.
Table 5. Accuracy assessments for seasonal Random Forest models. RMSE1 and MAE1 (gCO2 C m-2 d-1) are provided from the internal out-of-bag accuracy assessments; RMSE2 and MAE2 are based on an external accuracy assessment using 1,000 bootstrapped samples where 80% of data were used for model training and 20% were withheld for validation.
| Season | R2 | RMSE1 | MAE1 | RMSE2 | MAE2 | |||||
|---|---|---|---|---|---|---|---|---|---|---|
| Summer | 0.68 | 0.16 | 0.05 | 0.35 | 0.31 | |||||
| Autumn | 0.57 | 0.12 | 0.09 | 0.24 | 0.20 | |||||
| Winter | 0.65 | 0.06 | 0.04 | 0.10 | 0.08 | |||||
| Spring | 0.76 | 0.08 | 0.11 | 0.25 | 0.19 | |||||
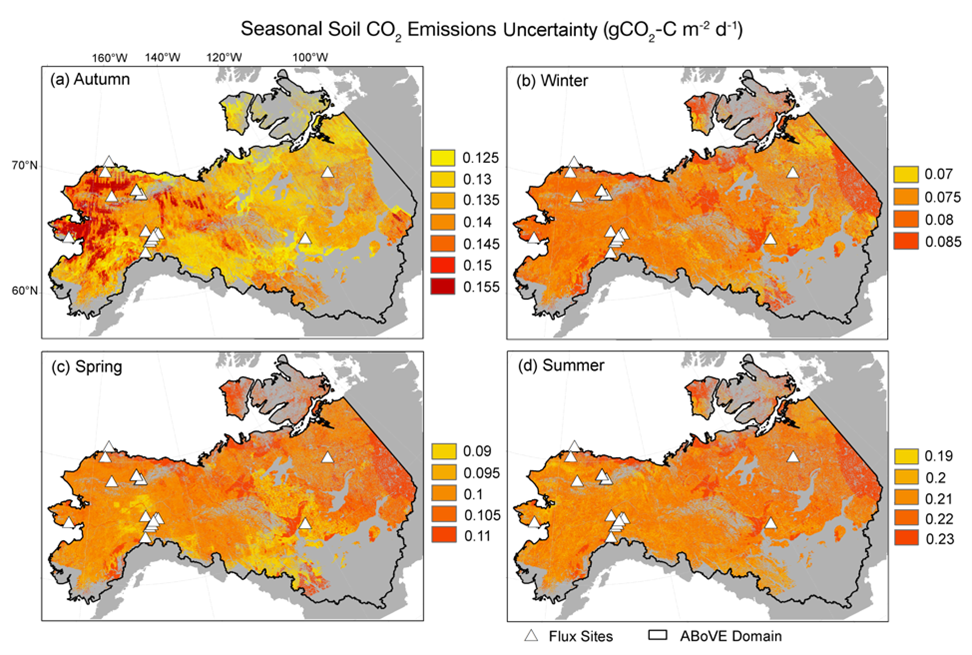
Figure 2. Seasonal average uncertainties for soil respiration emissions (gCO2 C m-2 d-1) in autumn (September–October), winter (November–March), spring (April–May), and summer (June–August) at a 300 m spatial resolution. Source: Watts et al. (2021)
Data Acquisition, Materials, and Methods
Soil respiration emissions were derived using a new CO2 flux database for the ABoVE domain (Watts et al., 2021) that includes observations from 10 Soil Respiration Stations (Minions et al., 2019), one Eosense eosFD station, and 15 eddy covariance towers. In total, the flux database provided 268 observations of monthly average flux (gCO2 C m-2 d-1) spanning September 2016 to August 2017. Fourteen of the sites are in tundra ecosystems; 12 sites are in the boreal biome; three sites are in burned ecosystems.
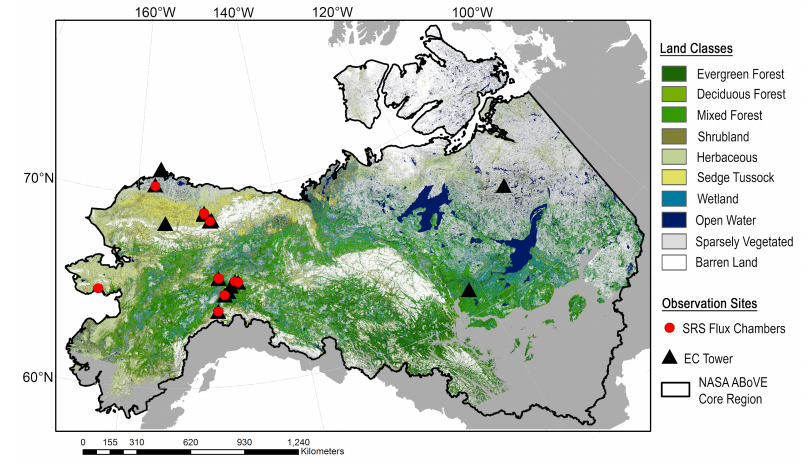
Figure 3. Locations of soil respiration stations (SRS) and eddy covariance (EC) towers were considered in this study. The study domain is part of the NASA ABoVE core region. The sites span climate and vegetation gradients (tundra to boreal) within Alaska and Northwest Canada. Landscapes evaluated in this study do not include barren land, open water, or where permafrost was absent (indicated in grey). Landcover classes are from Wang et al. (2019).
The soil respiration fluxes were scaled to permafrost-affected landscapes within the ABoVE domain (2.68 x 10⁶ km2) using seasonal Random Forest models developed for autumn (September–October), winter (November–March), spring (April–May), and summer (June–August). A summary of the satellite remote sensing and ancillary geospatial inputs selected as model predictors is provided in Table 6. These include information about ecosystem GPP, soil organic carbon pools, tree cover and greenness, thermal condition (i.e., permafrost status, soil temperature, land temperature, snow cover), and ecosystem moisture (i.e., soil moisture, landscape moisture indices, soil texture). A summary of the model accuracy assessments is provided in Table 5.
Table 6. Geospatial predictors used in the seasonal Random Forest models to estimate soil respiration emissions within permafrost-affected landscapes of the NASA ABoVE domain (Watts et al., 2021).
| Variable | Description | Native Resolution | Source | Reference |
|---|---|---|---|---|
| Autumn RF Model | ||||
| Permafrost Zonation Index | Relative likelihood of permafrost presence; static | 1 km | Geo.uzh.ch | Gruber et al. (2012) |
| Soil Organic Carbon | Total carbon 0–30 cm; static | 250 m | SoilGrids; isric.org | Hengl et al. (2017) |
| Root Zone Soil Moisture | Monthly average | 9 km | SMAP; nsidc.org | Reichle et al. (2018) |
| Downwelling Shortwave Radiation | Monthly total | 9 km | SMAP; nsidc.org | Reichle et al. (2018) |
| Soil Temperature (Layer 4) | Monthly average | 9 km | SMAP; nsidc.org | Reichle et al. (2018) |
| Winter RF Model | ||||
| Permafrost Zonation Index | Relative likelihood of permafrost presence; static | 1 km | Geo.uzh.ch | Gruber et al. (2012) |
| Leaf Area Index | MCD15A36; 2016 summer average | 500 m | MODIS; modis.gsfc.nasa.gov/data | Myneni et al. (2015) |
| Enhanced Vegetation Index | LC8_L1T; 2014–2016 summer average | 30 m | Landsat; usgs.gov/core- science-systems/nli/ | Gorelick et al. (2017) |
| Normalized Difference Water Index | LC8_L1T; 2014–2016 summer average | 30 m | Landsat; usgs.gov/core- science-systems/nli/ | Gorelick et al. (2017) |
| Gross Primary Productivity | MOD17A2H; 2016 summer total | 500 m | MODIS; lpdaac.usgs.gov | Running et al. (2015) |
| Normalized Difference Snow Index | 2016/2017 winter average | 500 m | MODIS | Schaaf & Wang (2015) |
| Root Zone Soil Moisture | Volumetric; monthly average | 9 km | SMAP; nsidc.org | Reichle et al. (2018) |
| Soil Temperature (Layer 3) | Monthly average | 9 km | SMAP; nsidc.org | Reichle et al. (2018) |
| Spring RF Model | ||||
| Permafrost Zonation Index | Relative likelihood of permafrost presence; static | 1 km | Geo.uzh.ch | Gruber et al. (2012) |
| Soil % Clay Content | 0–30 cm depth; static | 250 m | SoilGrids; isric.org | Hengl et al. (2017) |
| % Tree Cover | MOD44B; 2016 summer average | 250 m | MODIS; lpdaac.usgs.gov | Dimiceli et al. (2015) |
| Gross Primary Productivity | MOD17A2H; 2016 summer total | 500 m | MODIS; lpdaac.usgs.gov | Running et al. (2015) |
| Surface Soil Moisture | Volumetric; monthly average | 9 km | SMAP; nsidc.org | Reichle et al. (2018) |
| Enhanced Vegetation Index | LC8_L1T; 2014–2016 summer average | 30 m | Landsat; usgs.gov/core- science-systems/nli/ | Gorelick et al. (2017) |
| Land Surface Temperature | MOD11A1; monthly average | 1 km | MODIS; lpdaac.usgs.gov | Wan et al. (2015) |
| Summer RF Model | ||||
| Gross Primary Productivity | MOD17A2H; 2017 summer total | 500 m | MODIS; lpdaac.usgs.gov | Running et al. (2015) |
| Leaf Area Index | MCD15A36; 2017 summer average | 500 m | MODIS; modis.gsfc.nasa.gov/data | Myneni et al. (2015) |
| % Tree Cover | MOD44B; 2016 summer average | 250 m | MODIS; lpdaac.usgs.gov | Dimiceli et al. (2015) |
| Soil % Sand Content | 0–30 cm depth; static | 250 m | SoilGrids; isric.org | Hengl et al. (2017) |
| Normalized Difference Vegetation Index | MCD43A4; monthly average | 500 m | MODIS; lpdaac.usgs.gov | Schaaf & Wang (2015) |
The monthly average soil respiration emission estimates (gCO2 C m-2 d-1) from the Random Forest models were scaled to the terrestrial spatial domain within each 300 m x 300 m grid cell. Fractions of open water (derived from the 30 m Wang et al. (2019) land cover map) were removed during the per-grid cell carbon budget calculations. The resulting 300 m resolution annual soil respiration emission (gCO2 C yr-1) maps for permafrost-affected terrestrial surfaces were used to obtain seasonal and annual soil respiration budgets for the ABoVE domain (Fig. 1.).
To determine the extent that which soil respiration offsets the annual ecosystem uptake of CO2 (i.e., GPP) on a per grid-cell basis across the region, estimates of GPP were obtained from NASA MODIS MOD17 (MOD17A2H.006; Running et al., 2015), NASA Soil Moisture Active Passive (SMAP) Level 4 Carbon (L4_C) (Kimball et al., 2014) and Global OCO-2 SIF (GOSIF) GPP data products (Li & Xiao, 2019) for the 2016 and 2017 growing season. Finally, literature-based flux ratios (Watts et al., 2021) were used to obtain estimates of emissions from aboveground respiration, in addition to our estimates of soil respiration, providing estimates of total ecosystem respiration (ER). These were used to develop 300 m continuous gridded surfaces of the annual offset of GPP by ER (Fig. 4).
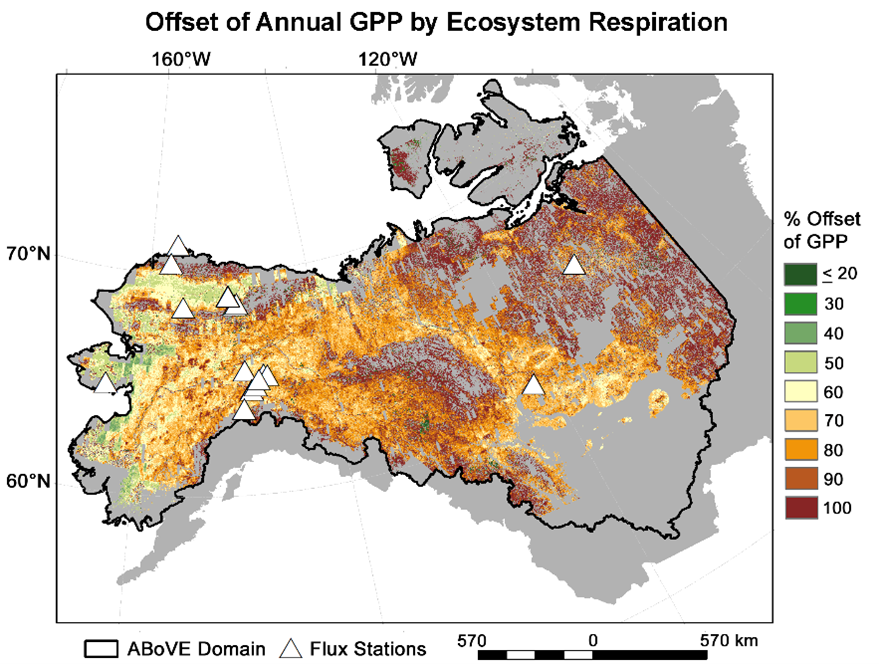
Figure 4. The annual offset of GPP by ecosystem respiration.
Data Access
These data are available through the Oak Ridge National Laboratory (ORNL) Distributed Active Archive Center (DAAC).
Soil Respiration Maps for the ABoVE Domain, 2016-2017
Contact for Data Center Access Information:
- E-mail: uso@daac.ornl.gov
- Telephone: +1 (865) 241-3952
References
Dimiceli, C., M. Carroll, R. Sohlberg, D.H. Kim, M. Kelly, and J.R.G. Townshend. 2015. MOD44B MODIS/Terra Vegetation Continuous Fields Yearly L3 Global 250m SIN Grid V006. NASA EOSDIS Land Processes DAAC. https://doi.org/10.5067/MODIS/MOD44B.006.
Gorelick, N., M. Hancher, M. Dixon, T.D. Ilyushchenko, and R. Moore. 2017. Google Earth Engine: Planetary-scale geospatial analysis for everyone. Remote Sensing of Environment 202:18-27. https://doi.org/10.1016/j.rse.2017.06.031
Gruber, S. 2012. Derivation and analysis of a high-resolution estimate of global permafrost zonation. The Cryosphere 6:221-233. https://climatedataguide.ucar.edu/climate-data/global-permafrost-zonation-index-ma
Hengl, T., J. Mendes de Jesus, G.B.M. Heuvelink, M.R. Gonzalez, M. Kilibarda, A. Blagotic, W. Shangguan, M.N. Wright, X. Geng, B. Bauer-Marschallinger, M.A. Guevara, R. Vargas, R.A. MacMillan, N.H. Batjes, J.G.B. Leenaars, E. Ribeiro, I. Wheeler, S. Mantel, and B. Kempen. 2017. SoilGrids250m: Global gridded soil information based on machine learning. PLOS One 12:e0169748. https://doi.org/10.1371/journal.pone.0169748
Kimball, J.S., L.A. Jones, J.P. Glassy, and R. Reichl. 2014. Soil Moisture Active Passive (SMAP) Algorithm Theoretical Basis Document SMAP Level 4 Carbon Data Product (L4_C). https://nsidc.org/sites/nsidc.org/files/files/271_L4_C_RevA_web.pdf
Li, X. and J. Xiao. 2019. Mapping photosynthesis solely from solar-induced chlorophyll fluorescence: A global, fine-resolution dataset of gross primary productivity derived from OCO-2. Remote Sensing 11:2563. https://doi.org/10.3390/rs11212563.
Minions, C., S.Natali, J.D. Watts, S. Ludwig, and D. Risk. 2019. ABoVE: Year-round soil CO2 efflux in Alaskan ecosystems, Version 2. ORNL DAAC, Oak Ridge, Tennessee, USA. https://doi.org/10.3334/ORNLDAAC/1762
Myneni, R., Y. Knyazikhin, and T. Park. 2015. MCD15A3H MODIS/Terra+Aqua Leaf Area Index/FPAR 4-day L4 Global 500m SIN Grid V006. NASA EOSDIS Land Processes DAAC. https://doi.org/10.5067/MODIS/MCD15A3H.006.
Reichle, R.H., G.J.M. De Lannoy, R.D. Koster, W.T. Crow, J.S. Kimball, and Q. Liu. 2018. SMAP L4 Global 3-hourly 9 km EASE-Grid Surface and Root Zone Soil Moisture Geophysical Data, Version 4. Boulder, Colorado, NASA National Snow and Ice Data Center Distributed Active Archive Center. Doi: https://doi.org/10.5067/KPJNN2GI1DQR.
Running, S., Q. Mu, and M. Zhao. 2015. MOD17A2H MODIS/Terra Gross Primary Productivity 8-Day L4 Global 500m SIN Grid V006. NASA EOSDIS Land Processes DAAC. https://doi.org/10.5067/MODIS/MOD17A2H.006
Schaaf, C., and Z. Wang. 2015. MCD43A4 MODIS/Terra+Aqua BRDF/Albedo Nadir BRF Adjusted Ref Daily L3 Global -500m V006. NASA EOSDIS Land Processes DAAC. https://doi.org/10.5067/MODIS/MCD43A4.006
Wan, Z., S. Hook, and G. Hulley. 2015. MOD11A1 MODIS/Terra Land Surface Temperature/Emissivity Daily L3 Global 1 km SIN Grid V006. NASA EOSDIS Land Processes DAAC. https://doi.org/10.5067/MODIS/MOD11A1.006.
Wang, J.A., D. Sulla-Menashe, C.E. Woodcock, O. Sonnentag, R.F. Keeling, and M.A. Friedl. 2019. ABoVE: Landsat-derived Annual Dominant Land Cover Across ABoVE Core Domain, 1984-2014. ORNL DAAC, Oak Ridge, Tennessee, USA. https://doi.org/10.3334/ORNLDAAC/1691
Watts, J.D., S.M. Natali, C. Minions, D. Risk, K. Arndt, D. Zona, E.S. Euskirchen, A.V. Rocha, O. Sonnentag, M. Helbig, A. Kalhori, W. Oechel, H. Ikawa, M. Ueyama, R. Suzuki, H. Kobayashi, G. Celis, E.A. Schuur, E. Humphreys, Y. Kim, B.-Y. Lee, S. Goetz, N. Madani, L.D. Schiferl, R. Commane, J.S. Kimball, Z. Liu, M.S. Torn, S. Potter, J.A. Wang, M.T. Jorgenson, J. Xiao, X. Li, and C. Edgar. 2021. Soil respiration strongly offsets carbon uptake in Alaska and Northwest Canada. Environmental Research Letters 16:084051. https://doi.org/10.1088/1748-9326/ac1222