Documentation Revision Date: 2019-04-12
Dataset Version: 1
Summary
The field plots were established in the summer of 2015 in seven spatially independent burn scars, four in the Taiga Plains ecozone and three in the Taiga Shield ecozone. Plots were classified as young-burned (stand age <60 years at the time of fire, mean=45 years) or old-burned (stand age 81 >70 years at the time of fire, mean=128 years) based on the historic fire return interval of 70-130 years in northwestern boreal forest. In each profile, Δ14C values from multiple, adjacent soil depth increments were used to assign them to the correct side of the atmospheric bomb-peak and compared to the atmospheric value of Δ14CO2 during the year that the stand was established. The relationship between soil and stand Δ14C was used to assess legacy C presence and combustion. Legacy C was considered to be present if the basal soil sample was older than the stand age at time of fire, and legacy C combusted if the residual surface soil sample was older than the stand age at time of fire.
There are three data files with this dataset in comma-separated (.csv) format.

Figure 1. Radiocarbon concentration (delta14C) in the atmosphere over time, showing the bomb peak in 1966 (red dotted line) and theoretical positions of delta14C of soil depth increments (points) (Walker et al., 2019).
Citation
Walker, X.J., J.L. Baltzer, W. Laurier, S.G. Cumming, N.J. Day, S.J. Goetz, J.F. Johnstone, S. Potter, B.M. Rogers, E.A.G. Schuur, M.R. Turetsky, and M.C. Mack. 2019. ABoVE: Characterization of Carbon Dynamics in Burned Forest Plots, NWT, Canada, 2014. ORNL DAAC, Oak Ridge, Tennessee, USA. https://doi.org/10.3334/ORNLDAAC/1664
Table of Contents
- Dataset Overview
- Data Characteristics
- Application and Derivation
- Quality Assessment
- Data Acquisition, Materials, and Methods
- Data Access
- References
Dataset Overview
This dataset provides field data from boreal forests in the Northwest Territories (NWT), Canada that were burned by wildfires in 2014. During fieldwork in 2015, 211 burned plots were established. From these plots, thirty-two forest plots were selected that were dominated by black spruce and were representative of the full moisture gradient on this landscape, ranging from xeric to sub-hygric. Plot observations included slope, elevation, aspect, and moisture. . At each plot, one intact organic soil profile associated with a specific burn depth was selected and analyzed for carbon content and radiocarbon (14C) values at specific profile depth increments to assess legacy carbon presence and combustion. Vegetation observations included tree density. Stand age at the time of the fire was determined from tree-ring counts. Estimates of pre-fire below and above-ground carbon pools were derived. The percent of total NWT wildfire burned area comprising of "young" stands (less than 60 years old at time of fire) was estimated.
The field plots were established in the summer of 2015 in seven spatially independent burn scars, four in the Taiga Plains ecozone and three in the Taiga Shield ecozone. Plots were classified as young-burned (stand age <60 years at the time of fire, mean=45 years) or old-burned (stand age 81 >70 years at the time of fire, mean=128 years) based on the historic fire return interval of 70-130 years in northwestern boreal forest. In each profile, Δ14C values from multiple, adjacent soil depth increments were used to assign them to the correct side of the atmospheric bomb-peak and compared to the atmospheric value of Δ14CO2 during the year that the stand established. The relationship between soil and stand Δ14C was used to assess legacy C presence and combustion. Legacy C was considered to be present if the basal soil sample was older than the stand age at time of fire, and legacy C combusted if the residual surface soil sample was older than the stand age at time of fire.
Project: Arctic-Boreal Vulnerability Experiment
The Arctic-Boreal Vulnerability Experiment (ABoVE) is a NASA Terrestrial Ecology Program field campaign based in Alaska and western Canada between 2016 and 2021. Research for ABoVE links field-based, process-level studies with geospatial data products derived from airborne and satellite sensors, providing a foundation for improving the analysis and modeling capabilities needed to understand and predict ecosystem responses and societal implications.
Related Publications:
Walker, X.J., J.L. Baltzer, S.R. Cummings, N.J. Day, S.J. Goetz, J.F. Johnstone, S. Potter, B.M. Rogers, E.A.G. Schuur, M.R. Turetsky, and M.C. Mack. 2019. Increasing wildfires threaten historic carbon sink of boreal forest soils. In review.
Walker X.J., B.M. Rogers, J.L. Baltzer, S.G. Cumming, N.J. Day, S.J. Goetz, J.F. Johnstone, E.A.G. Schuur, M.R. Turetsky, and M.C. Mack. 2018. Cross-scale controls on carbon emissions from boreal forest megafires. Glob Change Biol. 24:4251–4265. https://doi.org/10.1111/gcb.14287
Related Dataset:
Walker, X.J., B.M. Rogers, J.L. Baltzer, S.R. Cummings, N.J. Day, S.J. Goetz, J.F. Johnstone, M.R. Turetsky, and M.C. Mack. 2018. ABoVE: Wildfire Carbon Emissions and Burned Plot Characteristics, NWT, CA, 2014-2016. ORNL DAAC, Oak Ridge, Tennessee, USA. https://doi.org/10.3334/ORNLDAAC/1561
Acknowledgments:
This research received funding from the NASA Arctic Boreal and Vulnerability Experiment (ABoVE) project NNX15AT71A.
Data Characteristics
Spatial Coverage: Northwest Territories, Canada
ABoVE Reference Locations:
Domain: Core ABoVE
State/territory: Northwest Territories, Canada
Grid cells: Ah2v1Bh13Bv9Ch79Cv59, Ah2v1Bh14Bv10Ch84Cv61, Ah2v1Bh13Bv10Ch83Cv65, Ah2v1Bh14Bv10Ch84Cv65, Ah2v1Bh13Bv11Ch78Cv66, Ah2v1Bh12Bv11Ch77Cv68, Ah2v1Bh13Bv11Ch78Cv68, Ah2v1Bh12Bv11Ch75Cv71
Spatial resolution: Multiple points
Temporal coverage: Field plots were established in the summer of 2015
Temporal resolution: One time
Study Areas: All latitude and longitude given in decimal degrees.
Table 1. Coordinates for study site plots
| Site | Westernmost Longitude | Easternmost Longitude | Northernmost Latitude | Southernmost Latitude |
|---|---|---|---|---|
| Northwest Territories, Canada | -117.505 | -113.7326705 | 64.161929 | 60.9377645 |
Table 2. Coordinates for extent of estimated burned area in the NWT (NWT_Young_Burned_Area.csv).
|
Site |
Westernmost Longitude |
Easternmost Longitude |
Northernmost Latitude |
Southernmost Latitude |
|---|---|---|---|---|
|
Northwest Territories, CA |
-136.119 |
-102 |
71.69472 |
56.25417 |
Data File Information
There are three data files in comma-separated format (.csv) with this dataset.
Table 3. File names and descriptions
| File name | Description |
|---|---|
| Soil_radiocarbon_data.csv | Provides 105 radiocarbon values of soil depth increments from 32 plots that burned in the NWT in 2014 and associated plot characteristics |
| Radiocarbon_site_data.csv | Provides additional plot characteristics and estimated carbon combustion |
| NWT_Young_Burned_Area.csv | Provides the percentage of 2014 NWT burned area that was considered a young-burn (<60 years at time of fire) represented by both years since fire and year of burn from 1954-2013 |
Table 4. Variables in the file Soil_radiocarbon_data.csv
| Variable | Units | Description |
|---|---|---|
| burned_site_plot |
Plot from which soil sample was obtained. Plot name represents the burn from which sample was collected (SS33=Kakisa, ZF20=CentralHwy3, ZF46=NorthernHwy3, ZF35=Gameti West, ZF44=Gameti East, ZF26=Wekweeti, ZF104-Discovery Mine) and the plot number. |
|
| latitude | decimal degrees | Latitude at start of west transect from GPS |
| longitude | decimal degrees | Longitude at start of west transect from GPS |
| sample_transect | The meter along the transect from which the soil profile was obtained | |
| sample_monolith | The monolith number (1 or 2) obtained at each plot. In 27 plots one monolith was collected and in 5 plots two monoliths were collected | |
| site_sample_transect | The combined identification of site and meter | |
| soil_depth_increment | cm | Depth (cm) of the soil depth increment |
| increment_location | Location of the soil depth increment (TOP = either 1 cm or 2cm depth increments, BOTTOM = depth increment of variable depth - located directly above the mineral soil or at the thaw front) | |
| bottom_sol_material | Category of what the bottom of the soil organic layer profile hit (min=mineral soil; ice= frozen organic soil) | |
| field_sample_id | A sample identification of the soil depth increment sent for radiocarbon analysis | |
| uciams_id | Sample identification given by University of California, Irvine's W.M. Keck Carbon Cycle Accelerator Mass Spectrometry Laboratory, where radiocarbon samples were analyzed. | |
| Delta14C | ‰ | Delta 14C of the sample (the per mil (‰) difference between the 14C/12C ratio of the sample and an international standard). Calculated as described by Stuiver and Polach (1977) |
| std_deviation | Error of Delta 14C measurement. The standard deviation of approximately 10 repetitive measurements of the sample. | |
| soil_class_pre-post_bomb | Soil increment classification based on atmospheric bomb peak (pre = pre bomb peak; post=post bomb peak) | |
| stand_age_rings | Age of the stand at time of fire based on the number of tree rings, 5 black spruce trees were sampled at each site (these data are also provided in the file Radiocarbon_site_data.csv for user convenience) | |
| stand_year | YYYY | The year that the stand established (2014-stand_age_rings) |
| X14C_yr_stand_age | ‰ | The atmospheric concentration of Delta 14C in the year that the stand established |
| stand_age_pre-post_bomb | Stand age classification based on atmospheric bomb peak (pre = pre bomb peak; post = post bomb peak) |
Table 5. Variables in the file Radiocarbon_site_data.csv
| Variable | Units | Description |
|---|---|---|
| burned_site_plot |
Plot from which soil sample was obtained. Plot name represents the burn from which it was sampled (SS33=Kakisa, ZF20=CentralHwy3, ZF46=NorthernHwy3, ZF35=Gameti West, ZF44=Gameti East, ZF26=Wekweeti, ZF104-Discovery Mine) and the plot number. All plots are labelled A - because they were selected using a random stratified sampling design. |
|
| latitude | decimal degrees | Latitude at start of west transect from GPS |
| longitude | decimal degrees | Longitude at start of west transect from GPS |
| elevation | masl | Elevation at start of west transect from GPS. Meters above sea level |
| slope | degrees | Slope in degrees. A slope <5 was given a 0 |
| aspect | degrees | Slope aspect in compass degrees (0 to 360) - has not been corrected for declination. -9999 indicates there is no slope >5 |
| moisture_johnstone | Ranking of plot moisture potential using the moisture key presented in the successional trajectories workbook (Johnstone et al. 2008). Values range from 1 to 6, where 1=xeric, 2=subxeric, 3=subxeric to mesic, 4=mesic, 5=submesic, 6=subhygric | |
| moisture_class | Ranking of plot moisture potential from original rankings (moisture_johnstone). Dry=xeric and sub-xeric; Moist=subxeric-mesic and mesic; Wet=sub-mesic and subhygric | |
| stand_age_rings | Stand age at the time of fire, based on tree ring counts from 5 black spruce trees per site (these data are also provided in the file Soil_radiocarbon_data.csv for user convenience) | |
| stand_age_class | Stand age classification based on the age of stand at the time of fire (young= <60 years at time of fire; old = >70 years at time of fire) | |
| residual_sol_depth | cm | Mean of organic layer depth (cm) located along the transect (10 points) |
| burn_depth | Depth of burn calculated by adventitious root height and an associated unburned offset (see Walker et al. 2018a) | |
| prefire_sol_depth | cm | Depth of prefire soil organic layer (SOL) (cm). Calculated by adding burn depth to residual soil organic layer depth |
| bg_c_residual | g/m2 | Residual belowground carbon content (g C m2) |
| bg_c_combusted | g/m2 | Belowground carbon combusted (g C m2). Based on model of carbon content as a function of depth and depth of burn |
| prefire_bg_c | g/m2 | Prefire belowground carbon content (g C m2). Sum of belowground carbon combusted + residual belowground carbon (see Walker et al., 2018b for models) |
| tree_density | Number stems/m2 | Estimated density of Picea mariana stems per m2 for the pre-fire stand. Sample area was 60 sq. m. All trees and saplings that were alive at the time of the 2014 fires are included |
| tree_c_prefire | g/m2 | Aboveground carbon prefire (g C m2) |
Table 6. Variables in the file NWT_Young_Burned_Area.csv
| Column name | Units | Description |
|---|---|---|
| Year_of_burn | YYYY | Year of burn (YYYY) |
| year_since_fire | Years since the fire/s | |
| percent_reburned | % | Percent of area reburned |
| cumulative | Cumulative percent young-burned |
Application and Derivation
These data provide insights into the effects of boreal forest fires on global carbon dynamics.
Quality Assessment
Uncertainty data were not provided.
Data Acquisition, Materials, and Methods
Study Area
The study area covers portions of two ecozones, the Taiga Plains and Taiga Shield, which differ in their geological history, soils development and parent materials. Black spruce forests dominate the fine-textured, glacio-lacustrine soils found in both ecozones, while jack pine is dominant on the coarse, alluvial and glacio-fluvial soils. Low density black spruce and jack pine typically dominate the exposed bedrock characteristic of the Taiga Shield.
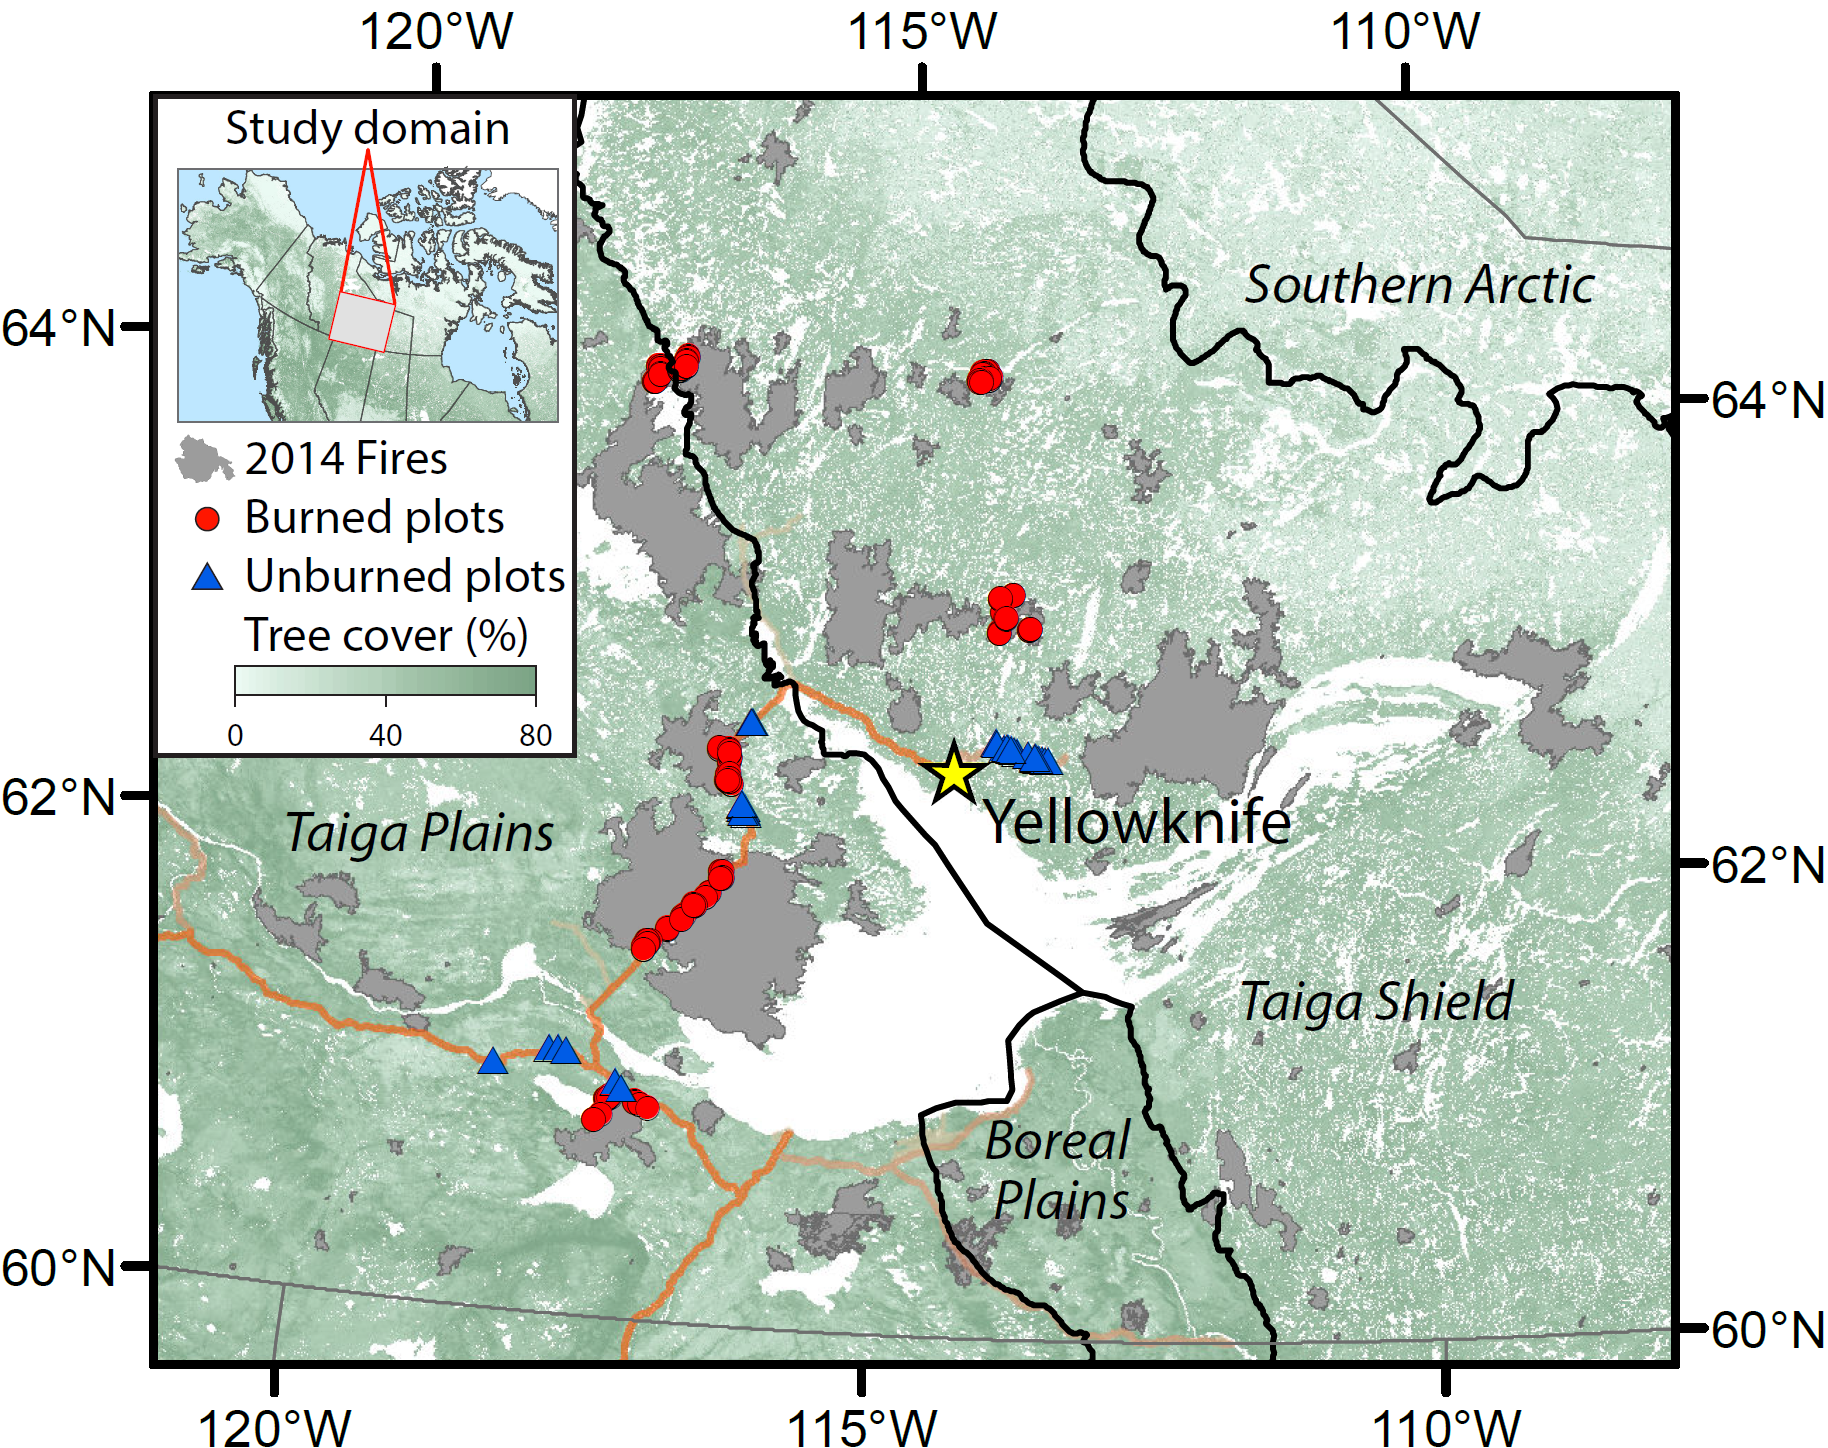
Figure 2. Map of study area locations.
Study Plots
In the summer of 2015, 211 field plots were established (171 black spruce-dominated and 40 jack pine-dominated) using a stratified random sampling design spanning seven spatially independent burn scars, four in the Taiga Plains ecozone and three in the Taiga Shield ecozone.
For the data reported in this dataset, a subset of 32 plots were selected that were dominated by black spruce and were representative of the full moisture gradient on this landscape, ranging from xeric to subhygric.
Table 3. Burned areas and study plots
| Plots | Burned area containing the plot |
|---|---|
| SS33-3A and 4A | Kakisa |
| ZF104-110 and 63B and 83B | Discovery Mine |
| ZF20-10A, 35A, 4A, 52A, 8A, 9A | CentralHwy3 |
| ZF26-104A, 112A, 112B, 118C, 54A, 7A, 96A | Wekweeti |
| ZF35-11A, 29A, 2A, 37A, 39A, 9A | Gameti West |
| ZF44-16A, 37A, 54A, 54B, 5A, 71B, 9A | Gameti East |
| ZF46-5A | NorthernHwy3 |
Each plot consisted of two 30-m parallel transects 2-m apart, running due north. Latitude, longitude, and elevation were recorded at each plot with a GPS receiver, and slope and aspect with a clinometer and compass.
- Tree-species densities were measured, and above ground C combustion was estimated.
- Five basal tree disks were collected in each plot. Tree disks were processed using standard dendrochronology techniques and tree rings were counted as an estimate of time after last fire.
- At ten points per plot the depth of the residual soil organic layer (SOL) was measured directly beside black spruce trees. In association with these points the distance from the highest adventitious root height to the top of the residual SOL was measured on 1-3 adventitious roots per tree in order to estimate SOL burn depth.
- At an additional ten points per plot, the residual SOL was measured (Walker et al., 2019).
Radiocarbon Analysis
Thirty-two plots were selected for radiocarbon analysis from the full dataset that were: 1) dominated by black spruce, the most abundant forest type pre-fire (171 out of 211 plots), 2) established randomly (‘A’ plots), and 3) representative of the full moisture gradient on this landscape, ranging from xeric to subhygric.
One soil monolith was randomly selected from each of these plots. At five plots another soil profile was randomly selected to validate the accuracy of our radiocarbon values and account for potential spatial heterogeneity within plots.
- The monoliths were bisected depth-wise, and one half of the monolith was processed to assess residual SOL carbon and model SOL C combustion.
- From the remaining half, a 1-cm sample was cut from the surface of the soil monolith (surface samples) and a 1-cm soil sample was cut directly below the surface samples (2-cm sample).
- In addition, a 1-cm soil sample was cut directly above the mineral soil (basal sample).
- There were three monoliths where the basal sample was obtained from above frozen organic soil instead of mineral soil; these samples were all from wet plots where the organic layer depth > 30 cm and legacy C was present.
- There were six soil monoliths from which only two depth increment samples were available (ie. residual SOL < 3 cm). For these monoliths, the 2-cm sample was classified as the basal sample.
- One-half of each depth increment sample was frozen for archival purposes. The light fraction of the bulk soil was obtained from the remaining halves.
Because soil age increases with depth and radiocarbon dating is expensive, three depth increments per soil profile were sampled instead of dating the entire profile. The 14C content of the samples were measured at the W. M. Keck Carbon Cycle Accelerator Mass Spectrometry Laboratory at the University of California–Irvine. In total, 105 soil samples from 32 plots were analyzed (Walker et al., 2019).
Assessing Legacy C Presence and Combustion
Radiocarbon data are expressed as Δ14C, which is the per mil (‰) difference between the 14C/12C ratio of the sample and an international standard. Due to the shape of the atmospheric bomb curve, the appropriate location of the radiocarbon value for the surface sample cannot be determined during the bomb period (1950 to present) without reference to the radiocarbon value of the 2-cm sample. Soil surface samples were assigned pre-bomb peak if the 2-cm sample was less enriched in Δ14C and soil surface samples were assigned post-bomb peak if the 2-cm sample was more enriched in Δ14C.
All basal samples were pre-bomb peak (<1966). Radiocarbon values of the basal samples were assessed to determine the presence of legacy C. Legacy C was determined to be present if the radiocarbon value of the basal sample was less than the atmospheric concentration of 14C during the year that the stand established. To determine if legacy C combusted, the Δ14C of the residual surface sample was compared to the atmospheric concentration of 14C during the year that the stand established (refer to Walker et al., 2018b for additional details).
Estimation of Burned Area and Carbon Combustion
The total area of young-burned forests was determined from polygon records from the Canadian National Burned Area Composite (NBAC) and National Fire Database (NFD). Fire records which dated back to 1965 were intersected with the 2014 fires to determine area of young-burned forests per year, and the linear relationship between year since fire and area of young-burned forests was calculated and used to fill in missing data. To estimate the carbon emissions associated with these young-burned areas a 30-m combustion product was used (Walker et al., 2018a; Walker et al., 2018b). Combustion was extracted from young-burned polygons since 1965, and the sum was increased by 4% to account for missing imagery. The estimate was extrapolated from forests 49 years and younger to 50 – 60- year old forests assuming the same mean combustion and increase in burned area. It was estimated that that 45% of these areas experienced legacy carbon combustion (Walker et al., 2019).
Data Access
These data are available through the Oak Ridge National Laboratory (ORNL) Distributed Active Archive Center (DAAC).
ABoVE: Characterization of Carbon Dynamics in Burned Forest Plots, NWT, Canada, 2014
Contact for Data Center Access Information:
- E-mail: uso@daac.ornl.gov
- Telephone: +1 (865) 241-3952
References
Stuiver, M., and H. Polach. 1977. Discussion: Reporting of 14C Data. Radiocarbon, 19, 355-363. https://doi.org/10.1017/S0033822200003672
Walker, X.J., J.L. Baltzer, S.R. Cummings, N.J. Day, S.J. Goetz, J.F. Johnstone, S. Potter, B.M. Rogers, E.A.G. Schuur, M.R. Turetsky, and M.C. Mack. 2019. Increasing wildfires threaten historic carbon sink of boreal forest soils. In review.
Walker, X.J., J.L. Baltzer, S.G. Cumming, N.J. Day, J.F. Johnstone, B.M. Rogers, K. Solvick, M.R. Turetsky, and M. Mack. 2018a. Soil organic layer combustion in boreal black spruce and jack pine stands of the Northwest Territories, Canada. Int. J. Wildland Fire 27, 125–134 (2018a). https://doi.org/10.1071/WF17095
Walker X.J., B.M. Rogers, J.L. Baltzer, S.G. Cumming, N.J. Day, S.J. Goetz, J.F. Johnstone, E.A.G. Schuur, M.R. Turetsky, and M.C. Mack. 2018b. Cross-scale controls on carbon emissions from boreal forest megafires. Glob Change Biol. 2018;24:4251–4265. https://doi.org/10.1111/gcb.14287