Documentation Revision Date: 2021-04-01
Dataset Version: 2
Summary
This product was created by the Permafrost Dynamics Observatory (PDO) project to estimate the seasonal subsidence owing to active layer thaw from the L-band interferometric SAR (InSAR) pair acquired in June and September 2017. It also estimates the vertical profile of soil volumetric water content (VWC) from the P-band polarimetric SAR (PolSAR) backscatter acquired in August by Airborne Microwave Observatory of Subcanopy and Subsurface (AirMOSS). The joint retrieval uses seasonal subsidence derived from L-band and P-band backscatter simultaneously to estimate the ALT and vertical soil moisture profile, along with uncertainties.
There are 28 files in netCDF version 4 (*.nc4) format, one for each site, included in this dataset.
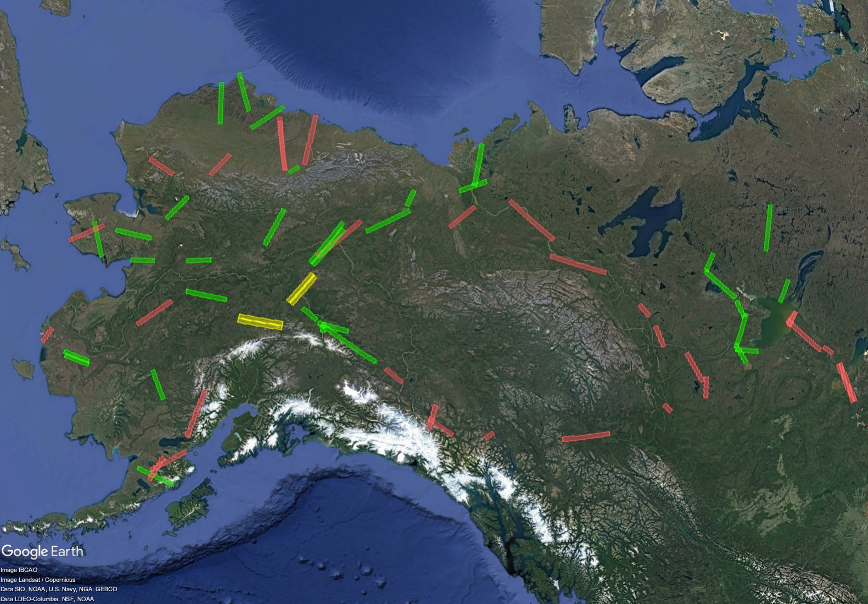
Figure 1. Sites in Version 2 of the Permafrost Dynamics Observatory Project product. Green = data delivered in Version 2. Red = not delivered in Version 2 but will be delivered in future version. Yellow = not processed due to only L-band data being available.
Citation
Schaefer, K., R.J. Michaelides, R.H. Chen, T.D. Sullivan, A.D. Parsekian, Y. Zhao, K. Bakian-Dogaheh, A. Tabatabaeenejad, M. Moghaddam, J. Chen, A.C. Chen, L. Liu, and H.A. Zebker. 2021. ABoVE: Active Layer Thickness Derived from Airborne L- and P-band SAR, Alaska, 2017. ORNL DAAC, Oak Ridge, Tennessee, USA. https://doi.org/10.3334/ORNLDAAC/1796
Table of Contents
- Dataset Overview
- Data Characteristics
- Application and Derivation
- Quality Assessment
- Data Acquisition, Materials, and Methods
- Data Access
- References
- Dataset Revisions
Dataset Overview
This dataset provides estimates of seasonal subsidence, active layer thickness (ALT), the vertical soil moisture profile, and uncertainties at a 30 m resolution for 28 sites across the ABoVE domain, including 16 sites in Alaska and 12 sites in Northwest Canada. The ALT and soil moisture profile retrievals simultaneously use L- and P-band synthetic aperture radar (SAR) data acquired by the NASA/JPL Uninhabited Aerial Vehicle Synthetic Aperture Radar (UAVSAR) instruments during the 2017 Arctic Boreal Vulnerability Experiment (ABoVE) airborne campaign.
This product was created by the Permafrost Dynamics Observatory (PDO) project to estimate the seasonal subsidence owing to active layer thaw from the L-band interferometric SAR (InSAR) pair acquired in June and September 2017. It also estimates the vertical profile of soil volumetric water content (VWC) from the P-band polarimetric SAR (PolSAR) backscatter acquired in August by Airborne Microwave Observatory of Subcanopy and Subsurface (AirMOSS). The joint retrieval uses seasonal subsidence derived from L-band and P-band backscatter simultaneously to estimate the ALT and vertical soil moisture profile, along with uncertainties.
Project: Arctic-Boreal Vulnerability Experiment
The Arctic-Boreal Vulnerability Experiment (ABoVE) is a NASA Terrestrial Ecology Program field campaign being conducted in Alaska and western Canada, for 8 to 10 years, starting in 2015. Research for ABoVE links field-based, process-level studies with geospatial data products derived from airborne and satellite sensors, providing a foundation for improving the analysis, and modeling capabilities needed to understand and predict ecosystem responses to, and societal implications of, climate change in the Arctic and Boreal regions.
Related Publications
Chen, A.C., A.D. Parsekian, K. Schaefer, E.E. Jafarov, S. Panda, L. Liu, T. Zhang, and H.A. Zebker. 2016. Ground-Penetrating Radar Measurements of Active Layer Thickness on the Alaska North Slope. Geophysics, 81(2):H1–H11. https://doi.org/10.1190/GEO2015-0124.1
Chen, R.H., A. Tabatabaeenejad, and M. Moghaddam. 2018. P-Band Radar Retrieval of Permafrost Active Layer Properties: Time-Series Approach and Validation with In-Situ Observations. IGARSS 2018 - 2018 IEEE International Geoscience and Remote Sensing Symposium. https://doi.org/10.1109/IGARSS.2018.8518179
Jafarov, E.E., A.D. Parsekian, K. Schaefer, L. Liu, A.C. Chen, S.K. Panda, and T. Zhang. 2018. Estimating active layer thickness and volumetric water content from ground penetrating radar measurements in Barrow, Alaska. Geoscience Data Journal. https://doi.org/10.3334/ornldaac/1355
Schaefer, K., L. Liu, A.D. Parsekian, E.E. Jafarov, A.C. Chen, T. Zhang, A. Gusmeroli, S.K. Panda, H.A. Zebker, T. Schaefer. 2015. Remotely Sensed Active Layer Thickness (ReSALT) at Barrow Alaska using Interferometric Synthetic Aperture Radar. Journal of Remote Sensing, 7:3735-3759. https://doi.org/10.3390/rs70403735
User Note: Schaefer et al. (2019) is Version 1 of the PDO data product. Instead of performing retrievals by using P- and L-band data in tandem as in generating Version 1 data, the method used for this Version 2 dataset integrates the seasonal subsidence model and the radar backscattering model in a joint inversion process. Version 2 replaces and supersedes the Version 1 data and includes additional sites across the ABoVE domain.
Related Datasets
Schaefer, K., R.J. Michaelides, R.H. Chen, T. Sullivan, A.D. Parsekian, K. Bakian-dogaheh, A. Tabatabaeenejad, M. Moghaddam, J. Chen, A.C. Chen, L. Liu, and H.A. Zebker. 2019. ABoVE: Active Layer Thickness Derived from Airborne L- and P-band SAR, Alaska, 2017. ORNL DAAC, Oak Ridge, Tennessee, USA. https://doi.org/10.3334/ORNLDAAC/1676
Chen, A., A. Parsekian, K. Schaefer, E. Jafarov, S.K. Panda, L. Liu, T. Zhang, and H.A. Zebker. 2015. Pre-ABoVE: Ground-penetrating Radar Measurements of ALT on the Alaska North Slope. ORNL DAAC, Oak Ridge, Tennessee, USA. http://dx.doi.org/10.3334/ORNLDAAC/1265
Jafarov, E.,A.D. Parsekian, K. Schaefer, L. Liu, A. Chen, S.K. Panda, and T. Zhang. 2016. Pre-ABoVE: Active Layer Thickness and Soil Water Content, Barrow, Alaska, 2013. ORNL DAAC, Oak Ridge, Tennessee, USA. http://dx.doi.org/10.3334/ORNLDAAC/1355
Liu, L., K. Schaefer, A. Chen, A. Gusmeroli, E. Jafarov, S. Panda, A. Parsekian, T. Schaefer, H. A. Zebker, T. Zhang. 2015. Pre-ABoVE: Remotely Sensed Active Layer Thickness, Barrow, Alaska, 2006-2011. ORNL DAAC, Oak Ridge, Tennessee, USA. http://dx.doi.org/10.3334/ORNLDAAC/1266
Liu, L., K. Schaefer, A. Chen, A. Gusmeroli, E. Jafarov, S. Panda, A. Parsekian, T. Schaefer, H. A. Zebker, T. Zhang. 2015. Pre-ABoVE: Remotely Sensed Active Layer Thickness, Prudhoe Bay, Alaska, 1992-2000. ORNL DAAC, Oak Ridge National Laboratory Distributed Active Archive Center, Oak Ridge, Tennessee, USA. https://doi.org/10.3334/ORNLDAAC/1267
Acknowledgments
This work was supported by NASA grants NNX13AM25G, NNX14A154G, NNX16AH36A, and NNX17AC59A.
Data Characteristics
Spatial Coverage: 28 sites in the ABoVE Domain, including 16 in Alaska and 12 in Canada
ABoVE Reference Locations
Domain: Core and Extended ABoVE Regions
State/Territory: Alaska, Yukon, Northwest Territories
Grid cells: See Table 1
Spatial Resolution: 30 m
Temporal Coverage: 2017-06-19 to 2017-09-16
Temporal Resolution: The estimates are one-time estimates. The surface deformation estimates are considered to represent the subsidence that occurred during the thawing season in 2017. The thaw depth and soil moisture estimates are considered to represent the active layer soil profile at maximum thaw, in which case the thaw depth is equivalent to ALT for the year 2017.
Study Area: Latitude and longitude are given in decimal degrees.
| Site | Site Code | UAVSAR Flight Lines | ABoVE Grid Cells | North Latitude | South Latitude | East Longitude | West Longitude |
|---|---|---|---|---|---|---|---|
| Alaska | |||||||
| Ambler | ambler | ambler | Bh005v002, Bh006v002 | 67.2533648 | 66.3303943 | -157.81629 | -159.41414 |
| Atqasuk | atqasu | atqasu | Bh007v001, Bh008v001 | 71.0457556 | 69.6727191 | -156.7922 | -158.29708 |
| Barrow | barrow | barrow | Bh008v001 | 71.4895144 | 70.2516655 | -154.44317 | -156.85705 |
| Coldfoot | coldfo | coldfo | Bh007v003, Bh006v004, Bh007v004 | 67.4315676 | 66.1964522 | -149.66555 | -151.11791 |
| Council | counci | counci | Bh003v002, Bh004v002, Bh004v001 | 65.5506789 | 64.5076694 | -163.25417 | -165.14618 |
| Delta Junction | deltaj | deltjA, deltjB, deltjC, djNEON | Bh006v005, Bh006v006, Bh006v007, Bh007v006, Bh007v007 | 64.4978357 | 62.8483799 | -142.08318 | -147.6053 |
| Huslia | huslia | huslia | Bh005v003 | 65.5400763 | 65.1815982 | -154.8244 | -156.79808 |
| Inigok | inigok | inigok | Bh007v002, Bh008v002 | 70.6816689 | 69.7135719 | -151.22727 | -154.19735 |
| Katmai National Park B | katmaB | katmaB | Bh001v006, Bh002v006 | 58.4873484 | 58.1228228 | -154.57597 | -157.05948 |
| Kougarok | kougar | kougar | Bh004v002, Bh005v002 | 65.7073814 | 65.4504802 | -159.96013 | -163.0292 |
| Koyuk | koyukk | koyukk | Bh004v002, Bh004v003 | 65.0616375 | 64.7098302 | -159.18804 | -161.11936 |
| Poorman | poorma | poorma | Bh004v004, Bh005v004 | 64.4237975 | 64.2583861 | -153.1226 | -156.2271 |
| Snake River | sriver | sriver | Bh003v004, Bh003v005 | 61.6822051 | 60.7736531 | -156.04572 | -157.48292 |
| Toolik | toolik | toolik | Bh008v003 | 68.8377303 | 68.5053676 | -148.97329 | -150.02527 |
| Yukon Flats | yflats | yflatE, yflatW | Bh007v004, Bh008v004, Bh007v005, Bh008v005 | 67.2070658 | 65.7327427 | -144.73525 | -147.421 |
| Yukon-Kuskokwin Delta | ykdelt | ykdelA, ykdelB | Bh002v003 | 61.3177122 | 61.0475397 | -161.86449 | -163.89005 |
| Canada | |||||||
| Aklavik Highway | aklavi | aklavi | Bh010v005 | 68.3676033 | 68.0118889 | -133.1116 | -135.55288 |
| Behchoko | behcho | behcho | Bh013v011, Bh013v010 | 62.6668191 | 62.0756687 | -116.41366 | -116.88251 |
| Daring Lake | daring | daring | Bh014v009, Bh015v009, Bh014v010 | 64.9962538 | 63.6507266 | -111.09271 | -113.32612 |
| Faber Lake | faberl | faberl | Bh013v009, Bh013v010 | 64.3921318 | 63.8563166 | -116.94599 | -118.2102 |
| Kakisa Lake A | kakisA | kakisA | Bh012v011, Bh012v012 | 61.2975291 | 60.7984522 | -116.41524 | -118.01967 |
| Kakisa Lake B | kakisB | kakisB | Bh012v011 | 61.396317 | 60.6692971 | -117.38315 | -117.9889 |
| Old Crow Airport | oldcrB | oldcrB | Bh008v005, Bh009v005 | 67.6276361 | 66.8504555 | -139.57781 | -143.16628 |
| Old Crow Flats | oldcrA | oldcrA | Bh009v005 | 68.2226757 | 67.6647719 | -139.04966 | -140.04993 |
| Fort Providence | provid | provid | Bh013v011, Bh012v011 | 62.2011249 | 61.2887645 | -116.20676 | -117.90332 |
| Snare River | snarer | snarer | Bh012v010, Bh013v010 | 63.9582782 | 62.7176466 | -116.55526 | -118.29913 |
| Inuvik to Tuk Highway | tukhwy | tukhwy | Bh010v005, Bh011v005 | 69.505042 | 68.1769914 | -132.91564 | -134.41337 |
| Yellowkhife | yellow | yellow | Bh010v005, Bh011v005 | 62.5842288 | 61.9409843 | -112.34412 | -113.81533 |
Data File Information
There are 28 files in netCDF version 4 (*.nc4) format, one for each site. The file naming convention is PDO_ReSALT_site _2017_02.nc4, where site is provided as a Site Code in Table 1.
Data File Details
Missing values are represented by -9999. The projection used is “Canada_Albers_Equal_Area_Conic” (EPSG:102001). The proj.4 string of the projection is “+proj=aea +lat_1=50 +lat_2=70 +lat_0=40 +lon_0=-96 +x_0=0 +y_0=0 +ellps=GRS80 +datum=NAD83 +units=m no_defs”.
Table 2. Variable names and descriptions.
| Variable | Units | Description |
|---|---|---|
| lat | degrees_north | Latitude coordinate |
| lon | degrees_east | Longitude coordinate |
| x | m | x coordinate of projection |
| y | m | y coordinate of projection |
| alt | m | Active layer thickness (ALT) |
| sub | m | Seasonal subsidence from L-band InSAR |
| Sw0 | vol/vol | Soil water saturation fraction at the surface (z=0) |
| wtd | m | Water table depth |
| mv_6cm | vol/vol | Soil volumetric water content averaged over 0 to 6 cm |
| mv_12cm | vol/vol | Soil volumetric water content averaged over 0 to 12 cm |
| mv_20cm | vol/vol | Soil volumetric water content averaged over 0 to 20 cm |
| mv_alt | vol/vol | Soil volumetric water content averaged over the active layer thickness |
| alt_unc | m | Uncertainty of ALT estimates |
| sub_unc | m | Uncertainty of seasonal subsidence |
| Sw0_unc | vol/vol | Uncertainty of surface water saturation |
| wtd_unc | m | Uncertainty of water table depth |
Companion Files
The Python script file generate_pdo_soil_vwc.py is provided as a companion file for users to generate the soil VWC averaged to the depth of interest. The script requires the numpy and gdal libraries. Execute the script as follows:
python generate_pdo_soil_vwc.py -s site_code -a depth_avg_in_cmwhere site_code is one listed in Table 1 and depth_avg_in_cm is the averaging depth in centimeter.
Application and Derivation
Soil moisture and active layer thickness are critical variables in understanding how permafrost and active layer dynamics respond to climate warming in high-latitude regions.
Quality Assessment
InSAR correlation data was used for both masking of poor data and uncertainty quantification. Poorly correlated pixels were masked with coherence < 0.35 because they do not provide reliable phase estimates. Uncertainties were estimated in phase from InSAR correlation using the Cramer-Rao bound (Tough et al., 1995) converted to centimeters of uncertainties in subsidence. Owing to a lack of repeat temporal airborne observations within a single thaw season, the Cramer-Rao bound estimates are considered lower-bound estimates with actual uncertainties likely larger than those we report. Nonetheless, empirical estimates of uncertainty of phase calibration yield point values of approximately 0.5—1 cm. The plausible range of uncertainty values lies between the Cramer-Rao bound and 1—2 cm.
The uncertainty in P-band PolSAR backscatter was assumed to be 0.5 dB based on absolute radiometric calibration (Chapin et al., 2015). A data cube of all possible solutions was constructed based on the forward model. All solutions were identified with a cost function value less than the P-band backscatter uncertainty. The mean of these solutions is reported as the best estimate for the desired geophysical variables and the standard deviation as uncertainty.
Data Acquisition, Materials, and Methods
InSAR Processing
InSAR uses phase differences between SAR images acquired at different times to produce interferograms of surface deformation in the radar line-of-sight direction. The interferometric phase provided by the NASA/JPL UAVSAR (https://uavsar.jpl.nasa.gov) was unwrapped using the SNAPHU algorithm (Chen and Zebker, 2002). The unwrapped interferometric phase from the line-of-sight (LOS) viewing geometry was converted to vertical motions (Chen et al., 2017). Variations in atmospheric and tropospheric water content can introduce biases into interferometric phase values (Jolivet et al., 2011). For swaths with noticeable atmospheric noise, a high pass filter was applied to remove signals at length scales on the order of atmospheric correlation (Lohman and Simons, 2005).
Daymet was used reanalyzed temperature data to generate a time series of accumulated degree days of thaw (ADDT) for each site (Thornton et al., 2016). The measured subsidence was adjusted using the ADDT time series to estimate the total seasonal subsidence of the active layer over the course of the thaw season. The Schaefer et al. (2015) technique was modified to scale the measured subsidence with the difference in ADDT between the full thaw season and the L-band SAR image acquisition dates. Some sites did not include the ADDT correction, which was added in the midst of Version 2 processing.
Known subsidence values at reference sites were used to convert the relative phase to absolute seasonal subsidence. Where available, reliable in-situ field measurements of ALT were used and converted to seasonal subsidence using the soil expansion model (Schaefer et al., 2015, Michaelides et al., 2019). For sites without reliable in situ data, the 5th percentile of deformation was chosen as zero-based on scene-wide histograms of relative deformation values. All estimates of seasonal deformation, correlation, and deformation uncertainties were projected onto the 30 m ABoVE reference grid.
Table 3. Summary of the InSAR processing steps applied to each site.
| Site Code | UAVSAR Flight Line | Calibrated to Reference Pixel | Referenced to 5th Percentile of Deformation | Atmospheric Noise Correction: PyAPS (Jolivet et al., 2011) | ADDT (Schaefer et al., 2015) |
|---|---|---|---|---|---|
| Alaska | |||||
| ambler | ambler | X | |||
| atqasu | atqasu | X | |||
| barrow | barrow | X | X | ||
| coldfo | coldfo | X | X | ||
| counci | counci | X | X | ||
| deltaj (referenced to deltjC) | deltjA | X | X | ||
| deltjB | X | X | |||
| deltjC | X | ||||
| djNEON | X | X | |||
| huslia | huslia | X | X | ||
| inigok | inigok | X | |||
| katmaB | katmaB | X | X | X | |
| kougar | kougar | X | X | ||
| koyukk | koyukk | X | X | ||
| poorma | poorma | X | X | X | |
| sriver | sriver | X | X | X | |
| toolik | toolik | X | X | X | |
| yflats (referenced to yflatW) | yflatE | X | X | X | |
| yflatW | X | X | X | ||
| ykdelt | ykdelA | X | X | ||
| ykdelB | X | X | |||
| Canada | |||||
| aklavi | aklavi | X | X | X | |
| behcho | behcho | X | X | X | |
| daring | daring | X | X | X | |
| faberl | faberl | X | X | X | |
| kakisA | kakisA | X | X | X | |
| kakisB | kakisB | X | X | X | |
| oldcrB | oldcrB | X | X | X | |
| oldcrA | oldcrA | X | X | X | |
| provid | provid | X | X | X | |
| snarer | snarer | X | X | X | |
| tukhwy | tukhwy | X | X | X | |
| yellow | yellow | X | X | X | |
Forward Models
The ground surface settles as the active layer thaws in summer mainly because groundwater takes up about 9% less volume than ground ice. Therefore, the seasonal subsidence directly relates to the volume of melted water in the active layer. The subsidence model integrates the soil VWC profile from the surface to thaw depth, multiplied by a factor accounting for the change in volume of water phase changes.
The vertical profile of VWC profile in the active layer is soil porosity times water saturation fraction. Soil porosity depends on soil composition, mineral texture, and organic matter content. The saturation fraction is the fraction of pore space filled with water. The organic matter profile is assumed to be a generalized logistic function, which can be parametrized by the surface organic matter content (OM_0) and organic layer thickness (OLT). Nominal values for OM_0 and OLT over the ABoVE domain are chosen to be 0.8 g/g and 0.15 m, respectively (Chen et al., 2019).
The forward model of P-band PolSAR backscatter includes a radar backscattering model that calculates the radar backscattering coefficients from a multilayer dielectric structure with a rough surface atop, and a soil parametrization model that translates soil physical parameters (soil organic matter, soil texture, soil moisture) to soil dielectric constant (Chen et al., 2019). The subsidence and backscatter models share the same set of parameters that characterize the active layer soils, which enables the simultaneous retrieval of ALT and soil VWC profiles using L-band InSAR and P-band PolSAR.
Joint Retrieval of ALT and Soil VWC Profile
The retrieval process is an inversion of both subsidence and backscatter models, which can be formulated as an optimization problem minimizing their cost function (L2 norm of the observation-model differences). There are four unknowns: ALT (alt), surface water saturation (Sw0), water table depth (wtd), and surface roughness (h) (Eq. 1). In order to facilitate the inversion process, which is to find the solution points that meet the cost function criteria (L2 norm smaller than the uncertainties in the measured subsidence and P-band backscatter), the data cubes of subsidence and P-band HH and VV backscatter were pre-computed with dimensions of the unknown variables. The mean and standard deviation of all the solution points that met the cost function criteria are reported as the retrieved value and associated uncertainty for the unknowns. After the retrieval, soil porosity and water saturation profiles can be calculated from the retrieved profile parameters (Sw0 and wtd) and the assumed organic matter profile, which then be used to calculate the soil VWC profile (Eq. 2).
 (1)
(1)
 (2)
(2)
The python script (companion file generate_pdo_soil_vwc.py) can be used to generate the soil VWC averaged to the depth of the user's interest. The soil VWC values averaged over the first 6, 12, 20 cm from the surface and over the entire active layer are provided.
Data Access
These data are available through the Oak Ridge National Laboratory (ORNL) Distributed Active Archive Center (DAAC).
ABoVE: Active Layer Thickness Derived from Airborne L- and P-band SAR, Alaska, 2017
Contact for Data Center Access Information:
- E-mail: uso@daac.ornl.gov
- Telephone: +1 (865) 241-3952
References
Chapin, E., A. Chau, J. Chen, B. Heavey, S. Hensley, Y. Lou, R. Machuzak, and M. Moghaddam. 2012. AirMOSS: an airborne P-band SAR to measure root-zone soil moisture. Proc. IEEE Radar Conference (RadarCon). 0693–0698. https://doi.org/10.1109/RADAR.2012.6212227
Chen, C.W., and H.A. Zebker. 2002. Phase unwrapping for large SAR interferograms: statistical segmentation and generalized network models. IEEE Trans. Geoscience Remote Sensing, 40:1709–1719. https://doi.org/10.1109/TGRS.2002.802453
Chen, A.C., A.D. Parsekian, K. Schaefer, E.E. Jafarov, S. Panda, L. Liu, T. Zhang, and H.A. Zebker. 2016. Ground-Penetrating Radar Measurements of Active Layer Thickness on the Alaska North Slope. Geophysics, 81(2):H1–H11. https://doi.org/10.1190/GEO2015-0124.1
Chen, J., R. Knight, and H.A. Zebker. 2017. The Temporal and spatial variability of the confined aquifer head and storage properties in the San Luis Valley, Colorado inferred from multiple InSAR missions. Water Resources Research, 53:9708–9720. https://doi.org/10.1002/2017WR020881
Chen, R.H., A. Tabatabaeenejad, and M. Moghaddam. 2018. P-Band Radar Retrieval of Permafrost Active Layer Properties: Time-Series Approach and Validation with In-Situ Observations. IGARSS 2018 - 2018 IEEE International Geoscience and Remote Sensing Symposium. https://doi.org/10.1109/IGARSS.2018.8518179
Chen, R.H., K. Bakian-Dogaheh, A. Tabatabaeenejad, and M. Moghaddam. 2019. Modeling and retrieving soil moisture and organic matter profiles in the active layer of permafrost soils from P-band radar observations. International Geoscience and Remote Sensing Symposium (IGARSS). 10095–10098. https://doi.org/10.1109/IGARSS.2019.8899802
Jafarov, E.E., A.D. Parsekian, K. Schaefer, L. Liu, A.C. Chen, S.K. Panda, and T. Zhang. 2018. Estimating active layer thickness and volumetric water content from ground penetrating radar measurements in Barrow, Alaska. Geoscience Data Journal. https://doi.org/10.3334/ornldaac/1355
Jolivet, R., R. Grandin, C. Lasserre, M.-P. Doin, and G. Peltzer. 2011. Systematic InSAR tropospheric phase delay corrections from global meteorological reanalysis data. Geophysical Research Letters, 38:L17311. https://doi.org/10.1029/2011GL048757
Liu, L., K. Schaefer, T. Zhang, and J. Wahr. 2012. Estimating 1992–2000 average active layer thickness on the Alaskan North Slope from remotely sensed surface subsidence. Journal of Geophysical Research, 117:F01005. https://doi.org/10.1029/2011JF002041
Lohman, R.B., and M. Simons. 2005. Some thoughts on the use of InSAR data to constrain models of surface deformation: Noise structure and data downsampling. Geochemistry, Geophysics, Geosystems, 6:Q01007. https://doi.org/10.1029/2004GC000841
Michaelides, R.J., K. Schaefer, H.A. Zebker, A. Parsekian, L. Liu, J. Chen, S. Natali, S. Ludwig, and S.R. Schaefer. 2019. Inference of the impact of wildfire on permafrost and active layer thickness in a discontinuous permafrost region using the remotely sensed active layer thickness (ReSALT) algorithm. Environmental Research Letters, 14:035007. https://doi.org/10.1088/1748-9326/aaf932
Miller, C.E., P.C. Griffith, S.J. Goetz, E.E. Hoy, N. Pinto, I.B. McCubbin, A.K. Thorpe, M. Hofton, D. Hodkinson, C. Hansen, J. Woods, E. Larson, E.S. Kasischke, and H.A. Margolis. 2019. An overview of ABoVE airborne campaign data acquisitions and science opportunities. Environmental Research Letters, 14:080201. https://doi.org/10.1088/1748-9326/ab0d44
Schaefer, K., L. Liu, A.D. Parsekian, E.E. Jafarov, A.C. Chen, T. Zhang, A. Gusmeroli, S.K. Panda, H.A. Zebker, T. Schaefer. 2015. Remotely Sensed Active Layer Thickness (ReSALT) at Barrow Alaska using Interferometric Synthetic Aperture Radar. Journal of Remote Sensing, 7:3735-3759. https://doi.org/10.3390/rs70403735
Thornton, P.E., M.M. Thornton, B.W. Mayer, Y. Wei, R. Devarakonda, R.S. Vose, and R.B. Cook. 2016. Daymet: Daily Surface Weather Data on a 1-km Grid for North America, Version 3. ORNL DAAC, Oak Ridge, Tennessee, USA. https://doi.org/10.3334/ORNLDAAC/1328
Tough, J.A., D. Blacknell, and S. Quegan. 1995. A statistical description of polarimetric and interferometric synthetic aperture radar data. Proceedings of the Royal Society of London. Series A: Mathematical and Physical Sciences, 449:567–589. https://doi.org/10.1098/rspa.1995.0059
Dataset Revisions
| Product Version | Release Date | Revision Notes |
|---|---|---|
| 2 | 2021-01-14 | Instead of performing retrievals by using P- and L-band data in tandem as in generating Version 1 data, the method used for this Version 2 dataset integrates the seasonal subsidence model and the radar backscattering model in a joint inversion process. Version 2 replaces and supersedes the Version 1 data and includes additional sites across the ABoVE domain. |
| 1 | 2019-05-08 | ORNL DAAC released Schaefer et al. (2019), Version 1 of this dataset. |