Documentation Revision Date: 2019-05-08
Dataset Version: 1
Summary
P-band SAR data were collected by the Airborne Microwave Observatory of Subcanopy and Subsurface (AirMOSS) instrument. AirMOSS uses polarimetric backscatter from P-band observations to measure the soil dielectric constant. ReSALT uses the Airborne Interferometric Synthetic Aperture Radar (InSAR) technique on L-band SAR data to measure surface subsidence from the freezing and thawing of the active layer in permafrost regions. The soil data from AirMOSS was used as input to the ReSALT subsidence model to estimate ALT along the 12 flight lines.
There are 12 data files in NetCDF (.nc4) format with this dataset; one file for each of the 12 study areas.
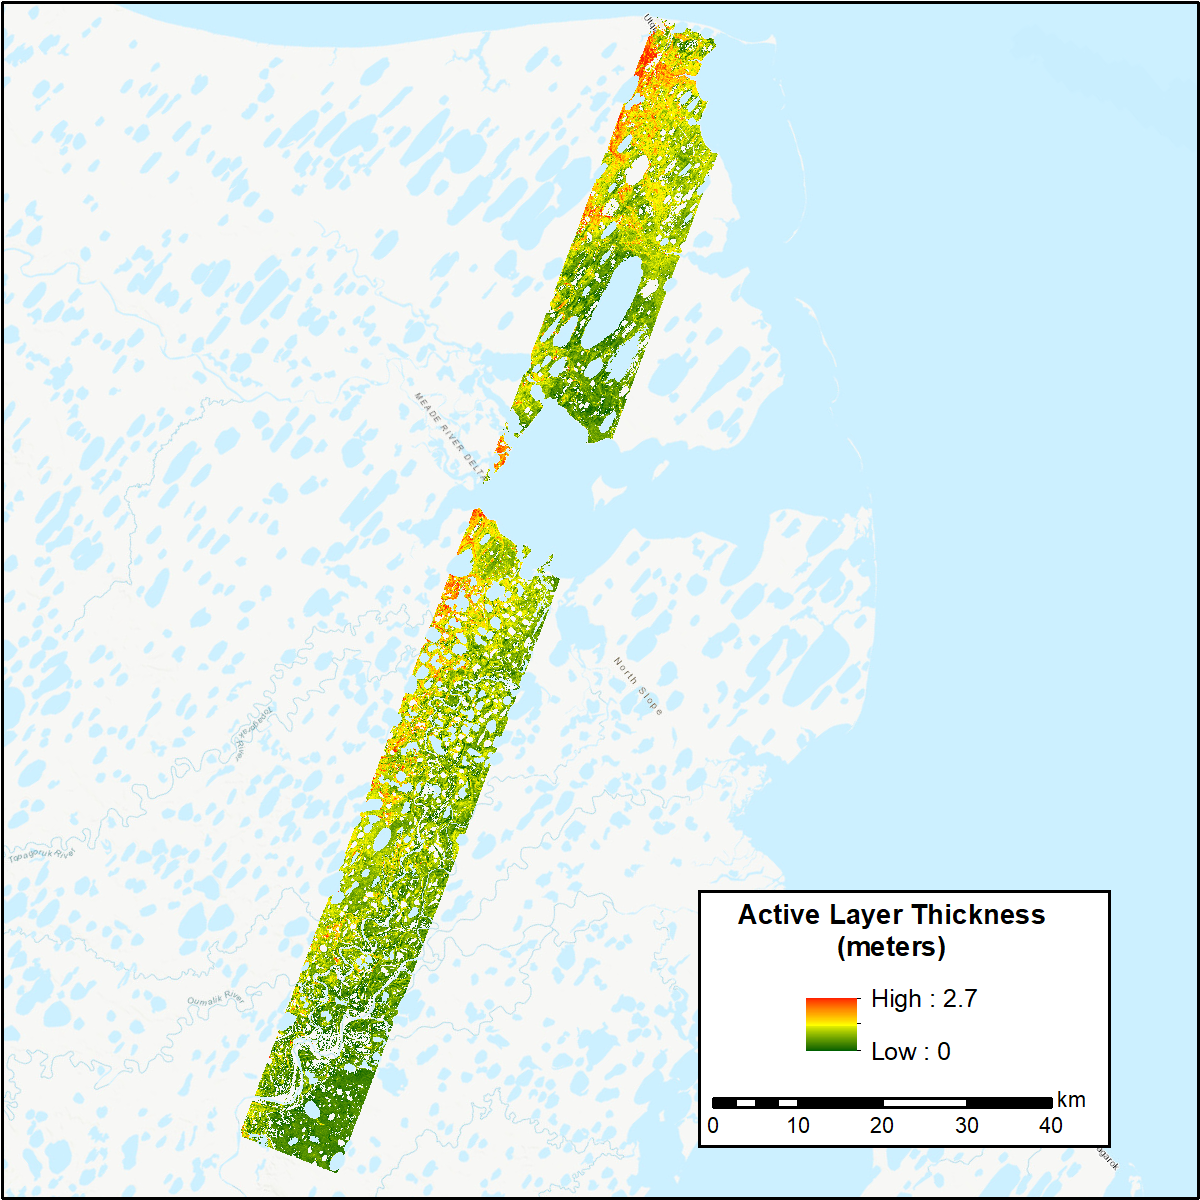
Figure 1. Active layer thickness product (30-m resolution) near Barrow (Utqiagvik), Alaska, as derived by combining overlapping airborne L-band synthetic aperture radar (SAR) soil seasonal subsidence and P-band SAR soil moisture data through the remotely-sensed active layer thickness (ReSALT) algorithm. Source: PDO_ReSALT_barrow_2017_01.nc4
Citation
Schaefer, K., R.J. Michaelides, R.H. Chen, T. Sullivan, A.D. Parsekian, K. Bakian-dogaheh, A. Tabatabaeenejad, M. Moghaddam, J. Chen, A.C. Chen, L. Liu, and H.A. Zebker. 2019. ABoVE: Active Layer Thickness Derived from Airborne L- and P-band SAR, Alaska, 2017. ORNL DAAC, Oak Ridge, Tennessee, USA. https://doi.org/10.3334/ORNLDAAC/1676
Table of Contents
- Dataset Overview
- Data Characteristics
- Application and Derivation
- Quality Assessment
- Data Acquisition, Materials, and Methods
- Data Access
- References
Dataset Overview
This dataset provides estimates of soil active layer thickness (ALT) at 30-m resolution derived by combining overlapping airborne L-band synthetic aperture radar (SAR) soil seasonal subsidence and P-band SAR soil moisture data through the remotely-sensed active layer thickness (ReSALT) algorithm for 12 study areas across Northern Alaska. The airborne data collection occurred from 2017-06-19 to 2017-09-16 on a coincident grid of flight lines with the 2017 aircraft campaign for the Arctic Boreal Vulnerability Experiment (ABoVE). Concurrently collected data including the L-band soil seasonal subsidence and the P-band soil dielectric constant and volumetric water content are provided. Calculated uncertainties for all variables are also provided.
P-band SAR data were collected by the Airborne Microwave Observatory of Subcanopy and Subsurface (AirMOSS) instrument. AirMOSS uses polarimetric backscatter from P-band observations to measure the soil dielectric constant. ReSALT uses the Airborne Interferometric Synthetic Aperture Radar (InSAR) technique on L-band SAR data to measure surface subsidence from the freezing and thawing of the active layer in permafrost regions. The soil data from AirMOSS was used as input to the ReSALT subsidence model to estimate ALT along the 12 flight lines.
Project: Arctic-Boreal Vulnerability Experiment
The Arctic-Boreal Vulnerability Experiment (ABoVE) is a NASA Terrestrial Ecology Program field campaign based in Alaska and western Canada between 2016 and 2021. Research for ABoVE links field-based, process-level studies with geospatial data products derived from airborne and satellite sensors, providing a foundation for improving the analysis and modeling capabilities needed to understand and predict ecosystem responses and societal implications.
Related Datasets:
Chen, A., A. Parsekian, K. Schaefer, E. Jafarov, S.K. Panda, L. Liu, T. Zhang, and H.A. Zebker. 2015. Pre-ABoVE: Ground-penetrating Radar Measurements of ALT on the Alaska North Slope. ORNL DAAC, Oak Ridge, Tennessee, USA. http://dx.doi.org/10.3334/ORNLDAAC/1265
Liu, L., K. Schaefer, A. Chen, A. Gusmeroli, E. Jafarov, S. Panda, A. Parsekian, T. Schaefer, H. A. Zebker, T. Zhang. 2015. Pre-ABoVE: Remotely Sensed Active Layer Thickness, Barrow, Alaska, 2006-2011. ORNL DAAC, Oak Ridge, Tennessee, USA. http://dx.doi.org/10.3334/ORNLDAAC/1266
Liu, L., K. Schaefer, A. Chen, A. Gusmeroli, E. Jafarov, S. Panda, A. Parsekian, T. Schaefer, H. A. Zebker, T. Zhang. 2015. Pre-ABoVE: Remotely Sensed Active Layer Thickness, Prudhoe Bay, Alaska, 1992-2000. ORNL DAAC, Oak Ridge National Laboratory Distributed Active Archive Center, Oak Ridge, Tennessee, USA. https://doi.org/10.3334/ORNLDAAC/1267
Chen, R.H., A. Tabatabaeenejad, and M. Moghaddam. 2019. ABoVE: Active Layer and Soil Moisture Properties from AirMOSS P-band SAR in Alaska. ORNL DAAC, Oak Ridge, Tennessee, USA. https://doi.org/10.3334/ORNLDAAC/1657
Related Publications
Chen, R. H., A. Tabatabaeenejad, and M. Moghaddam. 2019. Retrieval of permafrost active layer properties using time-series P-band radar observations. IEEE Transactions on Geoscience and Remote Sensing. Accepted. https://doi.org/10.1109/IGARSS.2018.8518179
Liu, L., K. Schaefer, T. Zhang, and J. Wahr. 2012. Estimating 1992-2000 average active layer thickness on the Alaskan North Slope from remotely sensed surface subsidence, J. Geophys. Res., 117, F01005.https://doi.org/10.1029/2011JF002041
Acknowledgements
The research was funded with NASA ABoVE grant numbers NNX13AM25G, NNX14A154G, NNX16AH36A, and NNX17AC59A.
Data Characteristics
Spatial Coverage: 12 sites in Northern Alaska: Ambler, Atqasuk, Barrow, Coldfoot, Council, Deadhorse, Huslia, Ivotuk, Kougarok, Koyuk, Teller, and Toolik.
ABoVE Reference Locations:
Domain: Core ABoVE
State/territory: Alaska
Grid cells: Ah0av0Bh3bv2, Ah0av0Bh4bv2, Ah0av0Bh5bv2, Ah0av0Bh3bv1, Ah0av0Bh4bv1, Ah0av0Bh5bv1, Ah0av0Bh4bv3, Ah0av0Bh5bv3, Ah0av0Bh5bv4, Ah1av0Bh6bv2, Ah1av0Bh7bv2, Ah1av0Bh8bv2, Ah1av0Bh9bv2, Ah1av0Bh6bv1, Ah1av0Bh7bv1, Ah1av0Bh8bv1, Ah1av0Bh9bv1, Ah1av0Bh6bv3, Ah1av0Bh7bv3, Ah1av0Bh8bv3, Ah1av0Bh9bv3, Ah1av0Bh6bv4, Ah1av0Bh7bv4, Ah1av0Bh8bv4, Ah1av0Bh6bv5, Ah1av0Bh7bv5, Ah1av0Bh7bv0, Ah1av0Bh8bv0
Spatial resolution: 30 m
Temporal coverage: 2017-06-19 to 2017-09-16
Temporal resolution: The estimates are one-time estimates. L-band InSAR pairs are formed from the over-flights in June and September 2017
Study Areas (All latitude and longitude given in decimal degrees)
|
Site |
Westernmost Longitude |
Easternmost Longitude |
Northernmost Latitude |
Southernmost Latitude |
|---|---|---|---|---|
|
Northern Alaska |
-166.57303 |
-145.60777 |
71.90512 |
64.180636 |
Data file information
There are 12 data files in NetCDF (.nc4) format with this dataset; one file for each study area. The names of the study areas correspond to the flight lines.
File Naming Convention:
The files are named by abbreviated study area names: PDO_ReSALT_site_2017_01.nc4
Where site is: ambler, atqasu, barrow, coldfo, counc, dhorse, huslia, ivotuk, kougar, koyukk, teller, or toolik
Table 1. Variables in the data files
| Variable | Units | Description |
|---|---|---|
| Lat | degrees_north | Latitude coordinate |
| lon | degrees_east | Longitude coordinate |
| x | m | x coordinate of projection |
| y | m | y coordinate of projection |
| alt | m | Active layer thickness (ALT) |
| sub | m | Seasonal subsidence from L-band InSAR |
| epsilon1 | Surface soil dielectric constant from P-band PolSAR | |
| epsilon2 | Subsurface soil dielectric constant from P-band PolSAR | |
| mv1 | vol/vol | Surface volumetric water content from P-band PolSAR |
| mv2 | vol/vol | Subsurface volumetric water content from P-band PolSAR |
| z1 | m | Surface layer depth from P-band PolSAR |
| alt_uncertainty | m | Uncertainty of ALT estimates |
| sub_uncertainty | m | Uncertainty of seasonal subsidence |
| epsilon1_uncertainty | Uncertainty of epsilon1 estimates | |
| epsilon2_uncertainty | Uncertainty of epsilon2 estimates | |
| mv1_uncertainty | vol/vol | Uncertainty of mv1 estimates |
| mv2_uncertainty | vol/vol | Uncertainty of mv2 estimates |
| z1_uncertainty | m | Uncertainty of z1 estimates |
Application and Derivation
Soil moisture profile, freeze-thaw state, and active layer thickness (ALT) are critical variables in understanding how permafrost and active layer dynamics respond to the faster climate warming in high-latitude regions (Chen et al., 2019).
Quality Assessment
Total uncertainty in seasonal subsidence is treated as the combination of phase error in the L-band interferogram and uncertainty in the phase calibration pixel. Uncertainty in the phase calibration pixel is empirically estimated by calculating the standard deviation of all phase values for a 7 x 7 pixel box centered around each phase calibration pixel (corresponding to an area ~100 m in any direction).
Uncertainties in ALT are calculated by Gaussian error propagation as in Liu et al. (2012). Uncertainties in seasonal subsidence (sub_err), surface and subsurface dielectric constant (epsilon1_err, epsilon2_err), surface and subsurface soil moisture (mv1_err, mv2_err), and surface layer depth (z1_err), as well as uncertainties in additional model parameters used by the ReSALT retrieval are propagated through the ReSALT retrieval algorithm, and individual uncertainties are then combined in quadrature to calculate the total uncertainty in ALT.
Data Acquisition, Materials, and Methods
This product is a result of the Airborne Interferometric Synthetic Aperture Radar (InSAR) and Polarimetric SAR (PolSAR) Permafrost Dynamics Observatory (PDO) Project. The PDO combined the Remotely Sensed Active Layer Thickness (ReSALT) and Airborne Microwave Observatory of Subcanopy and Subsurface (AirMOSS) retrievals to estimate active layer thickness (ALT) and soil moisture.
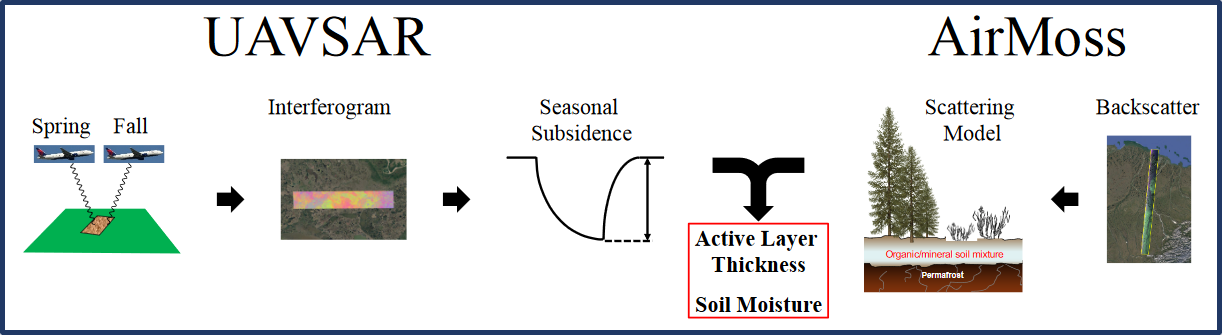
Figure 2. Combine InSAR using the L-band UAVSAR with backscatter from the P-band AirMoss to simultaneously estimate Active layer Thickness (ALT) and soil moisture. From Schaefer, 2018.
InSAR L-band
ReSALT uses the InSAR technique on L-band data to measure surface subsidence from the freezing and thawing of the active layer in permafrost regions. InSAR uses phase differences between SAR images acquired at different times to produce interferograms that map surface deformation in the radar line-of-sight direction.
SAR P-band
The AirMOSS campaign (https://airmoss.ornl.gov/) used ultra-high frequency SAR flown on a Gulfstream-III aircraft to derive estimates of soil moisture down to approximately 1.2 meters. Active layer properties, including soil dielectric constants that represent unfrozen water content and ALT, were retrieved from P-band time-series SAR observations. The AirMOSS retrieval uses polarimetric backscatter from P-band observations to measure the soil dielectric constant.
The retrieval process is an inversion of a forward radar backscattering model, where a multilayer dielectric structure is used to model the active layer and the underlying permafrost (Chen et al., 2019). The soil dielectric constant is converted to volumetric water content using the calibration equation by Engstrom et al.(2005). The active layer and permafrost are modeled as a three-layer dielectric structure ϵ(z), including the surface layer (ϵ1, z1), the saturated layer on top of permafrost (ϵ2, z2), and the permafrost (ϵ3=ϵp=5) (Figure 2). The top surface of the dielectric structure is considered a rough surface. Small perturbation method (SPM) up to the first-order developed is used as the forward model to calculate the radar backscattering coefficients from the assumed layered rough surfaces (Chen et al., 2019).
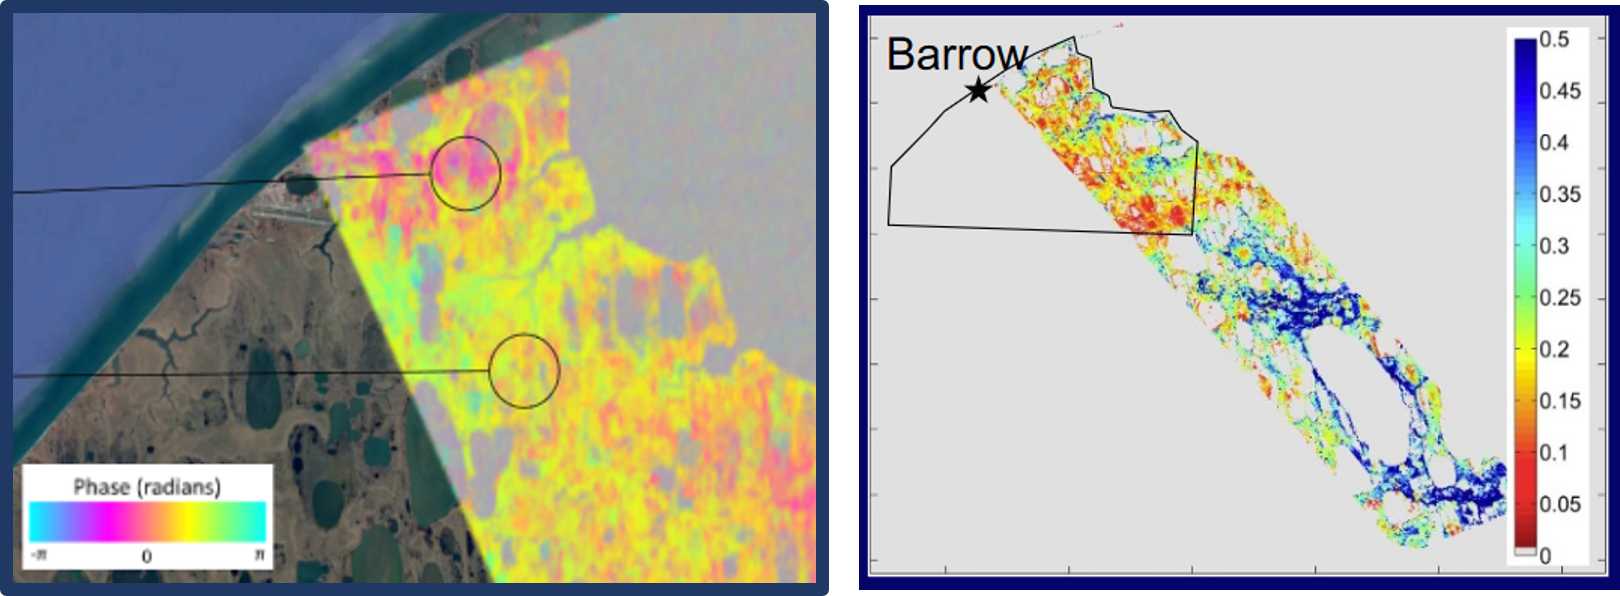
Figure 3. Near Barrow (Utqiagvik), Alaska. Left: Interferogram product from ReSALT InSAR technique on L-band data using phase differences between SAR images acquired at different times to measure surface subsidence from the freezing and thawing of the active layer in permafrost regions (Schaefer, 2018). Right: AirMOSS retrieval uses polarimetric backscatter from P-band observations to measure the soil dielectric constant and convert to soil moisture (V/V) (Schaefer et al., 2018).
Subsidence model and ALT estimation
The ground surface settles as the active layer thaws in summer mainly because groundwater takes up about 9% less volume than ground ice. Therefore, the remotely sensed seasonal subsidence is directly related to the volume of melted water in the active layer.
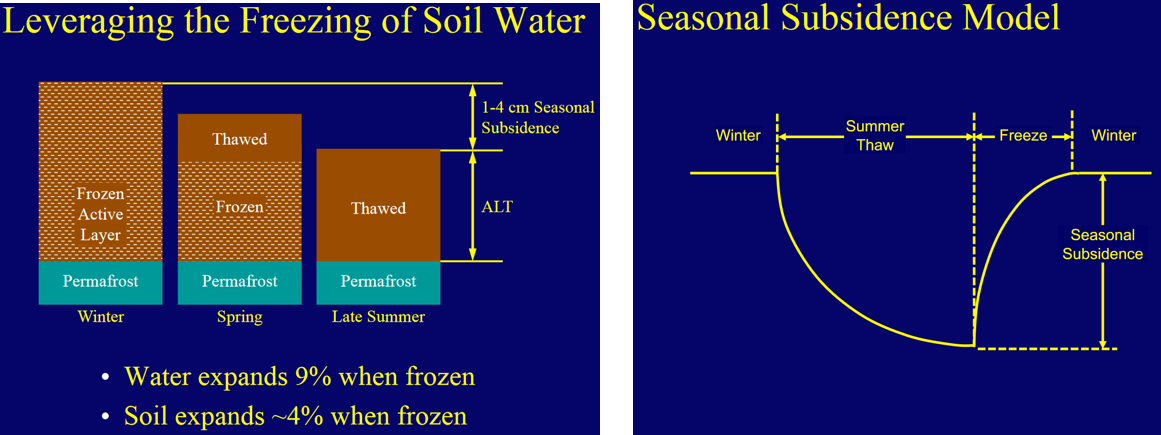
Figure 4. Soil water and the seasonal subsidence model (Schaefer et al., 2018).
Data Access
These data are available through the Oak Ridge National Laboratory (ORNL) Distributed Active Archive Center (DAAC).
ABoVE: Active Layer Thickness Derived from Airborne L- and P-band SAR, Alaska, 2017
Contact for Data Center Access Information:
- E-mail: uso@daac.ornl.gov
- Telephone: +1 (865) 241-3952
References
Chen, R. H., A. Tabatabaeenejad, and M. Moghaddam. 2019. Retrieval of permafrost active layer properties using time-series P-band radar observations. IEEE Transactions on Geoscience and Remote Sensing. Accepted. https://doi.org/10.1109/IGARSS.2018.8518179
Engstrom, R.; Hope, A.; Kwon, H.; Stow, D.; Zamolodchikov, D. Spatial distribution of near surface soil moisture and its relationship to microtopography in the Alaskan Arctic coastal plain. Nordic Hydrol. 2005, 36, 219–234. https://doi.org/10.2166/nh.2005.0016
Liu, L., K. Schaefer, T. Zhang, and J. Wahr (2012), Estimating 1992-2000 average active layer thickness on the Alaskan North Slope from remotely sensed surface subsidence, J. Geophys. Res., 117, F01005.https://doi.org/10.1029/2011JF002041.
Schaefer, Kevin, Albert Chen, Jingyi Chen, Richard Chen, Kazem Dogaheh, Elchin Jafarov, Lin Liu, Roger Michaelides, Mahta Moghaddam, Andy Parsekian, Taylor Sullivan, AlirezaTabatabaeenejad, Jeff Thompson, Howard Zebker. 2018.The Permafrost Dynamics Observatory. NASA meeting presentation. https://above.nasa.gov/meeting_jan2018/docs/Tues/1109_Schaefer_PDO.pdf
Schaefer, K. 2018. The Permafrost Dynamics Observatory (PDO). 2018. ABoVE 2018 Science Meeting Poster. https://above.nasa.gov/above2018_ab_presentations/ASTM4_Poster_Schaefer_18_74.pdf