Documentation Revision Date: 2021-12-07
Dataset Version: 1
Summary
This dataset is a companion to ABoVE: Level-4 WRF-STILT Footprint Files for Circumpolar Receptors, 2016-2019 available at https://doi.org/10.3334/ORNLDAAC/1896.
There are 350,028 data files in netCDF (*.nc) organized in 32 TAR/GZIP archives. Also included are two companion files in media (*.mp4) format.
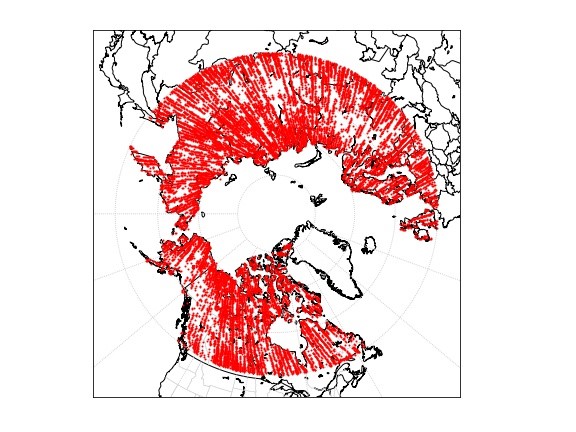
Figure 1. Locations of 17,261 receptor locations from the Orbiting Carbon Observatory-2 (OCO-2 Lite, v9) in 2017-2019. A separate NetCDF file is associated with each receptor location.
Citation
Henderson, J., M. Mountain, A. Dayalu, K. McKain, L. Hu, and T. Nehrkorn. 2021. ABoVE: Level-4 WRF-STILT Particle Trajectories for Circumpolar Receptors, 2016-2019. ORNL DAAC, Oak Ridge, Tennessee, USA. https://doi.org/10.3334/ORNLDAAC/1895
Table of Contents
- Dataset Overview
- Data Characteristics
- Application and Derivation
- Quality Assessment
- Data Acquisition, Materials, and Methods
- Data Access
- References
Dataset Overview
This dataset provides Weather Research and Forecasting (WRF) Stochastic Time-Inverted Lagrangian Transport (STILT) particle trajectory files for receptors located at positions along flight paths and at various fixed observing sites at circumpolar locations above 45 degrees North during 2016-2019. The particle files describe the motion of particles released backward in time over a 10-day period. The particle files are separated into archives by platform type (some platforms are combined) and can be characterized as either low resolution or high resolution depending on whether the subsequent footprint fields were generated on a circumpolar 0.5-degree grid (low-resolution) or both 0.5-degree and 0.1-degree grids (high-resolution). The platforms include flux towers at fixed sites, laboratory measurements of whole air samples collected by Programmable Flask Packages (PFP) onboard aircraft, and observations by NASA's Orbiting Carbon Observatory-2 satellite (Fig.1). These particle files were thinned to retain particle location information only when the particles have non-zero contributions to the corresponding footprint field. These particle files are used to compute the footprint fields available in a companion dataset. The particle trajectories that determine the footprint field are constrained only by the outer edges of the WRF modeling domain. Likewise, the companion footprint files are provided on a regular latitude-longitude grid. This dataset extends previous research on the atmospheric transport of land-surface emissions of greenhouse gases by the Carbon in Arctic Reservoirs Vulnerability Experiment (CARVE) project. In particular, the content of the low-resolution particle files is similar to those for the CARVE dataset.
This dataset is a companion to ABoVE: Level-4 WRF-STILT Footprint Files for Circumpolar Receptors, 2016-2019 available at https://doi.org/10.3334/ORNLDAAC/1896.
Project: Arctic-Boreal Vulnerability Experiment
The Arctic-Boreal Vulnerability Experiment (ABoVE) is a NASA Terrestrial Ecology Program field campaign being conducted in Alaska and western Canada, for ~10 years, starting in 2015. Research for ABoVE links field-based, process-level studies with geospatial data products derived from airborne and satellite sensors, providing a foundation for improving the analysis, and modeling capabilities needed to understand and predict ecosystem responses to, and societal implications of, climate change in the Arctic and Boreal regions.
Related Publication
Henderson, J.M., J. Eluszkiewicz, M.E. Mountain, T. Nehrkorn, R.Y.-W. Chang, A. Karion, J.B. Miller, C. Sweeney, N. Steiner, S.C. Wofsy, and C.E. Miller. 2015. Atmospheric transport simulations in support of the Carbon in Arctic Reservoirs Vulnerability Experiment (CARVE). Atmospheric Chemistry and Physics 15:4093-4116. https://doi.org/10.5194/acp-15-4093-2015
Related Datasets
CARVE Science Team. 2017. CARVE: L4 Gridded Particle Trajectories for WRF-STILT model, 2012-2016. ORNL DAAC, Oak Ridge, Tennessee, USA. https://doi.org/10.3334/ORNLDAAC/1430.
Henderson, J., J.B. Miller, T. Nehrkorn, R.Y-W. Chang, C. Sweeney, N. Steiner, S.C. Wofsy, and C.E. Miller. 2017. CARVE: L4 Gridded Footprints from WRF-STILT model, 2012-2016. ORNL DAAC, Oak Ridge, Tennessee, USA. https://doi.org/10.3334/ORNLDAAC/1431.
Henderson, J., M. Mountain, A. Dayalu, K. McKain, L. Hu, and T. Nehrkorn. 2021. ABoVE: Level-4 WRF-STILT Footprint Files for Circumpolar Receptors, 2016-2019. ORNL DAAC, Oak Ridge, Tennessee, USA. https://doi.org/10.3334/ORNLDAAC/1896
Sweeney, C., and K. McKain. 2019. ABoVE: Atmospheric Profiles of CO, CO2 and CH4 Concentrations from Arctic-CAP, 2017. ORNL DAAC, Oak Ridge, Tennessee, USA. https://doi.org/10.3334/ORNLDAAC/1658.
Acknowledgments
This project received financial support from NASA’s Terrestrial Ecology Program (grants 80NSSC19M0105, NNX17AC61A, NNX17AE75G).
Data Characteristics
Spatial Coverage: Northern hemisphere restricted to WRF domains (Fig. 2), including the entire ABoVE domain
Spatial Resolution: Point resolution
Temporal Coverage: 2016-07-24 to 2019-12-31
Temporal Resolution: hourly
Study Area: All latitudes and longitudes given in decimal degrees.
| Site | Westernmost Longitude | Easternmost Longitude | Northernmost Latitude | Southernmost Latitude |
|---|---|---|---|---|
| Northern Hemisphere | -180 | 180 | 90 | 10 |
Data File Information
There are 350,028 data files in netCDF (*.nc) organized in 32 TAR/GZIP archives. Each file provides modeled particle trajectories from a WRF-STILT simulation for one particle receptor location over a 10-day period.
The files are named stiltYYYYxMMxDDxhhxmmxLATxLONxHEIGHT.nc, where
YYYY = year of observation,
MM = month of observation,
DD = day of observation,
hh = hour of observation in UTC,
mm = minute of observation in UTC,
LAT = latitude of observation in decimal degrees,
LON = longitude of observation in decimal degrees, and
HEIGHT = height above ground level of observation in meters.
For example, the file stilt2013x06x25x04x00x65.1330Nx147.4539Wx00003.nc is one that contains modeled particle trajectories for June 25, 2013, at 4:00 UTC. The receptor observation was at 65.1330N, 127.4539W at 3 m above ground level.
The particle files are grouped into archives by platform type (though some platforms are combined) and are characterized as either "low resolution" or "high resolution", referring to the resolution of the circumpolar footprint field in the companion dataset (Henderson et al., 2021). For low-resolution files, the circumpolar footprint field above 30 degrees north (variable names beginning foot1) was generated on a 0.5-degree grid. For high-resolution files, the footprint field was generated on both 0.5-degree and 0.1-degree grids (variable names beginning foot1 and foot2, respectively). All footprint field variables, except for those beginning footnearfield1 (which appears only in the low-resolution files), cover the circumpolar region (30N to 90N, 180E to 180W) at hourly temporal resolution.
Also included are two companion files in media (*.mp4) format that illustrate the movement of 500 particles over a 10-day period as they converge at the receptor (observation) location: 69.6246N, 162.3022E. Animations show simulated particle trajectories starting at two times: 2015-04-24 0400 UTC and 2015-10-15 0200 UTC. Particle trajectories were estimated by simulating movement backward in time from the time and location of the receptor that is influenced by meteorological conditions driven by the WRF model, as well as a stochastic contribution. As simulated particles move across the globe, their path leaves a "footprint" (i.e., a two-dimensional field on the Earth's surface) that is proportional to the number of particles located in the lower half of the planetary boundary; thus, assumed to accumulate fluxes from the Earth's surface. The resulting footprint field shows the cumulative contribution of particles to the receptor location over the 10-day simulation. The WRF-STILT footprints illustrate the upwind areas that affect the greenhouse gas concentration measured at the receptor. See Henderson et al. (2015) for more information.
Table 1. Names and descriptions of the 32 TAR/GZIP archives that contain the data files. The OCO Receptor column indicates whether the receptor data were collected from the Orbiting Carbon Observatory-2 (OCO-2 Lite, v9). For non-OCO platforms, "PFP" refers to Programmable Flask Packages onboard aircraft originating from the listed site, and the remaining platforms are fixed sites collecting in situ samples of greenhouse gases.
| File Name |
Number of netCDF Files |
Spatial Resolution | OCO Receptor | Platform & Date |
|---|---|---|---|---|
| ACG_2017_insitu-particles.tar.gz | 14,320 | low | no | Alaska Coast Guard, in situ measurements, 2017 |
| ACG_2017_PFP-particles.tar.gz | 99 | low | no | Alaska Coast Guard, PFP measurements, 2017 |
| ArcticCAP_2017_insitu-particles.tar.gz | 45,450 | low | no | Arctic Carbon Aircraft Profiles, in situ measurements, 2017 |
| ArcticCAP_2017_PFP-particles.tar.gz | 331 | low | no | Arctic Carbon Aircraft Profiles, PFP measurements, 2017 |
| ASCENDS_2017_insitu-particles.tar.gz | 12,845 | high | no | Ascends/ABoVE 2017 Airborne Campaign, PFP measurements, 2017 |
| ATom2_2017_insitu-particles.tar.gz | 5667 | high | no | Atmospheric Tomography Mission (ATom), in situ measurements, January-February 2017 |
| ATom2_2017-2019-PFP-particles.tar.gz | 59 | high | no | Atmospheric Tomography Mission (ATom), PFP measurements, January- February 2017 |
| ATom3_2017_insitu-particles.tar.gz | 5598 | low | no | Atmospheric Tomography Mission (ATom), in situ measurements, September-October 2017 |
| ATom3_2018_PFP-particles.tar.gz | 31 | low | no | Atmospheric Tomography Mission (ATom), PFP measurements, September-October 2018 |
| ATom4_2017-2019_PFP-particles.tar.gz | 43 | high | no | Atmospheric Tomography Mission (ATom), PFP measurements, 2017-2019 |
| ATom4_2018_insitu-particles.tar.gz | 6011 | high | no | Atmospheric Tomography Mission (ATom), in situ measurements, April-May 2018 |
| BRW_2017-2019_PFP-particles.tar.gz | 349 | high | no | Barrow Atmospheric Baseline Observatory, PFP measurements, 2017-2019 |
| CBA_2017-2019_PFP-particles.tar.gz | 306 | high | no | Cold Bay Alaska, PFP measurements, 2017-2019 |
| EC-BRW-CRV_insitu-particles.tar.gz | 9844 | high | no | Environment Canada + Barrow Atmospheric Baseline Observatory + Carbon in Arctic Reservoirs Vulnerability Experiment, 2019 |
| ECCC_2019-particles.tar.gz | 2000 | high | no | Environment and Climate Change Canada, 2017-2019 |
| ESP_2017-2019_PFP-particles.tar.gz | 765 | high | no | Estevan Point British Columbia, PFP measurements, 2017-2019 |
| ETL_2017-2019_PFP-particles.tar.gz | 420 | high | no | East Trout Lake Saskatchewan, PFP measurements, 2017-2019 |
| LEF_2017-2019_PFP-particles.tar.gz | 717 | high | no | Park Falls Wisconsin, PFP measurements, 2017-2019 |
| NSA-7800_2016-particles.tar.gz | 7800 | low | no | Modeled using v391 terrain heights, North Slope of Alaska-7800, 2016 |
| NSA-7802_2016-particles.tar.gz | 7802 | low | no | Modeled using v351 terrain heights, North Slope of Alaska-7802, 2016 |
| OCO2-201700-d01-particles.tar.gz | 22,061 | high | yes | WRF model domain d01, January-April and August-December 2017 |
| OCO2-201700-d02-particles.tar.gz | 23,075 | high | yes | WRF model domain d02, January-May and August-December 2017 |
| OCO2-201700-d03-particles.tar.gz | 10,153 | high | yes | WRF model domain d03, January-May and August-December 2017 |
| OCO2-201705-d01-particles.tar.gz | 22,230 | high | yes | WRF model domain d01, May 2017 |
| OCO2-201706-d01-particles.tar.gz | 25,675 | high | yes | WRF model domain d01, June 2017 |
| OCO2-201706-d02-particles.tar.gz | 35,217 | high | yes | WRF model domain d02, June 2017 |
| OCO2-201706-d03-particles.tar.gz | 12,675 | high | yes | WRF model domain d03, June 2017 |
| OCO2-201707-d01-particles.tar.gz | 29,926 | high | yes | WRF model domain d01, July 2017 |
| OCO2-201707-d02-particles.tar.gz | 35061 | high | yes | WRF model domain d02, July 2017 |
| OCO2-201707-d03-particles.tar.gz | 12,428 | high | yes | WRF model domain d03, July 2017 |
| OCO2-2018-particles.tar.gz | 572 | high | yes | OCO-2, 2018 |
| PFA_2017-2019_PFP-particles.tar.gz | 498 | high | no | Poker Flat Alaska, PFP measurements, 2017-2019 |
Data File Details
Fill values or missing data are represented by -1.0E34 for all variables.
Table 2. Variables in the data files.
| Variable | Units | Description |
|---|---|---|
| All Particle Files | ||
| checkbasic | various | Basic output from Trajeccheck() |
| checkbasicnames | char | Names for checkbasic 1D array |
| checksum | various | Checksum array |
| checksumdate | days since 2000-01-01 00:00:00 UTC | Checksum date |
| checksumnames | char | Column names for checksum array |
| endpts | various | STILT particle location array thinned to retain rows containing trajectory endpts |
| endptsdate | days since 2000-01-01 00:00:00 UTC | End points date |
| endptsnames | char | Column names for particle array ‘endpts’ |
| ident | char | Identifier string |
| nchar | 1 | Numeric identifier |
| origagl | meters | Original receptor height above ground before rounding for STILT |
| origlat | degrees_north | Original receptor latitude |
| origlon | degrees_east | Original receptor longitude |
| origutctime | UTC time | Original receptor time |
| origutctimeformat | char | Format string for original receptor time |
| part3d | various | STILT particle location array thinned to retain rows approximately every so many hours. See variable names in part3dnames. |
| part3ddate | days since 2000-01-01 00:00:00 UTC | Date of part3d |
| part3dnames | char | Column names for particle array ‘part3d’ |
| partfoot | various | STILT particle location array thinned to retain rows where foot > 0 |
| partfootdate | days since 2000-01-01 00:00:00 UTC | Date of partfoot |
| partfootnames | char | Column names for particle array ‘partfoot’ |
| Low-Resolution Files Only | ||
| foot1 | ppm per (μmol m-2 s-1) | Gridded STILT footprint in time, latitude, longitude at 0.5 degree resolution |
| foot1date | days since 2000-01-01 00:00:00 UTC | Date of foot1 |
| foot1hr | hours | Hours back from STILT start time encoded in the filename |
| foot1lat | degrees_north | Degrees latitude of center of grid cells |
| foot1lon | degrees_east | Degrees longitude of center of grid cells |
| footnearfield1 | ppm per (μmol m-2 s-1) | Gridded STILT footprint at 0.1 degree resolution near receptor location |
| footnearfield1date | days since 2000-01-01 00:00:00 UTC | Date for footnearfield1 |
| footnearfield1hr | hours | Hours back from STILT start time for footnearfield1 |
| footnearfield1lat | degrees_north | Degrees latitude of center of grid cells |
| footnearfield1lon | degrees_east | Degrees longitude of center of grid cells |
Application and Derivation
WRF-STILT particle files and footprints are independent of chemical species, but they have supported accurate estimates of CO2 and CH4 surface-atmosphere fluxes using airborne and tower observations. Simulated CO2 mole fractions from the Polar Vegetation Photosynthesis and Respiration Model (PolarVPRM; Luus and Lin, 2015) based on WRF-STILT footprints show strong agreement with tower observations, suggesting that the WRF-STILT model does a good job representing the meteorology of the region (Karion et al., 2016). This dataset extends previous research on the atmospheric transport of land-surface emissions of greenhouse gasses by the CARVE project (Miller and Dinardo, 2012).
Quality Assessment
Preliminary analysis demonstrated overall agreement between WRF outputs and quality-controlled surface and radiosonde observations. Analysis of STILT footprints for CARVE that followed a similar procedure showed realistic seasonal variability and good agreement with tower observations, indicating that WRF-STILT footprints are of high quality and support accurate estimates of CO2 and CH4 surface-atmosphere fluxes using CARVE observations (Henderson et al., 2015).
Data Acquisition, Materials, and Methods
This project sought to model the movement of greenhouse gases from the land-surface emissions in the atmosphere using the WRF-STILT coupled model. Location data from aircraft samples and flux tower locations were treated as receptors in the Stochastic Time-Inverted Lagrangian Transport (STILT) model (Lin et al., 2003). Atmospheric motions were driven by meteorological fields from the Weather and Research Forecasting (WRF) model (Skamarock and Klemp, 2008). The WRF model was configured to generate high-quality, high-resolution meteorological fields over the Arctic and boreal Alaska and Northwest Canada. The WRF model as run for this project closely follows the model configuration of Nehrkorn et al. (2018). The WRF-STILT modeling framework is more broadly described in Henderson et al. (2015).
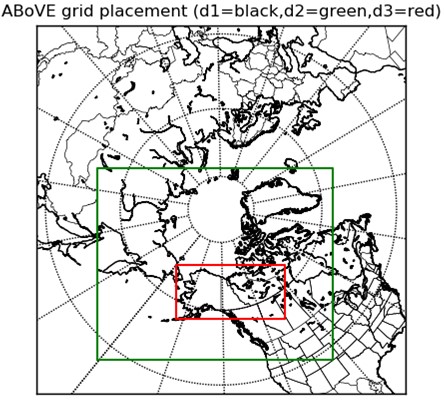
Figure 2. WRF triply-nested domains for particle simulations.
STILT is a Lagrangian particle dispersion model that is applied backward in time from a measurement location (the "receptor" location), to create the adjoint of the transport model in the form of a "footprint" field (Nehrkorn et al., 2010, Henderson et al., 2015). The footprint, with units of mixing ratio (ppm of CO2; ppb of CH4) per (μmol m-2 s-1), quantifies the influence of upwind surface fluxes on concentrations measured at the receptor and is computed by counting the number of particles in a surface-influenced volume and the time spent in that volume. The resulting footprint is a gridded product that illustrates the areas over time steps of the simulation that contribute to particle concentrations measured at a given location, altitude, and time.
The particle trajectory files (i.e., netCDF files beginning stilt) that correspond to the low-resolution footprint files (i.e., netCDF files beginning foot) in the companion dataset (Henderson et al., 2021) contain a copy of the footprint fields. For the high-resolution files, the 0.1-degree footprint fields are large and are not included in these particle files. The content of the low-resolution particle files is similar to those for the CARVE dataset (CARVE Science Team, 2017) and includes the CARVE-era 0.5 degree footprints.
Data Access
These data are available through the Oak Ridge National Laboratory (ORNL) Distributed Active Archive Center (DAAC).
ABoVE: Level-4 WRF-STILT Particle Trajectories for Circumpolar Receptors, 2016-2019
Contact for Data Center Access Information:
- E-mail: uso@daac.ornl.gov
- Telephone: +1 (865) 241-3952
References
CARVE Science Team. 2017. CARVE: L4 Gridded Particle Trajectories for WRF-STILT model, 2012-2016. ORNL DAAC, Oak Ridge, Tennessee, USA. https://doi.org/10.3334/ORNLDAAC/1430.
Henderson, J.M., J. Eluszkiewicz, M.E. Mountain, T. Nehrkorn, R.Y.-W. Chang, A. Karion, J.B. Miller, C. Sweeney, N. Steiner, S.C. Wofsy, and C.E. Miller. 2015. Atmospheric transport simulations in support of the Carbon in Arctic Reservoirs Vulnerability Experiment (CARVE). Atmospheric Chemistry and Physics 15:4093-4116. https://doi.org/10.5194/acp-15-4093-2015.
Henderson, J., M. Mountain, A. Dayalu, K. McKain, L. Hu, and T. Nehrkorn. 2021. ABoVE: Level-4 WRF-STILT Footprint Files for Circumpolar Receptors, 2016-2019. ORNL DAAC, Oak Ridge, Tennessee, USA. https://doi.org/10.3334/ORNLDAAC/1896
Karion, A., C. Sweeney, J.B. Miller, A.E. Andrews, R. Commane, S. Dinardo, J.M. Henderson, J. Lindaas, J.C. Lin, K.A. Luus, T. Newberger, P. Tans, S.C. Wofsy, S. Wolter, and C.E. Miller. 2016. Investigating Alaskan methane and carbon dioxide fluxes using measurements from the CARVE tower. Atmos. Chem. Phys. 16:5383-5398. https://doi.org/10.5194/acp-16-5383-2016.
Lin, J. C., C. Gerbig, S.C. Wofsy, A.E. Andrews, B.C. Daube, K.J. Davis, and C.A. Grainger. 2003. A near-field tool for simulating the upstream influence of atmospheric observations: The Stochastic Time-Inverted Lagrangian Transport (STILT) model. J. Geophysical Research 108:4493. https://doi.org/10.1029/2002JD003161.
Luus, K.A. and J.C. Lin. 2015. The Polar Vegetation Photosynthesis and Respiration Model: a parsimonious, satellite-data-driven model of high-latitude CO2 exchange. Geoscientific Model Development 8:2655–2674. https://doi.org/10.5194/gmd-8-2655-2015
Miller, C.E., and S.J. Dinardo, S.J. 2012. CARVE: The Carbon in Arctic Reservoirs Vulnerability Experiment. 2012 IEEE Aerospace Conference. http://dx.doi.org/10.1109/AERO.2012.6187026.
Nehrkorn, T., J. Henderson, M.E. Mountain, Y. Barrera, J.D. Hegarty, M.R. Sargent, A.E. Andrews, B. Baier and S.C. Wofsy. 2018. Evaluation of recent WRF options for modeling atmospheric transport of greenhouse gases at regional and urban scales. 2018 AGU Fall Meeting, Washington, DC., 10-14 December 2018. Abstract #B21J-2464. https://ui.adsabs.harvard.edu/abs/2018AGUFM.B21J2464N/abstract.
Nehrkorn, T., J. Eluszkiewicz, S.C. Wofsy, J.C. Lin, C. Gerbig, M. Longo, and S. Freitas. 2010. Coupled weather research and forecasting-stochastic time-inverted lagrangian transport (WRF-STILT) model. Meteorology and Atmospheric Physics 107:51-64. https://doi.org/10.1007/s00703-010-0068-x.
Skamarock, W.C. and J.B. Klemp. 2008. A time-split nonhydrostatic atmospheric model for weather research and forecasting applications. Journal of Computational Physics 227:3465-3485. https://doi.org/10.1016/j.jcp.2007.01.037.