Documentation Revision Date: 2022-06-24
Dataset Version: 1
Summary
There are 970 data files included in this dataset: Eight files are in comma-separated values (CSV; *.csv) format and 962 digital photographs are in JPEG (*.jpg) format.
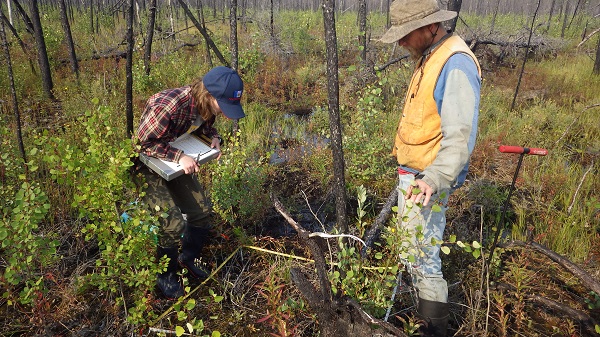
Figure 1. Researchers collecting data on vegetation and biophysical characteristics at a study site in Northwest Territories of Canada that was burned by wildfires in 2014-2015.
Citation
Bourgeau-Chavez, L.L., S.E. Grelick, N.H.F. French, D. Tanzer, and E.S. Kane. 2022. ABoVE: Post-Fire and Unburned Vegetation Community and Field Data, NWT, Canada, 2017. ORNL DAAC, Oak Ridge, Tennessee, USA. https://doi.org/10.3334/ORNLDAAC/1771
Table of Contents
- Dataset Overview
- Data Characteristics
- Application and Derivation
- Quality Assessment
- Data Acquisition, Materials, and Methods
- Data Access
- References
Dataset Overview
This dataset provides vegetation community characteristics, soil moisture, and biophysical data collected in 2017 from 11 study sites in the ABoVE Study area. The 11 study areas contained 28 sites that were burned by wildfires in 2014 and 2015, and 10 unburned sites in the Northwest Territories (NWT), Canada. Burned sites included peatland and upland. These field data include assessment of burn severity, vegetation inventories, ground cover, diameter and height for trees and shrubs, seedling and sprouting cover, soil moisture, and depth of unfrozen soil. Plot sizes were 10 m x 10 m with smaller subplots for selected measurements. Similar data were collected for these sites in the years 2015-2019 and are available in related separate datasets. Field data are provided in CSV format. The dataset includes digital photographs (in JPEG format) of vegetation conditions at sampling sites.
Project: Arctic-Boreal Vulnerability Experiment
The Arctic-Boreal Vulnerability Experiment (ABoVE) is a NASA Terrestrial Ecology Program field campaign being conducted in Alaska and western Canada, for 8 to 10 years, starting in 2015. Research for ABoVE links field-based, process-level studies with geospatial data products derived from airborne and satellite sensors, providing a foundation for improving the analysis, and modeling capabilities needed to understand and predict ecosystem responses to, and societal implications of, climate change in the Arctic and Boreal regions.
Related Datasets
Bourgeau-Chavez, L.L., N.H.F. French, S. Endres, L. Jenkins, M. Battaglia, E. Serocki, and M. Billmire. 2016. ABoVE: Burn Severity, Fire Progression, Landcover and Field Data, NWT, Canada, 2014. ORNL DAAC, Oak Ridge, Tennessee, USA. https://doi.org/10.3334/ORNLDAAC/1307
- Bourgeau-Chavez et al. (2016) provides maps of peatland vegetation and fire progression during the 2014 fire season along with field data on burn severity, and the depth of peat and thawed ground at 30 burned sites. Aboveground biomass, soil moisture, and seedling sprouting data were collected at 17 of 30 sites.
Bourgeau-Chavez, L.L., S. Endres, L. Jenkins, M. Battaglia, E. Serocki, and M. Billmire. 2017. ABoVE: Burn Severity, Fire Progression, and Field Data, NWT, Canada, 2015-2016. ORNL DAAC, Oak Ridge, Tennessee, USA. https://doi.org/10.3334/ORNLDAAC/1548
- Bourgeau-Chavez et al. (2017) includes a fire progression map for 2015 and field data on biophysical and vegetation community characteristics as measured in Bourgeau-Chavez et al. (2016). Field data are from sites burned in 2014 and 2015.
Bourgeau-Chavez, L.L., J.A. Graham, S. Endres, N.H.F. French, M. Battaglia, D. Hansen, and D. Tanzer. 2019. ABoVE: Ecosystem Map, Great Slave Lake Area, Northwest Territories, Canada, 1997-2011. ORNL DAAC, Oak Ridge, Tennessee, USA. https://doi.org/10.3334/ORNLDAAC/1695
- Bourgeau-Chavez et al. (2019) provides ecosystem type map of the area surrounding Great Slave Lake, Northwest Territories, Canada for the time period 1997 to 2011 before the large fire season of 2014 to better understand the effects of fires in the area.
Bourgeau-Chavez, L.L., M. Battaglia, E.S. Kane, L.M. Cohen, and D. Tanzer. 2019. ABoVE: Post-Fire and Unburned Vegetation Community and Field Data, NWT, Canada, 2018. ORNL DAAC, Oak Ridge, Tennessee, USA. https://doi.org/10.3334/ORNLDAAC/1703
Bourgeau-Chavez, L.L., M.J. Battaglia, P. Siqueira, C. Weinstein, S. Rose, H. Smith, D. Uhelski, and D.J.L. Vander Bilt. 2021. ABoVE: Post-Fire and Unburned Vegetation Community and Field Data, NWT, Canada, 2019. ORNL DAAC, Oak Ridge, Tennessee, USA. https://doi.org/10.3334/ORNLDAAC/1900
- Bourgeau-Chavez et al. (2019) and Bourgeau-Chavez et al. (2021) hold field data collected in 2018 and 2019 from sites burned in 2014 and 2015. In addition, nine unburned sites were established for validation of UAVSAR airborne data collection. The same biophysical and vegetation community characteristics as measured in Bourgeau-Chavez et al. (2016; 2017) are included along with additional measures of woody vegetation.
Collectively, Bourgeau-Chavez et al. (2017; 2019; 2021; 2022) provide data on the impacts of the 2014 and 2015 fires on peatland ecosystems in NWT and the subsequent recovery of vegetation communities in those ecosystems from 2015 to 2019. The variables in the field data are highly similar across years; however, there are differences between the datasets due to the addition of new metrics and new sites as well as the abandonment of others.
Acknowledgments
This research was funded by NASA’s Terrestrial Ecology Program (grant 80NSSC19M0107).
Data Characteristics
Spatial Coverage: Near Great Slave Lake in Northwest Territories, Canada
ABoVE Reference Locations
Domain: Core ABoVE
State/territory: NWT
Region: Great Slave Lake
Grid Cells: Ah002v001, Bh012v011, Bh013v010, Bh013v011, Bh014v011, Ch075v071, Ch076v069, Ch076v071, Ch077v068, Ch078v067, Ch078v069, Ch079v065, Ch079v066, Ch083v067, Ch084v067, Ch084v068
Spatial Resolution: Field plot sizes range from 1–100 m2
Temporal Coverage: 2017-08-03 to 2017-08-10 (some plot data from 2015-07-13 are included)
Temporal Resolution: One-time estimates
Study Area: Latitude and longitude are given in decimal degrees.
| Site | Westernmost Longitude | Easternmost Longitude | Northernmost Latitude | Southernmost Latitude |
|---|---|---|---|---|
| Northwest Territories, Canada | -117.3784 | -111.3674 | 62.5828 | 60.5236 |
Data File Information
There are eight data files in comma-separated values (*.csv) format (Table 1) that provide measurements of vegetation, soil moisture, depth of the unfrozen ground, and other biophysical data collected in 2017 from sites in 11 study areas. These areas include sites that were burned by wildfire in 2014 or 2015 and also unburned sites (Table 2).
There are also 962 digital photographs in JPEG format (*.jpg). The files are named Site_Plot_XXX_Y.jpg, where
- Site = site name (Table 2)
- Plot = plot number, typically 1 to 6
- XXX = direction facing (N, E, W, S, nadir), "seedling" for seedling quadrat, or "other" for a miscellaneous photograph.
- Y = "a" or "b"; optional, used if >1 photo of a given XXX type is included for the plot.
Data File Details
Missing data are reported as NA if the column is text and as -9999 if the column is numeric.
Table 1. File names and descriptions.
| File Name | Description |
|---|---|
| NWT_Wildfires_Field_data_summary_2017.csv | This file provides a summary of the field data collected at each site. It includes geographic coordinates, date of sampling, and types of data collected at 42 sites in 11 study areas. Site names that include "VAL" indicate unburned, validation sites for this study. |
| NWT_Wildfires_Burn_severity_Regrowth_2017.csv | Data for burn severity, the cover of woody and herbaceous vegetation, mosses, and liverworts along with measurements of peat, depth of unfrozen soil, and soil pH at 28 sites burned in 2014-2015 wildfires. The file lists the file names of photographs taken at these sites. |
| NWT_Wildfires_Biophysical_2017.csv | Data on ground, shrub, and canopy cover and ecosystem characteristics. |
| NWT_Wildfires_Biophysical_Inventory_2017.csv | Data on trees and shrubs. |
| NWT_Wildfires_Seedling_Sprouting_2017.csv | Data on seedlings/sproutings in areas affected by wildfires. |
| NWT_Wildfires_SoilMoisture_HydrosenseI_2017_BurnedSites.csv | Soil moisture and temperature data for sites affected by wildfires. |
| NWT_Wildfires_SoilMoisture_HydrosenseI_2017_UnburnedSites.csv | Soil moisture and temperature data for unburned, validation sites. |
| NWT_Wildfires_Unburned_validation_2017.csv | Data on topography, depth of unfrozen soil, ground cover, woody vegetation, and peat depth for unburned validation sites. The file lists file names of photographs taken at these sites. |
Table 2. Names of study areas and sites. Study areas with "Val" in the name are unburned, validation sites.
| Study Area | Sites |
|---|---|
| SS3 | SS3-28, SS3-29, SS3-64, SS3-65, SS3-200 |
| SS50 | SS50-3, SS50-200 |
| ZF14 | ZF14-3, ZF14-200, ZF14-203, ZF14-207, ZF14-208, ZF14-210, ZF14-220 |
| ZF17 | ZF17-6, ZF17-7, ZF17-9, ZF17-40, ZF17-200, ZF17-203, ZF17-206, ZF17-207 |
| ZF20 | ZF20-3, ZF20-10, ZF20-26, ZF20-47 |
| ZF28 | ZF28-201 |
| ZF46 | ZF46-14 |
| SS3-Val | SS3-Val205 |
| ZF14-Val | ZF14-Val200, ZF14-Val-2R, ZF14-Val6, ZF14-Val7R |
| ZF20-Val | ZF20-Val200, ZF20-Val201, ZF20-Val202, ZF20-Val210 |
| ZF46-Val | ZF46-Val200 |
Table 3. Variables names and descriptions in the file NWT_Wildfires_Field_data_summary_2017.csv.
| Variable | Unit | Description |
|---|---|---|
| Site | Unique name given to a field site | |
| Plot | Plot number for sampling location (1 to 6) | |
| Site_Name | Site name followed by plot number | |
| Date | YYYY-MM-DD | |
| Latitude | degrees_north | |
| Longitude | degrees_east | |
| BurnSeverity | Yes/No/YYYY | Presence of Burn Severity Data / other year of collection provided if applicable |
| Seedling/Sprouting | Presence of seedling/Sprouting Data: Yes or No | |
| Biophysical | Yes/No/YYYY | Presence of Biophysical Data / other year of collection provided if applicable |
| Soil Moisture | Presence of Soil Moisture Data: Yes or No | |
| comment |
Table 4. Variables names and descriptions in the file NWT_Wildfires_Burn_severity_Regrowth_2017.csv.
| Variable | Unit | Description |
|---|---|---|
| Site | Unique name given to a field site | |
| Plot | Plot number (1-6 typically) | |
| Date | YYYY-MM-DD | Date of field data collection |
| Time | HH:MM | Time at which fieldwork began in local time (MDT) |
| Observers | Initials of person(s) who collected data | |
| Latitude | degrees_north | Latitude from GPS measured field location |
| Longitude | degrees_east | Longitude from GPS measured field location |
| Aspect | Cardinal direction that slope is facing | |
| Slope Position | Location of field site on sloped land: top, middle, base | |
| Slope_percent | percent | Percent rise-over-run for hillslope estimated |
| Elevation | m | Height above mean sea level from the GPS unit |
| Fire History | Fire history known: Yes or No | |
| Year of burn | YYYY | Year of recent fire |
| Ecosystem_Class | Type of ecosystem, separately or in combination; Fen, Bog/Bog Like Treed Fen/Fen Like, Shrub Fen/Fen Like, Open Fen/Fen Like, Peatland Like, Peaty Spruce, Upland, Aspen Upland, Black Spruce Upland*see reference | |
| Ash | Amount of ash present on ground surface: No, Light, Moderate, or Heavy | |
| Moss_Unburned | percent | Percent of moss in 10-m x 10-m plot that is unburned |
| Moss_Singed | percent | Percent of moss in 10-m x 10-m plot that is singed |
| Moss_Light | percent | Percent of moss in 10-m x 10-m plot that is lightly burned |
| Moss_Moderate | percent | Percent of moss in 10-m x 10-m plot that is moderately burned |
| Moss_Severe | percent | Percent of moss in 10-m x 10-m plot that is severely burned |
| Litter_Unburned | percent | Percent of litter in 10-m x 10-m plot that is unburned |
| Litter_Singed | percent | Percent of litter in 10-m x 10-m plot that is lightly singed |
| Litter_Charred | percent | Percent of litter in 10-m x 10-m plot that is charred |
| Litter_Ashed | percent | Percent of litter in 10-m x 10-m plot that is ashed |
| Shrub_Unburned | percent | Percent of shrubs in 10-m x 10-m plot that is unburned |
| Shrub_Scorched | percent | Percent of shrubs in 10-m x 10-m plot that is lightly scorched |
| Shrub_LimbsLeft | percent | Percent of shrubs in 10-m x 10-m plot with some limbs left |
| Shrub_Consumed | percent | Percent of shrubs in 10-m x 10-m plot that is consumed |
| Canopy_NoMortality | percent | Percent of trees in 10-m x 10-m plot with no tree mortality |
| Canopy_DeadTreeNoFoliageConsumed | percent | Percent of trees in 10-m x 10-m plot with dead trees but no foliage consumed |
| Canopy_NeedlesSmallBranchesBurrned | percent | Percent of trees in 10-m x 10-m plot with needles and small branches burned |
| Canopy_SomeSecondayBranchesRemain | percent | Percent of trees in 10-m x 10-m plot with some secondary branches remaining |
| Canopy_>30percentPrimaryBranchesRemain | percent | Percent of trees in 10-m x 10-m plot with secondary branches burned and >30% of primary branches left |
| Canopy_<30percentPrimaryBranchesRemain | percent | Percent of trees in 10-m x 10-m plot with <30% primary branches remaining |
| Canopy_NoPrimaryBranchesPoleCharreed | percent | Percent of trees in 10-m x 10-m plot with no primary branches and pole charred |
| Adventitious_Root1 | cm | Height from current ground level up to one randomly selected adventitious root |
| Adventitious_Root2 | cm | Height from current ground level up to one randomly selected adventitious root |
| Adventitious_Root3 | cm | Height from current ground level up to one randomly selected adventitious root |
| Adventitious_Root4 | cm | Height from current ground level up to one randomly selected adventitious root |
| Adventitious_Root5 | cm | Height from current ground level up to one randomly selected adventitious root |
| NadirCover_Trees_Live | percent | * Nadir percent cover of live trees in 10-m x 10-m plot |
| NadirCover_ShrubLive | percent | * Nadir percent cover of live shrubs in 10-m x 10-m plot |
| NadirCover_ShrubDead | percent | * Nadir percent cover of dead shrubs in 10-m x 10-m plot |
| NadirCover_LiveWoodyDebris | percent | * Nadir percent cover of live woody debris in 10-m x 10-m plot |
| NadirCover_WoodyDebris | percent | * Nadir percent cover of woody debris in 10-m x 10-m plot |
| NadirCover_HerbaceousLive | percent | * Nadir percent cover of live herbaceous in 10-m x 10-m plot |
| NadirCover_HerbaceousDead | percent | * Nadir percent cover of dead herbaceous in 10-m x 10-m plot |
| NadirCover_MossLive | percent | * Nadir percent cover of live moss in 10-m x 10-m plot |
| NadirCover_MossLive_notes | Notes for NadirCover_MossLive | |
| NadirCover_MossDead | percent | * Nadir percent cover of dead moss in 10-m x 10-m plot |
| NadirCover_MossDead_notes | Notes for NadirCover_MossDead | |
| NadirCover_LiverwortLive | percent | * Nadir percent cover of live liverwort in 10-m x 10-m plot |
| NadirCover_LiverwortDead | percent | * Nadir percent cover of dead liverwort in 10-m x 10-m plot |
| NadirCover_MineralSoil | percent | * Nadir percent cover of exposed mineral soil in 10-m x 10-m plot |
| NadirCover_EquisetumLive | percent | * Nadir percent cover of live equisetum in 10-m x 10-m plot |
| Tree_Height1 | m | Height (m) of tree 1 |
| Tree_Condition1 | Condition of tree 1: live or dead | |
| Tree_Species1 | Scientific name of of tree 1 species | |
| Tree_Height2 | m | Height (m) of tree 2 |
| Tree_Condition2 | Condition of tree 2: live or dead | |
| Tree_Species2 | Scientific name of of tree 2 species | |
| Tree_Height3 | m | Height (m) of tree 3 |
| Tree_Condition3 | Condition of tree 3: live or dead | |
| Tree_Species3 | Scientific name of of tree 3 species | |
| Thaw_Depth_1 | cm | Depth to ice measured with a bully tool, sample 1 |
| Thaw_Depth_2 | cm | Depth to ice measured with a bully tool, sample 2 |
| Thaw_Depth_3 | cm | Depth to ice measured with a bully tool, sample 3 |
| Thaw_Depth_4 | cm | Depth to ice measured with a bully tool, sample 4 |
| Thaw_Depth_5 | cm | Depth to ice measured with a bully tool, sample 5 |
| Thaw_Depth_6 | cm | Depth to ice measured with a bully tool, sample 6 |
| depth_to_rock (cm) | cm | Depth to rock measure with a bully tool |
| Peat_Depth | cm | Total peat depth |
| Peat_Depth_notes | year | Notes on peat depth measurement. ">50" indicates that depth was greater than length of probe |
| Soil_pH | pH units | pH of soil |
| Soil_pH_notes | Notes on soil pH measurement | |
| Camera_ID | ID number of MTRI camera used for photos | |
| North_Photo | File name(s) for north-facing photo(s) from plot center | |
| East_Photo | File name(s) for east-facing photo(s) from plot center | |
| South_Photo | File name(s) for south-facing photo(s) from plot center | |
| West_Photo | File name(s) for west-facing photo(s) from plot center | |
| Nadir_Photo | File name(s) for nadir facing photo(s) from plot center | |
| Nadir_Seedling_photo | File names(s) for nadir photo(s) of 1 m x 1 m seedling plot | |
| Notes_1 | text | Whether the site was previously sampled for burn severity. If previously sampled, columns 15 through 40 will have missing data (NA or -9999). |
| Notes_2 | text | Additional comments |
* Nadir cover is from a bird's-eye view of the plot. Multiple layers are not considered; therefore, all nadir cover values must add to no more than 100 percent.
Table 5. Variables names and descriptions in the file NWT_Wildfires_Biophysical_2017.csv.
| Variable | Units | Description |
|---|---|---|
| Site | Unique name given to a field point | |
| Plot | Plot number (1-6 typically) | |
| Date | YYYY-MM-DD | Date of field data collection |
| Observer | Initials of person(s) who collected data | |
| Latitude | decimal degrees | GPS measured field location |
| Longitude | decimal degrees | GPS measured field location |
| Time | HH:MM | Time at the start of the sampling in the plot reported in local time (MDT) |
| Live_Canopy_Cover | percent | *Percent of canopy (tree) cover classified as live |
| Medium_shrub_cover | percent | *Percent of shrub cover classified as live |
| Dominant_Cover | Description of the dominant cover type. Choices included: forested; shrub; herbaceous or some combination of these cover types | |
| Ecosystem_Type | Ecosystem type(s) represented in the plot: bog; fen; lowland; upland see table for defining characteristics | |
| Wetness | Description of the soil moisture status: dry; moist; soggy; standing water or some combination of these conditions | |
| Plot_Size | m | Size of sampling plot reported in meters by meters |
| OS_top_condition | Notes on the condition of the top layer of organic soil with respect to type (thatch, live moss, dead moss, etc.) and to burning: ash; burned; singed or charred or unburned | |
| OS_top_thickness | cm | Thickness of the top component of the organic soil layer reported in centimeters |
| OS_Dead_moss_layer_thickness | cm | Thickness of the dead moss component of the organic soil layer reported in centimeters |
| OS_Upper_duff_layer_thickness | cm | Thickness of the upper duff component of the organic soil layer reported in centimeters |
| OS_Lower_duff_layer_thickness | cm | Thickness of the lower duff component of the organic soil layer reported in centimeters |
| Total_Peat_depth | cm | Depth of peat |
| GC_Sphag_coverage | percent | * Percent of ground covered in Sphagnum moss reported as percent of total plot area |
| GC_Sphag_distribution | Pattern of distribution of sphagnum: reported as "Even" or "Patchy" | |
| GC_Feather_Moss_coverage | percent | * Percent of ground covered in Feather moss reported as percent of total plot area |
| GC_Feather_Moss_distribution | Pattern of distribution of feather moss: reported as "Even" or "Patchy" | |
| GC_Reindeer_lichen_coverage | percent | * Percent of ground covered in reindeer lichen reported as percent of total plot area |
| GC_Reindeer_lichen_distribution | Pattern of distribution of reindeer lichen: reported as "Even" or "Patchy" | |
| GC_Other_lichen_coverage | percent | * Percent of ground covered in other lichen reported as percent of total plot area |
| GC_Other_lichen_distribution | Pattern of distribution of other lichen: reported as "Even" or "Patchy" | |
| GC_Grasses_coverage | percent | * Percent of ground covered in grasses reported as percent of total plot area |
| GC_Grasses_distribution | Pattern of distribution of low shrubs: reported as "Even" or "Patchy" | |
| GC_Low_Shrubs_coverage | percent | * Percent of ground covered in low shrubs reported as percent of total plot area |
| GC_Low_Shrubs_distribution | Pattern of distribution of low shrubs: reported as "Even" or "Patchy" Yes it should be peripheral | |
| GC_Woody_debris_coverage | percent | * Percent of ground covered in woody debris reported as percent of total plot area |
| GC_Woody_debris_distribution | Pattern of distribution of woody debris: reported as "Even" or "Patchy" | |
| GC_Herbaceous_coverage | percent | * Percent of ground covered in herbaceous plants reported as percent of total plot area |
| GC_Herbaceous_distribution | Pattern of distribution of herbaceous plants: reported as "Even" or "Patchy" | |
| GC_other_type | Description of other ground cover type | |
| GC_other_coverage | percent | * Percent of ground covered in other ground cover reported as percent of total plot area |
| GC_other_distribution | Pattern of distribution of other ground cover type: reported as "Even" or "Patchy" | |
| GC_other_type | Description of other ground cover type | |
| GC_other_coverage | percent | * Percent of ground covered in other ground cover reported as percent of total plot area |
| GC_other_distribution | Pattern of distribution of other ground cover type: reported as "Even" or "Patchy" | |
| GC_other_type | Description of other ground cover type | |
| GC_other_coverage | percent | * Percent of ground covered in other ground cover reported as percent of total plot area |
| GC_other_distribution | Pattern of distribution of other ground cover type: reported as "Even" or "Patchy" | |
| GC_other_type | Description of other ground cover type | |
| GC_other_coverage | percent | * Percent of ground covered in other ground cover reported as percent of total plot area |
| GC_other_distribution | Pattern of distribution of other ground cover type: reported as "Even" or "Patchy" |
* These percent cover values may sum to over 100% because multiple layers of vegetation were measured.
Table 6. Variables names and descriptions in the file NWT_Wildfires_Biophysical_Inventory_2017.csv.
| Variable | Unit | Description |
|---|---|---|
| Site | Unique name given to a field site, typically representing 100 m x 100 m area | |
| Plot | Plot number (1 to 6), with each plot typically 10 m x 10 m | |
| Date | YYYY-MM-DD | Date of data collection |
| Observers | Initials of person(s) who collected data | |
| Plot size | m | Plot dimensions: typically 10 m x 10 m or 5 m x 5 m |
| Life_form | Description of life form: "Shrub" or "Tree" | |
| Condition | Condition of vegetation: "Standing" or "Fallen" | |
| Species | Scientific name of vegetation species measured. "Snag" if dead tree of unknown species. | |
| Diameter_type | Whether the tree or shrub was measured at the base (basal) or diameter at breast height (dbh) | |
| Diameter | cm | Measured diameter |
| Height | m | Tree or shrub height in meters |
| Status | Whether the tree or shrub was "Live" or "Dead" at time of sampling, or "None" if no tree or shrub present in plot. Most are dead from wildfire. | |
| Notes | Comments on the data collected or site notes |
Table 7. Variables names and descriptions in the file NWT_Wildfires_Seedling_Sprouting_2017.csv.
| Variable | Unit | Description |
|---|---|---|
| Site | Unique name given to a field location | |
| Plot | Plot number (1 to 6) | |
| Site_Plot | Site name followed by plot number | |
| Date | YYYY-MM-DD | Date of sampling |
| Observers | Initials of person(s) who collected data | |
| Plot_size | m | Plot size typically 1 m x 1 m but may be smaller or larger depending on site conditions |
| Species | Scientific name of vegetation species measured | |
| Condition | Condition of vegetation: seedling or sprouting | |
| Count | 1 | Number the of seedling or sproutings |
| Seedbed | Seedbed type: sphagnum, unburned organic material (duff and litter), thick burned organic material, thin burned organic material, or exposed mineral soil | |
| Percent | Percent cover of species that were not able to be counted due to high density or structure. | |
| comment | Comments on site conditions |
Table 8. Variables names and descriptions in the file NWT_Wildfires_SoilMoisture_HydrosenseI_2017_BurnedSites.csv.
| Variable | Unit | Description |
|---|---|---|
| Site | Unique name given to a field location, each site was nominally 100 m x 100 m in size, and six 10 m x 10 m plots were sampled within that area | |
| Observers | Initials of person(s) who collected data | |
| Date | YYYY-MM-DD | Date of sampling |
| Start_Time | HH:MM | Time that data collection at that location began |
| Weather | Weather at time of collection. It was important to note if raining or recently rained. | |
| Plot1_Probe_depth_1 | cm | The depth to which the tip of the data probe was inserted, from surface down for 6, 12, and 20 cm. A soil pit was dug and probe inserted horizontally for depths greater than 20 cm using the 12 cm probe tine length unless otherwise noted |
| Soil_Temp_Plot1 | degrees Celsius | Soil temperature at plot 1, sampled from surface and also at 50 cm depth or maximum depth sampled |
| Plot_1_Period1 | ms | Hydrosense-1 probe period at plot 1 in milliseconds |
| VWC_plot1 | 1 | Volumetric Water Content (cm3 cm-3) of the soil at plot 1 based on Hydrosense-1 default algorithm for loam soil |
| Plot_1_notes | Notes for probe depth, soil temperature, VWC measurements | |
| Plot2_Probe_Depth | cm | The depth to which the tip of the data probe was inserted, from surface down for 6, 12, and 20 cm. A soil pit was dug and probe inserted horizontally for depths greater than 20 cm using the 12 cm probe tine length unless otherwise noted |
| Soil_Temp_plot2 | degrees Celsius | Soil temperature at plot 1, sampled from surface and also at 50 cm depth or maximum depth sampled |
| Plot_2_Period2 | ms | Hydrosense-1 probe period at plot 2 in milliseconds |
| VMC_plot2 | 1 | Volumetric Water Content (cm3 cm-3) of the soil at plot 2 based on Hydrosense-1 default algorithm for loam soil |
| Plot_2_notes | Notes for probe depth, soil temperature, VWC measurements. | |
| Plot3_ProbeDepth_3 | cm | The depth to which the tip of the data probe was inserted, from surface down for 6, 12, and 20 cm. A soil pit was dug and probe inserted horizontally for depths greater than 20 cm using the 12 cm probe tine length unless otherwise noted |
| Soil_Temp_3 | degrees Celsius | Soil temperature at plot 3, sampled from surface and also at 50 cm depth or maximum depth sampled |
| Plot_3_Period | ms | Hydrosense-1 probe period at plot 3 in milliseconds |
| VMC_Plot3 | 1 | Volumetric Water Content (cm3 cm-3) of the soil at plot 3 based on Hydrosense-1 default algorithm for loam soil |
| Plot_3_notes | Notes for probe depth, soil temperature, VWC measurements. | |
| Plot4_ProbeDepth_4 | cm | The depth to which the tip of the data probe was inserted, from surface down for 6, 12, and 20 cm. A soil pit was dug and probe inserted horizontally for depths greater than 20 cm using the 12 cm probe tine length unless otherwise noted |
| Soil_Temp_4 | degrees Celsius | Soil temperature at plot 4, sampled from surface and also at 50 cm depth or maximum depth sampled |
| Plot_4_Period | ms | Hydrosense-1 probe period at plot 4 in milliseconds |
| VMC_plot4 | 1 | Volumetric Water Content (cm3 cm-3) of the soil at plot 1 based on Hydrosense-1 default algorithm for loam soil |
| Plot_4_notes | Notes for probe depth, soil temperature, VWC measurements. | |
| Plot5_ProbeDepth_5 | cm | The depth to which the tip of the data probe was inserted, from surface down for 6, 12, and 20 cm. A soil pit was dug and probe inserted horizontally for depths greater than 20 cm using the 12 cm probe tine length unless otherwise noted |
| Soil_Temp_5 | degrees Celsius | Soil temperature at plot 5, sampled from surface and also at 50 cm depth or maximum depth sampled |
| Plot_5_Period | ms | Hydrosense-1 probe period at plot 5 in milliseconds |
| VMC_Plot5 | 1 | Volumetric Water Content (cm3 cm-3) of the soil at plot 5 based on Hydrosense-1 default algorithm for loam soil |
| Plot_5_notes | Notes for probe depth, soil temperature, VWC measurements. | |
| Plot6_ProbeDepth_6 | cm | The depth to which the tip of the data probe was inserted, from surface down for 6, 12, and 20 cm. A soil pit was dug and probe inserted horizontally for depths greater than 20 cm using the 12 cm probe tine length unless otherwise noted |
| Soil_Temp_6 | degrees Celsius | Soil temperature at plot 6, sampled from surface and also at 50 cm depth or maximum depth sampled |
| Plot_6_Period | ms | Hydrosense-1 probe period at plot 6 in milliseconds |
| VMC_Plot6 | 1 | Volumetric Water Content (cm3 cm-3) of the soil at plot 1 based on Hydrosense-1 default algorithm for loam soil |
| Site_Notes | Notes on rockiness, soils, ice, or deviations in the sampling |
Table 9. Variables names and descriptions in the file NWT_Wildfires_SoilMoisture_HydrosenseI_2017_UnburnedSites.csv.
| Variable | Unit | Description |
|---|---|---|
| Site | Unique name given to a field location. Each site was representative of a given ecotype covering a minimum size of 40 m x 50 m (.2 ha). Site consists of five sampling plots within a 30 m x 30 m square: center of square and four corners. | |
| Observers | Initials of person(s) who collected data | |
| Date | YYYY-MM-DD | Date of field data collection |
| Start_Time | HH:MM | Time that data collection at that location began |
| Weather | weather at time of collection - important to note if raining or recently rained | |
| CenterPlot_Probe_depth1 | cm | The depth to which the tip of the data probe was inserted, from surface down for 6, 12, and 20 cm, and a soil pit was dug and probe inserted horizontally for depths greater than 20 cm using the 12 cm probe tine length unless otherwise noted |
| Soil_Temp_Plot1 | degrees Celsius | Soil temperature at plot 1, sampled from surface and also at 50 cm depth or maximum depth sampled |
| Plot_1_Period1 | ms | The Hydrosense-1 probe period at plot 1 in milliseconds |
| VWC_plot1 | 1 | Volumetric Water Content (cm3 cm-3) of the soil at plot 1 based on Hydrosense-1 default algorithm for loam soil |
| Plot2_Probe_Depth_NorthofCenter2 | cm | The depth to which the tip of the data probe was inserted, from surface down for 6, 12, and 20 cm, and a soil pit was dug and probe inserted horizontally for depths greater than 20 cm using the 12 cm probe tine length unless otherwise noted |
| Soil_Temp_plot2 | degrees Celsius | Soil temperature at plot 2, sampled at the surface and at 50 cm depth or maximum depth sampled |
| Plot_2_Period2 | ms | The Hydrosense-1 probe period at plot 2 in milliseconds |
| VMC_plot2 | 1 | Volumetric Water Content (cm3 cm-3) of the soil at plot 2 based on Hydrosense-1 default algorithm for loam soil |
| Plot3_ProbeDepth_EastofCenter3 | cm | The depth to which the tip of the data probe was inserted, from surface down for 6, 12, and 20 cm, and a soil pit was dug and probe inserted horizontally for depths greater than 20 cm using the 12 cm probe tine length unless otherwise noted |
| Soil_Temp_3 | degrees Celsius | Soil temperature at plot 3, sampled at the surface and at 50 cm depth or maximum depth sampled |
| Plot_3_Period | ms | The Hydrosense-1 probe period at plot 3 in milliseconds |
| VMC_Plot3 | 1 | Volumetric Water Content (cm3 cm-3) of the soil at plot 3 based on Hydrosense-1 default algorithm for loam soil |
| Plot4_ProbeDepth_SouthofCenter4 | cm | The depth to which the tip of the data probe was inserted, from surface down for 6, 12, and 20 cm, and a soil pit was dug and probe inserted horizontally for depths greater than 20 cm using the 12 cm probe tine length unless otherwise noted |
| Soil_Temp_4 | degrees Celsius | Soil temperature at plot 4, sampled at the surface and at 50 cm depth or maximum depth sampled |
| Plot_4_Period | ms | The Hydrosense-1 probe period at plot 4 in milliseconds |
| VMC_plot4 | 1 | Volumetric Water Content (cm3 cm-3) of the soil at plot 4 based on Hydrosense-1 default algorithm for loam soil |
| Plot5_ProbeDepth_WestofCenter5 | cm | The depth to which the tip of the data probe was inserted, from surface down for 6, 12, and 20 cm, and a soil pit was dug and probe inserted horizontally for depths greater than 20 cm using the 12 cm probe tine length unless otherwise noted |
| Soil_Temp_5 | degrees Celsius | Soil temperature at plot 5, sampled at the surface and at 50 cm depth or maximum depth sampled |
| Plot_5_Period | ms | The Hydrosense-1 probe period at plot 5 in milliseconds |
| VMC_Plot5 | 1 | Volumetric Water Content (cm3 cm-3) of the soil at plot 5 based on Hydrosense-1 default algorithm for loam soil |
| Notes | Notes on rockiness, ice, or deviations in the sampling |
Table 10. Variables names and descriptions in the file NWT_Wildfires_Unburned_validation_2017.csv.
| Variable | Unit | Description |
|---|---|---|
| Site | Unique name given to a field site | |
| Date | YYYY-MM-DD | |
| Time | HH:MM | Time at which fieldwork began in local time (MDT) |
| Latitude | decimal degrees | Latitude of sampling site |
| Longitude | decimal degrees | Latitude of sampling site |
| Elevation | m | Elevation above mean sea level of site |
| Aspect | Description of topographic aspect | |
| Slope | Description of topographic slope | |
| Observers | Initials of person(s) who collected data | |
| Depth_to_Frozen_ground_sam1 | cm | Depth of soil to Frozen Ground Layer at location 1 within plot |
| Depth_to_Frozen_ground_sam2 | cm | Depth of soil to Frozen Ground Layer at location 2 within plot |
| Depth_to_Frozen_ground_sam3 | cm | Depth of 3soil to Frozen Ground Layer at location 3 within plot |
| Depth_to_Frozen_ground_sam4 | cm | Depth of soil to Frozen Ground Layer at location 4 within plot |
| Depth_to_Frozen_ground_sam5 | cm | Depth of soil to Frozen Ground Layer at location 5 within plot |
| Depth_to_Frozen_ground_sam6 | cm | Depth of soil to Frozen Ground Layer at location 6 within plot |
| Depth_to_Frozen_ground_notes | Notes regarding depth to frozen ground measurements. | |
| Soil_pH | pH units | Soil pH measurement |
| Ecosystem_type | Type of ecosystem, individually or in combination: Bog/Bog Like, Fen/Fen Like, Treed Bog, Shrub Fen, Treed Fen, Open Fen, Upland, Marsh, Shrubby, Sparse Trees, Lowland White Pine | |
| Wetness | Wetness of ground: Dry (no moisture present); Moist( moisture present but not saturated); Soggy (saturated with water but no areas of standing water); Standing Water (visible standing water present in plot) | |
| Vegetation_present | List of vegetation species present | |
| Dense_trees | percent | Percent of plot (1/2 acre area) covered in dense trees. |
| Dense_trees_dist | Description of dense tree distribution: E (evenly distributed), C (center only), P (peripheral) , EP (evenly distributed but patchy), EC (evenly distributed clumps). | |
| Moderate_trees | percent | Percent of plot (1/2 acre area) covered in moderate trees. |
| Moderate_trees_dist | Description of moderate tree distribution: E (evenly distributed), C (center only), P (peripheral), EP (evenly distributed but patchy), EC (evenly distributed clumps). | |
| Sparse_trees | percent | Percent of plot (1/2 acre area) covered in sparse trees. |
| Sparse_trees_dist | Description of sparse tree distribution: E (evenly distributed), C (center only), P (peripheral) , EP (evenly distributed but patchy), EC (evenly distributed clumps). | |
| Open_water | percent | Percent of plot (1/2 acre area) covered in open water. |
| Open_water_dist | Description of open water distribution:: E (evenly distributed), C (center only), and P (peripheral) | |
| Shrubby | percent | Percent of plot (1/2 acre area) covered in shrubs. |
| Shrubby_dist | Description of shrub distribution: E (evenly distributed), C (center only), and P (peripheral) | |
| Moss | percent | Percent of plot (1/2 acre area) covered in moss. |
| Moss_dist | Description of moss distribution: E (evenly distributed), C (center only), and P (peripheral) | |
| Grass_sedge | percent | Percent of plot (1/2 acre area) covered in grass/sedge. |
| Grass_sedge_dist | Description of grass/sedge distribution:: E (evenly distributed), C (center only), and P (peripheral) | |
| Herbeceous_cover | percent | Percent of plot (1/2 acre area) covered in non-grass/sedge, herbaceous vegetation. |
| Herbeceous_dist | Description of herbaceous cover (not grass/sedge) distribution:: E (evenly distributed), C (center only), and P (peripheral) | |
| Other_1_descript | Description of other vegetation cover | |
| Other_1 | percent | Percent of plot (1/2 acre area) covered in other vegetation. |
| Other_1_dist | Description of distribution of other vegetation: E (evenly distributed), C (center only), P (peripheral), EP (evenly distributed but patchy), EC (evenly distributed clumps). | |
| Other_2_descript | Description of other vegetation cover | |
| Other_2 | percent | Percent of plot (1/2 acre area) covered in other vegetation. |
| Other_2_dist | Description of distribution of other vegetation: E (evenly distributed), C (center only), P (peripheral), EP (evenly distributed but patchy), EC (evenly distributed clumps). | |
| Dom_spp | Scientific name of dominant species (grasses and sedges not identified to species) | |
| Dom_Live_ht | m | Average height of live dominant species 1 |
| Dom_Dead_ht | m | Average height of dead dominant species 1 |
| Dom_density | percent | Percent of area covered by dominant species 1 |
| Dom_pct_live | percent | Percent of dominant species 1 live (by area) |
| Dom_pct_dead | percent | Percent of dominant species 1 dead (by area) |
| Dom_stage | Growth Stage for dominant species: dormant, emerging, seedling, immature, mature, flowering | |
| Sec_spp | Scientific name of secondary species ( grasses and sedges not identified to species) | |
| Sec_live_ht | m | Average height of live secondary species |
| Sec_dead_ht | m | Average height of dead secondary species |
| Sec_density | percent | Percent of area covered by secondary species |
| Sec_pct_live | percent | Percent of secondary species live (by area) |
| Sec_pct_dead | percent | Percent of secondary species dead (by area) |
| Sec_stage | Growth Stage for secondary species: dormant, emerging, seedling, immature, mature, flowering | |
| Height_to_lowest_living_branch | m | Height of average lowest living branch |
| Average_Tree_Ht_m | m | Height of average living tree matched to tree of lowest living branch |
| Average_Shrub_Ht_m | m | Height of average shrub |
| Camera_ID | ID number of MTRI camera used for photos | |
| North_Photo | File name(s) for north-facing photo(s) from plot center | |
| East_Photo | File name(s) for east-facing photo(s) from plot center | |
| South_Photo | File name(s) for west-facing photo(s) from plot center | |
| West_Photo | File name(s) for south-facing photo(s) from plot center | |
| Nadir_Photo | File name(s) for nadir facing photo(s) from plot center | |
| Other_photo | File name(s) for miscellaneous photo(s) of plot | |
| Photo_notes | Notes regarding field photographs | |
| Soil_live_moss | cm | Depth of live moss layer present in 40 cm soil profile |
| Soil_dead_moss | cm | Depth of dead moss layer present in 40 cm soil profile |
| Soil_upper_duff | cm | Depth of upper duff layer present in 40 cm soil profile |
| Soil_ lower_duff | cm | Depth of lower duff layer present in 40 cm soil profile |
| Peat_Depth | cm | Depth of organic peat soil |
| Site_notes | Additional notes/comments |
Application and Derivation
The goal of this project was to collect remote sensing and field data to support scientific research on the impacts of the 2014-2015 fires in Northwest Territories of Canada.
Quality Assessment
Quality control checks were performed on the field data. Data were recorded in the field on field sheets, then entered into a Microsoft Excel spreadsheet. A second person checked the entered data against the original field sheets. A third person cross-referenced field data with information available from additional field sheets, GPS, or cameras, and checked for missing values and anomalies (out-of-range values); corrections were made as needed.
Soil moisture is sampled at each plot with five repeated samples within an arm's length at each depth with the Hydrosense instrument. This replication allows for spatial averaging across the site (6 plots x 5 samples per plot = 30 samples per site).
Data Acquisition, Materials, and Methods
This project used remote sensing and field data to characterize the impacts of wildfires that occurred in 2014 and 2015 in the North Slave, South Slave, and Dehcho Regions of Northwest Territories (NWT), Canada (Fig. 2). This five-year study focused on four 2014 NWT fires (ZF17, ZF20, SS3, SS15) and five 2015 NWT Fires (ZF14, ZF2, SS50, SS81, SS28). Field data collection occurred annually from 2015 to 2019. This dataset provides data collected in 2017 from study sites listed in Table 2.
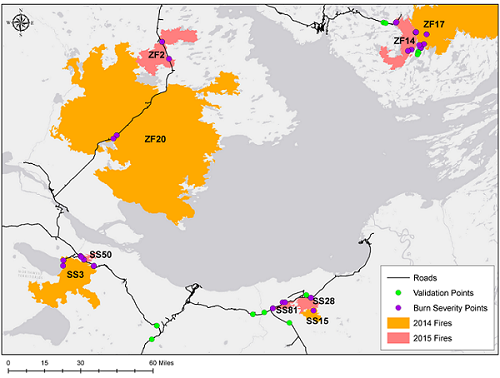
Figure 2. Wildfire areas with burned and validation field site locations around Great Slave Lake in the Northwest Territories, Canada.
In 2017, seven study areas that had experienced wildfire in 2014-2015 were sampled (Table 2). In addition, four unburned areas, termed validation sites, were sampled. Field crews used a handheld GPS, a GPS camera, maps of aerial photographs, and tape measures. At each site, a vegetative index was constructed, ecosystem type was assigned, species diversity was noted, dominant species composition was assigned, the water level was measured, vegetation life stage recorded, and height and density measured for the overstory. Thaw depth was measured with a peat rod from the top of the moss to the frozen layer. Geolocated photographs were taken in the four cardinal directions at study plots providing an additional layer of validation and ground truth for each location.
At each site, biophysical site characteristics, burn severity, soil moisture, thaw depth, and seedling/sprouting data were collected in up to six plots along two transects to characterize a homogenous area of 100 m x 100 m. The typical plot size was 10 m x 10 m. Burn damage severity class was recorded for moss, litter, shrub, and tree canopy. Nadir percent cover by vegetation class was recorded for live/dead shrubs, woody debris, herbaceous, and moss. Three representative tree heights were recorded and up to five adventitious root heights were recorded. Peatland type, thaw depth, and peat thickness as well as ash presence are also reported for all plots.
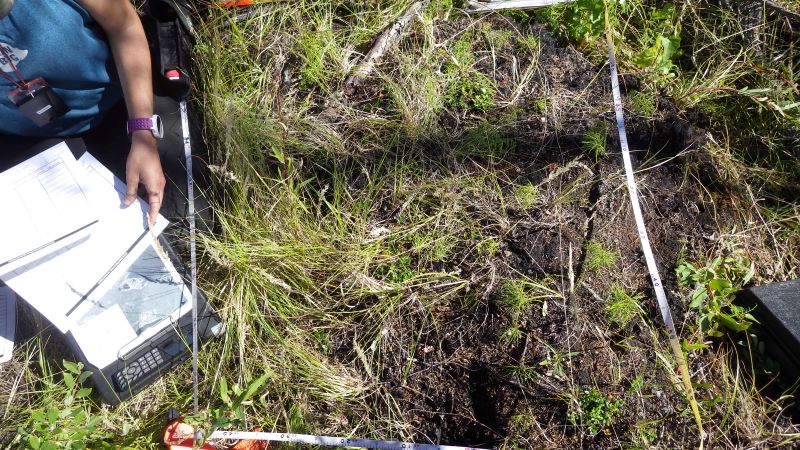
Figure 3. Photograph of seedling quadrat at site ZF17-40. Source: ZF17-40_1_seedling.jpg
At sites in the burned areas, detailed measurements of soil moisture & temperature, seedling/sprouting, and aboveground biomass were sampled in 10 m x 10 m plots and smaller quadrats. Soil moisture was measured with a Hydrosense 1 instrument. Five measurements were made at each of four soil depths: 6, 12, 20, and 50 cm. The probe period and volumetric water content were collected at six points within each plot. Soil temperature was measured using a Hannah Instruments HI 145 probe. Two different lengths of probes were used: 20 and 12 cm. Both probes were placed straight down into the soil. In addition, at 6 cm depth, the 12 cm probe was placed at a 30-degree angle. Seedlings/sproutings, along with groundcover, were sampled in 0.5 m2 or 1.0 m2 quadrats at the corner of each site. For aboveground biomass, the coverage, heights, and diameters of trees and shrubs were measured. The tree/shrub species and DBH or basal diameter were recorded along with the height of representative trees.
Data Access
These data are available through the Oak Ridge National Laboratory (ORNL) Distributed Active Archive Center (DAAC).
ABoVE: Post-Fire and Unburned Vegetation Community and Field Data, NWT, Canada, 2017
Contact for Data Center Access Information:
- E-mail: uso@daac.ornl.gov
- Telephone: +1 (865) 241-3952
References
Bourgeau-Chavez, L.L., M.J. Battaglia, P. Siqueira, C. Weinstein, S. Rose, H. Smith, D. Uhelski, and D.J.L. Vander Bilt. 2021. ABoVE: Post-Fire and Unburned Vegetation Community and Field Data, NWT, Canada, 2019. ORNL DAAC, Oak Ridge, Tennessee, USA. https://doi.org/10.3334/ORNLDAAC/1900
Bourgeau-Chavez, L.L., J.A. Graham, S. Endres, N.H.F. French, M. Battaglia, D. Hansen, and D. Tanzer. 2019. ABoVE: Ecosystem Map, Great Slave Lake Area, Northwest Territories, Canada, 1997-2011. ORNL DAAC, Oak Ridge, Tennessee, USA. https://doi.org/10.3334/ORNLDAAC/1695
Bourgeau-Chavez, L.L., M. Battaglia, E.S. Kane, L.M. Cohen, and D. Tanzer. 2019. ABoVE: Post-Fire and Unburned Vegetation Community and Field Data, NWT, Canada, 2018. ORNL DAAC, Oak Ridge, Tennessee, USA. https://doi.org/10.3334/ORNLDAAC/1703
Bourgeau-Chavez, L.L., S. Endres, L. Jenkins, M. Battaglia, E. Serocki, and M. Billmire. 2017. ABoVE: Burn Severity, Fire Progression, and Field Data, NWT, Canada, 2015-2016. ORNL DAAC, Oak Ridge, Tennessee, USA. https://doi.org/10.3334/ORNLDAAC/1548
Bourgeau-Chavez, L.L., N.H.F. French, S. Endres, L. Jenkins, M. Battaglia, E. Serocki, and M. Billmire. 2016. ABoVE: Burn Severity, Fire Progression, Landcover and Field Data, NWT, Canada, 2014. ORNL DAAC, Oak Ridge, Tennessee, USA. https://doi.org/10.3334/ORNLDAAC/1307