Documentation Revision Date: 2021-04-03
Dataset Version: 1
Summary
The UAVSAR P-band radar instrument was originally developed for the Airborne Microwave Observatory of Subcanopy and Subsurface (AirMOSS) campaign to measure root-zone soil moisture. The data can be used for subsurface and sub-canopy imaging applications such as monitoring soils, forest, and permafrost changes, and detecting underground structures and subsurface changes
Products for each of the 139 data takes are provided in a separate directory. Each directory contains 38 data products of several types, for a total of 5,282 data files. The data products are provided at two resolutions, 0.5 arcseconds (about 15 meters) and 3.0 arcseconds (about 90 meters), which are denoted in each file name.
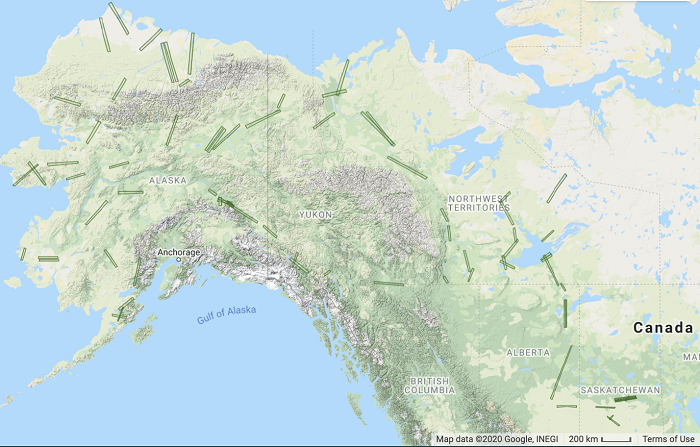
Figure 1. UAVSAR P-band SAR radar swaths over study sites across Alaska, USA, and western Canada for the 2017 ABoVE campaign.
Citation
Shimada, J.G., Y. Lou, S. Hensley, B.P. Hawkins, L. Harcke, D.M. Lagoy, T.R. Michel, R.J. Muellerschoen, S. Flores, N. Pinto, C. Rains, W.W. Tung, and Y. Zheng. 2021. ABoVE: L1 S-0 Polarimetric Data from UAVSAR P-band SAR, Alaska and Canada, 2017. ORNL DAAC, Oak Ridge, Tennessee, USA. https://doi.org/10.3334/ORNLDAAC/1800
Table of Contents
- Dataset Overview
- Data Characteristics
- Application and Derivation
- Quality Assessment
- Data Acquisition, Materials, and Methods
- Data Access
- References
Dataset Overview
This dataset provides Level 1 (L1) polarimetric radar backscattering coefficient (Sigma-0 or S-0), multi-look complex, polarimetrically calibrated, and georeferenced data products from the UAVSAR P-band SAR radar instrument collected over 74 study sites across Alaska, USA, and western Canada. The radar instrument is a fully polarimetric P-band (ultra-high frequency) SAR operating in the 420–440 MHz band. The flight campaigns took place periodically in May-August 2017 onboard a NASA Gulfstream-III aircraft. Each set of products was produced from a data take (i.e., acquisition) of the UAVSAR P-band SAR radar instrument, where one data take is equivalent to one flight line over a site. Two to four data takes were sought for each site, although for some sites as few as one or as many as six are provided. There were a total of 139 data takes over the 74 sites.
The UAVSAR P-band radar instrument was originally developed for the Airborne Microwave Observatory of Subcanopy and Subsurface (AirMOSS) campaign to measure root-zone soil moisture. The data can be used for subsurface and sub-canopy imaging applications such as monitoring soils, forest, and permafrost changes, and detecting underground structures and subsurface changes.
Project: Arctic-Boreal Vulnerability Experiment
The Arctic-Boreal Vulnerability Experiment (ABoVE) is a NASA Terrestrial Ecology Program field campaign based in Alaska and western Canada between 2016 and 2021. Research for ABoVE links field-based, process-level studies with geospatial data products derived from airborne and satellite sensors, providing a foundation for improving the analysis and modeling capabilities needed to understand and predict ecosystem responses and societal implications.
Related Datasets
Chapin, E., S. Flores, L. Harcke, B. P. Hawkins, S. Hensley, T. R. Michel, R. J. Muellerschoen, J. G. Shimada, W. W. Tung, and C. Veeramachaneni. 2018. AirMOSS: L1 S-0 Polarimetric Data from AirMOSS P-band SAR, BERMS, Canada, 2012-2015. ORNL DAAC, Oak Ridge, Tennessee, USA. https://doi.org/10.3334/ORNLDAAC/1406
Lou, Y., J. G. Shimada, T. R. Michel, R. J. Muellerschoen, Y. Zheng, and M. Moghaddam. 2019. Pre-ABoVE: L1 S-0 Polarimetric Data from AirMOSS P-band SAR, Alaska, 2014-2015. ORNL DAAC, Oak Ridge, Tennessee, USA. https://doi.org/10.3334/ORNLDAAC/1678
Acknowledgments
This work was funded by the NASA Earth Science Division.
Data Characteristics
Spatial Coverage: Alaska, USA, and western Canada
ABoVE Reference Locations
Domain: Core ABoVE
State/Territory: Alaska; Canada
Grid Cells (92): Bh001v002, Bh001v003, Bh001v006, Bh002v002, Bh002v003, Bh002v005, Bh002v006, Bh003v001, Bh003v002, Bh003v003, Bh003v004, Bh003v005, Bh003v006, Bh004v001, Bh004v002, Bh004v003, Bh004v004, Bh004v005, Bh005v001, Bh005v002, Bh005v003, Bh005v004, Bh006v001, Bh006v002, Bh006v003, Bh006v004, Bh006v005, Bh006v006, Bh006v007, Bh006v008, Bh006v009, Bh007v001, Bh007v002, Bh007v003, Bh007v004, Bh007v005, Bh007v006, Bh007v007, Bh007v008, Bh007v009, Bh008v001, Bh008v002, Bh008v003, Bh008v004, Bh008v005, Bh008v009, Bh008v010, Bh009v002, Bh009v005, Bh009v006, Bh009v010, Bh009v011, Bh010v005, Bh010v006, Bh010v007, Bh010v008, Bh010v011, Bh011v005, Bh011v006, Bh011v007, Bh011v008, Bh011v009, Bh011v010, Bh011v011, Bh011v012, Bh012v010, Bh012v011, Bh012v012, Bh012v015, Bh012v016, Bh013v009, Bh013v010, Bh013v011, Bh013v012, Bh013v013, Bh013v014, Bh013v015, Bh013v016, Bh013v017, Bh014v009, Bh014v010, Bh014v011, Bh014v012, Bh014v013, Bh014v014, Bh014v015, Bh014v017, Bh014v018, Bh015v009, Bh015v016, Bh015v017, Bh015v018
Spatial Resolution: 0.5 arcseconds and 3.0 arcseconds
Temporal Coverage: Periodic flights from May 2017–August 2017.
Temporal Resolution: Daily
Study Area: Latitudes and longitudes are provided in decimal degrees.
| Sites | Westernmost Longitude | Easternmost Longitude | Northernmost Latitude | Southernmost Latitude |
|---|---|---|---|---|
| Alaska and western Canada | -114.052479 | -104.183584 | 71.464621 | 52.077702 |
Data File Information
There are 38 data products (of several formats) for each of 139 data takes, totaling 5,282 data files. The data products are provided at two resolutions, 0.5 arcseconds (about 15 m) and 3.0 arcseconds (about 90 m).
Files with the extensions .ann, .h5, hgt, .inc, .jpg, .kmz, .png, and .slope are named ssssss_LLLLL_FFFFF_CCC_YYMMDD_PL090fffww_gg_CX_vv.ext (e.g., tukhwy_01812_17057_014_170606_PL09043020_05_CX_01.ann).
Files with the extension .grd and .mlc are named ssssss_LLLLL_FFFFF_CCC_YYMMDD_PL090fffww_ggpppp_CX_vv.ext (e.g., tukhwy_01812_17057_014_170606_PL09043020_30HVVV_CX_01.mlc).
Table 1. File name elements and descriptions.
| Element | Short Name | Example Value | Description |
|---|---|---|---|
| ssssss | Site name | padelE | 6-character alphanumeric identifier assigned to each ABoVE flight line For sites with a single flight line, the 6 characters identify the site, whereas sites with multiple flight lines have 5 characters to identify the flight line followed by a letter (N, S, E, W, A, B, C, D) that identifies the flight line within the site |
| LLLLL | Flight line ID | 00026 | 5-character flight line identifier, where the first 3 characters are the aircraft heading in integer degrees (range 000–359) and the last 2 characters are from an alphanumeric counter to ensure uniqueness |
| FFFFF | Flight ID | 17051 | 5-digit flight identifier, where the first 2 digits are the last 2 digits of the flight year and the following 3 digits are from a numeric counter to ensure uniqueness |
| CCC | Data take counter | 009 | 3-digit data take counter for the flight (range 0-9); a first digit of 0 indicates that the data take was collected using automatic mode, while a first digit of 1 indicates that it was collected using manual mode; usually, the data take counter starts at 000 for the first science data take of a flight and is incremented by 1 for each successive science data take; since the radar system may reinitialize the counter if a system reset occurs during flight, the data take counter may not be unique for a flight |
| YYMMDD | Flight date | 170522 | UTC date at the start of the data take, where YY is the last two digits of the flight year, MM is the month of the year, and DD is the day of the month |
| PL09043020 | Radar mode | 10-character alphanumeric identifier; see Table 3 for the naming convention | |
| gg | Spatial resolution | 30 | 2-digit grid spacing in integer units of 0.1 arcseconds, where 05 represents 0.5" and 30 represents 3.0" |
| pppp | Cross product abbreviation | HHHV | Formed from the subscripts of the two factors of the cross products as read from left to right (e.g., the abbreviation for the cross product SHHS'*HV is HHHV), where values are HHHH, HHHV, HHVV, HVHV, HVVV, and VVVV |
| CX | Crosstalk removal status | CX | 2-character crosstalk removal status; the value is CX when crosstalk has been removed and XX when crosstalk has not been removed; ABoVE L1-S-0 data products use the value CX only |
| vv | Version number | 01 | 2-digit product version number starting at 01; the version number is incremented by 1 when a product is redelivered |
| ext | Extension | ann | File format extension |
Table 2. Six-letter abbreviations for study sites. Some sites contain subsites (identified in parentheses) and multiple data takes.
| Site Abbreviation | Site Name |
|---|---|
| aklavi | Aklavik Ice Road, NT, Canada |
| ambler | Ambler permafrost borehole site, AK, USA |
| anakt (E,W) | Anaktuvuk Pass, AK, USA |
| atqasu | Atqasuk permafrost borehole site, AK, USA |
| barrow | Barrow permafrost borehole site, AK, USA |
| behcho | Behchoko, NT, Canada |
| berms (A,B,C,D) | Boreal Ecosystem Research and Monitoring Sites (BERMS), SK, Canada |
| chevak | Chevak, AK, USA |
| coldfo | Coldfoot permafrost borehole site, AK, USA |
| counci | NGEE Arctic site, Council, AK, USA |
| daring | Daring Lake, NT, Canada |
| deltj (A,B,C) | Delta Junction, AK, USA |
| dhorse | Deadhorse permafrost borehole site, AK, USA |
| djNEON | Delta Junction NEON site, AK, USA |
| faberl | Faber Lake, NT, Canada |
| fliard | Fort Liard, NT, Canada |
| fsmit (N,S) | Fort Smith, NT, Canada |
| ftmacm | Fort McMurray, AB, Canada |
| ftres (N,S) | Fort Resolution, NT, Canada |
| ftyuko | Fort Yukon, AK, USA |
| gdhope | Fort Good Hope, NT, Canada |
| huslia | Huslia permafrost borehole site, AK, USA |
| inigok | Circumpolar Active Layer Monitoring (CALM) site, Inigok, AK, USA |
| innoko | Innoko River, AK, USA |
| ivotuk | Ivotuk permafrost borehole site, AK, USA |
| kakis (A,B) | Kakisa Lake, NT, Canada |
| katma (A,B,C) | Katmai National Park and Preserve, AK, USA |
| kluan (A,B) | Kluane National Park and Reserve, YT, Canada |
| kougar | Kougarok permafrost borehole site, AK, USA |
| koyukk | Koyuk permafrost borehole site, AK, USA |
| lclark | Lake Clark National Park and Preserve, AK, USA |
| lloydE | East of Lloydminster, SK, Canada (also AirSWOT study site) |
| lloydW | West of Lloydminster, AB, Canada (also AirSWOT study site) |
| mcpher | Fort McPherson, NT, Canada |
| noatak | Noatak National Preserve, AK, USA |
| nwells | Norman Wells, NT, Canada |
| oldcr (A,B) | Old Crow, YT, Canada |
| padel (E,W) | Peace–Athabasca Delta, AB, Canada |
| poorma | Poorman, AK, USA |
| provid | Fort Providence, NT, Canada |
| redber | Redberry, SK, Canada (also AirSWOT study site) |
| saska (N,S) | Saskatoon, SK, Canada (also AirSWOT study site) |
| scoaoi | Sambaa K’e (formerly Trout Lake), NT, Canada |
| scotty | Scotty Creek, NT, Canada |
| snagyk | Snag, YT, Canada |
| snarer | Snare River, NT, Canada |
| sriver | Stony River, AK, USA |
| teller | Teller NGEE Arctic site, AK, USA |
| toolik | Toolik Lake and Field Station, AK, USA |
| tukhwy | Inuvik–Tuktoyaktuk Highway, NT, Canada |
| watson | Watson Lake, YT, Canada |
| wolfcr | Wolf Creek Trail, YT, Canada |
| wrigl (N,S) | Wrigley, NT, Canada |
| yellow | Yellowknife, NT, Canada |
| yflat (E,W) | Yukon Flats National Wildlife Refuge, AK, USA |
| ykdel (A,B) | Yukon Delta National Wildlife Refuge, AK, USA |
Table 3. Radar mode naming convention elements.
| Element | Short Name | Description |
|---|---|---|
| P | Radar band | Radar band; 1-character fixed value P for these products |
| L | Radar look direction | Left-looking radar relative to the direction of flight; 1-character fixed value L for these products |
| 090 | Squint angle | Squint angle in integer degrees; 3-digit fixed value 090 for these products |
| 430 | Chirp frequency | Chirp center frequency in MHz; 3-digit fixed value 430 for these products |
| 20 | Chirp bandwidth | Chirp bandwidth in MHz; 2-digit fixed value of 20 for these products; the value has been rounded for use in the filenames, while the true value is provided in the Bandwidth field of the associated ANN files |
Table 4. Data product file extensions. See Section 5 for additional information.
| Element | Number of Files per Data Take | Description |
|---|---|---|
| ann | 2 files: 1 for the 0.5 arcsecond grid spacing and 1 for 3.0 arcsecond | Annotation (text) files containing metadata including filenames, file dimensions, grid coordinates, and radar processing parameters |
| grd | 12 files: 6 for the 0.5 arcsecond grid spacing and 6 for 3.0 arcsecond | Georeferenced/gridded data (GRD) generated by projecting (slant-range) single-look complex data to ground range using the backward projection method |
| h5 | 2 files: 1 for the 0.5 arcsecond grid spacing and 1 for 3.0 arcsecond | Hierarchical Data Format Version 5 (HDF5) files containing copies of the DEM, GRD, INC, MLC, and SLOPE |
| hgt | 2 files: 1 for the 0.5 arcsecond grid spacing and 1 for 3.0 arcsecond | Digital elevation map (DEM) used during processing; co-registered to the GRD |
| inc | 2 files: 1 for the 0.5 arcsecond grid spacing and 1 for 3.0 arcsecond | Local incidence angle (INC); co-registered to the GRD |
| jpg | 2 files: 1 for the 0.5 arcsecond grid spacing and 1 for 3.0 arcsecond | Browse thumbnails in JPEG media format produced from the PNG |
| kmz | 2 files: 1 for the 0.5 arcsecond grid spacing and 1 for 3.0 arcsecond | Compressed Keyhole Markup Language (KMZ) files containing the GRD rendered as low-resolution color images for display in Google Earth |
| mlc | 12 files: 6 for the 0.5 arcsecond grid spacing and 6 for 3.0 arcsecond | Multi-looked complex (MLC) cross products |
| png | 2 files: 1 for the 0.5 arcsecond grid spacing and 1 for 3.0 arcsecond | Portable Network Graphics (PNG) images of the KMZ |
| slope | 2 files: 1 for the 0.5 arcsecond grid spacing and 1 for 3.0 arcsecond | Terrain slope (SLOPE) derived from the DEM in the east and north directions |
Application and Derivation
The Level 1 (L1) Sigma-0 (S-0) data generated by the UAVSAR P-Band SAR radar instrument were used to generate other, higher-level, data products.
Quality Assessment
The radar backscatter data has been radiometrically calibrated using 2.4 m and 4.8 m trihedral corner reflectors deployed at the Rosamond Dry Lake in California and receiver data from a noise diode built-in test (BIT) (Chapin et al., 2015). For 2017, the noise diode BIT data were used to improve the antenna pattern. Use of the noise diode BIT data reduced the standard deviations of the 4.8 m corner reflector residuals (observed - predicted radar cross-sections) from 0.867 dB to 0.543 dB for the HH factor of the cross product and from 0.668 dB to 0.521 dB for the VV factor of the cross product. For the 2.4 m corner reflector residuals, the corresponding improvements in the standard deviations were from 0.861 dB to 0.564 dB for HH and from 0.599 dB to 0.436 dB for VV.
For P-band data acquired starting in 2017, noise diode BIT data acquired immediately before and/or after each data take was used to radiometrically correct the data during processing. Crosstalk removal was applied to the data prior to phase calibration (Fore et al., 2015). Adaptive RFI removal has been applied to each data take on an as-needed basis (Harcke and Le, 2014). Its application has been documented in the associated ANN files for each product. RFI that could not be removed by this process has been noted in the Comments field of the associated ANN files.
Data Acquisition, Materials, and Methods
The UAVSAR P-band SAR instrument used for the 2017 ABoVE flights was the same instrument used during the AirMOSS campaign described at https://airmoss.ornl.gov/documentation.html. The radar instrument can penetrate through substantial vegetation canopies and soil to depths of approximately 1.2 m below the surface. All ABoVE data takes that were acquired for standard science data processing were collected using a single chirp waveform having a center frequency of 430 MHz and a 10 dB bandwidth of 20 MHz (Table 3).
The products provided in this dataset have substantial overlap with the UAVSAR standard Polarimetric synthetic aperture (PolSAR) products. Much of the material in this section has been adapted from the online UAVSAR polarimetric product documentation available at http://uavsar.jpl.nasa.gov/science/documents/polsar-format.html.
A L1 S-0 polarimetric product consists of a set of files that are generated from a single data take of the radar instrument. The products are output at grid spacings of 0.5" (arcseconds; about 15 m) and 3.0" (about 90 m).
ANN Files
The annotation files (*.ann) contain the metadata for each data take, including filenames, file dimensions, grid coordinates, and radar processing parameters. The annotation files do not conform to any of the standard metadata file formats but use a simple keyword = value ASCII text file format with a maximum of one keyword per line. Each line is terminated by a carriage return (i.e., newline). Unit specifications, if present, are placed within a single pair of parentheses to the left of the equals sign. At least one space should separate the right parenthesis of the unit specification and the equals sign. Two ANN files are generated, one for the 0.5" grid spacing and one for the 3.0" grid spacing.
DEM Files
The digital elevation map (*.dem) files contain the terrain height values that were used to produce the GRD data in the same geographic coordinates. Each sample is a 4-byte real single-precision floating-point number with little-endian byte ordering and units of meters. Two DEM files are generated for each data take, one for the 0.5" grid spacing and one for the 3.0" grid spacing. Each DEM file is co-registered to the GRD files of the same grid spacing.
The following keywords in the associated ANN files provide information about the source DEM used for processing:
- DEM Used in Ground Projection
- DEM Datum
- DEM Source
- DEM Original Pixel Spacing
GRD Files
The georeferenced/gridded data (*.grd) files are generated by projecting the (slant range) SLC data to ground-range using the backward projection method. An equiangular grid is defined with latitude and longitude boundaries that cover the entire slant range image. For each point on the ground range grid, the corresponding location is calculated within the SLC image. The data value closest to this location is assigned to the point on the ground range grid. One GRD file is produced for each of the six cross products (i.e., cross product abbreviations in Table 2) of the MLC files.
Each GRD file has the same sample data type (complex or real) as that of the corresponding MLC cross product. Each sample has units of linear, not dB, radar power. Samples within a record are ordered by increasing longitude (i.e., west to east), and records within a file are ordered by descending latitude (i.e., north to south).
The following keywords in the associated ANN files can be used to determine the geographic location of the GRD files:
- grd_mag.set_rows = number of records in GRD file
- grd_mag.set_cols = number of samples per record
- grd_mag.row_mult = GRD latitude pixel spacing
- grd_mag.col_mult = GRD longitude pixel spacing
- grd_mag.row_addr = center latitude of the upper-left pixel of the image
- grd_mag.col_addr = center longitude of the upper-left pixel of the image
HDF5 Files
The Hierarchical Data Format Version 5 (*.h5) files contain copies of the ground-range products, specifically the DEM, GRD, INC, MLC, and SLOPE. Two HDF5 files are generated for each data take, one for the 0.5" grid spacing and one for the 3.0" grid spacing.
Incidence Angle
The incidence angle (*.inc) files contain the local incidence angle at each point in the GRD files. Each sample is a 4-byte real single-precision floating-point number with little-endian byte ordering and units of radians. Two incidence angle files are generated for each data take, one for the 0.5" grid spacing and one for the 3.0" grid spacing. Each incidence angle file is co-registered to the GRD files of the same grid spacing.

Figure 2. Geometry and formula for calculation of local incidence angle.
KMZ Files
The compressed Keyhole Markup Language (*.kmz) files contain the GRD data rendered as color images. These files can be displayed in Google Earth. Two KMZ files are generated for each data take, one for the 0.5" grid spacing and one for the 3.0" grid spacing.
The color scaling of an image depends upon the dynamic range of the particular source dataset; no absolute color scale exists for the KMZ imagery. The images use the following color mappings:
- Red = SHHS*HH
- Green = S'HVS'*HV
- Blue = SVVS*VV
MLC and SLC Files
The multi-looked complex (*.mlc) cross products are generated by first calculating six cross products from each set of single-look complex (SLC) files using the following equations:
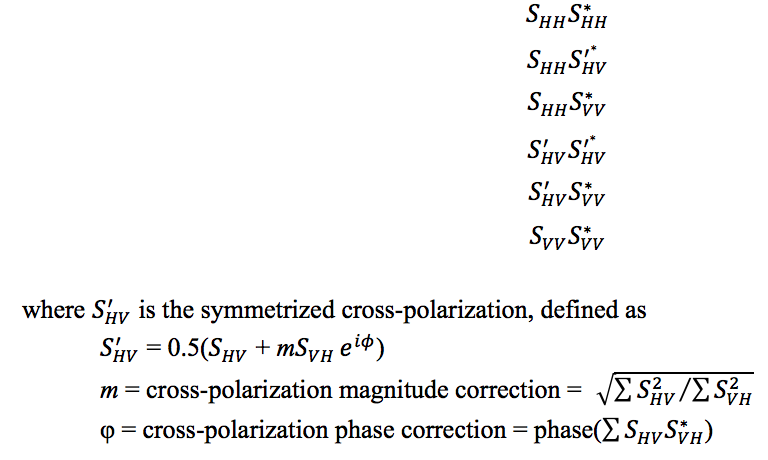
Each cross product is then multi-looked (averaged) in both the range and the azimuth dimensions. The cross products are output at grid spacings of approximately 0.5" and 3.0" with separate files written for each combination of cross product and grid spacing. Thus, 12 MLC files are produced for each chirp waveform used during the data take and each summation has been performed over all samples in the respective SLC file.
Each MLC file is a pure binary file with a fixed record length, no header or trailer records, and no prefix or suffix data within each record. The projection of the data is the natural slant range projection. Samples within a record are ordered by increasing range, and records are ordered by increasing azimuth.
The six files produced for a given chirp waveform and grid spacing have the same record length. For the SHHS*HH, S'HVS'*HV, and SVVS*VV cross products, each sample within a record is a 4-byte real single-precision floating-point number with little-endian byte ordering and units of linear, not dB, radar power. For the SHHS'*HV, SHHS*VV, and S'HVS*VV cross products, each sample within a record is an 8-byte complex single-precision floating-point number with little-endian byte ordering and units of linear, not dB, radar power.
The following keywords in the associated ANN files can be used to determine the geographic location of the MLC files:
- set_plat = peg latitude
- set_plon = peg longitude
- set_phdg = peg heading
- mlc_mag.row_addr = along-track offset to upper left pixel
- mlc_mag.col_addr = cross-track offset to upper left pixel
The following keywords in the associated ANN files provide the number of looks used to generate the MLC files:
- Number of Range Looks in MLC
- Number of Azimuth Looks in MLC
Twelve MLC files are generated for each data take, six for the 0.5" grid spacing and six for the 3.0" grid spacing. Because of the large data volume and low demand, SLC data are not included in this dataset.
PNG and JPG Files
The Portable Network Graphic (*.png) files contain the images from the KMZ files. Two PNG files are generated for each data take, one for the 0.5" grid spacing and one for the 3.0" grid spacing.
JPG files were created from the PNG files to provide thumbnail (i.e., preview) images.
SLOPE Files
The terrain slope (*.slope) files contain the derivatives of the DEM files in the east and north directions. Each slope value is a unitless 4-byte real single-precision floating-point number with little-endian byte ordering. Two terrain slope files are generated for each data take, one for the 0.5" grid spacing and one for the 3.0" grid spacing. Each sample within a file consists of two values; the first is the terrain slope in the east direction and the second is the slope in the north direction. Each terrain slope file is co-registered to the GRD files of the same grid spacing.
Data Access
These data are available through the Oak Ridge National Laboratory (ORNL) Distributed Active Archive Center (DAAC).
ABoVE: L1 S-0 Polarimetric Data from UAVSAR P-band SAR, Alaska and Canada, 2017
Contact for Data Center Access Information:
- E-mail: uso@daac.ornl.gov
- Telephone: +1 (865) 241-3952
References
Chapin, E., B.P. Hawkins, L. Harcke, S. Hensley, Y. Lou, T.R. Michel, L. Moreira, R.J. Muellerschoen, J.G. Shimada, K.W. Tham, and M.C. Tope. 2015. Improved absolute radiometric calibration of a UHF airborne radar. 2015 IEEE Radar Conference (RadarCon), Cincinnati, OH. Pp. 1720-1724. https://doi.org/10.1109/RADAR.2015.7131276
Harcke, L.J., and C.T.-C. Le. 2014. AirMOSS P-band RF interference experience. 2014 IEEE Radar Conference (RadarCon), Cincinnati, OH. Pp. 0761-0764. https://doi.org/10.1109/RADAR.2014.6875691
Fore, A.G., B.D. Chapman, B.P. Hawkins, C.E. Jones, T.R. Michel, and R.J. Muellerschoen. 2015. UAVSAR Polarimetric Calibration. IEEE Transactions on Geoscience and Remote Sensing 53(6):3481–3491. https://doi.org/10.1109/TGRS.2014.2377637
Muellerschoen, R.J. 2017. The Rosamond Corner Reflector Array for SAR calibration; Past, Present, Future. Proceedings of the CEOS SAR Calibration and Validation Workshop, Pasadena, CA.