Documentation Revision Date: 2020-05-15
Dataset Version: 1
Summary
These data characterize multi-decadal succession and landscape change across the Izaviknek and Kingaglia uplands of the Y-K Delta following extensive historical fire events.
There are 10 primary dataset files: 2 files in *.csv format, 4 files in GeoTIFF (*.tif) format, 2 shapefiles (*.zip), and 2 files in (*.kmz) format. 244 companion files are also included: 2 files in (*.csv) format and 242 plot photos in Joint Photographic Experts Group (*.jpg) format.

Figure 1. Vegetation point-intercept (VPI) any-hit cover metric data were combined with Landsat imagery to develop fractional maps of any-hit cover for four aggregated plant functional types (PFTs); bryophytes, herbs, lichen, and shrubs for the upland tundra area of the Y-K Delta, Alaska. VPI data were collected from plots in areas burned in 1971, 1985, 2005, and 2015. Source: Frost et al. 2020.
Citation
Frost, G.V., R.A. Loehman, P.R. Nelson, and D.P. Paradis. 2020. ABoVE: Vegetation Composition across Fire History Gradients on the Y-K Delta, Alaska. ORNL DAAC, Oak Ridge, Tennessee, USA. https://doi.org/10.3334/ORNLDAAC/1772
Table of Contents
- Dataset Overview
- Data Characteristics
- Application and Derivation
- Quality Assessment
- Data Acquisition, Materials, and Methods
- Data Access
- References
Dataset Overview
This dataset provides ecological field data that were collected during July 2017 and July 2018 from 43 plots spanning gradients of fire history in the upland tundra of the Yukon-Kuskokwim (Y-K) Delta, Alaska. Plot-level data include vegetation species composition and structure, leaf area index (LAI), topography, thaw-depth, and soil characteristics collected at plots burned in 1971-1972, 1985, 2006-2007, 2015, or unburned controls. Vegetation species were sampled along transects using the vegetation point-intercept (VPI) sampling approach and summarized by three metrics of vegetation cover: (1) top-hit cover, (2) any-hit cover, and (3) multi-hit cover (Karl et al. 2017). Each metric is the total number of hits for a species divided by the total number of sample points (Karl et al. 2017). The VPI any-hit cover metric data were combined with Landsat imagery to develop fractional maps of any-hit cover for four aggregated plant functional types (PFTs); bryophytes, herbs, lichen, and shrubs for the upland tundra area. Photographs of vegetation transects and soil pits are included as companion files.
These data characterize multi-decadal succession and landscape change across the Izaviknek and Kingaglia uplands of the Y-K Delta following extensive historical fire events.
Project: Arctic-Boreal Vulnerability Experiment
The Arctic-Boreal Vulnerability Experiment (ABoVE) is a NASA Terrestrial Ecology Program field campaign conducted in Alaska and western Canada between 2016 and 2021. Research for ABoVE links field-based, process-level studies with geospatial data products derived from airborne and satellite sensors, providing a foundation for improving the analysis, and modeling capabilities needed to understand and predict ecosystem responses to, and societal implications of, climate change in the Arctic and Boreal regions.
Related Dataset:
Whitley, M., G. Frost, M.T. Jorgenson, M. Macander, C.V. Maio, and S.G. Winder. 2018. ABoVE: Permafrost Measurements and Distribution Across the Y-K Delta, Alaska, 2016. ORNL DAAC, Oak Ridge, Tennessee, USA. https://doi.org/10.3334/ORNLDAAC/1598
Related Publication:
Frost, G.V., R.A. Loehman, L.B. Saperstein, M.J. Macander, P.R. Nelson, D.P. Paradis, and S.M. Natali. 2020. Multi-decadal patterns of vegetation succession after tundra fire on the Yukon-Kuskokwim Delta, Alaska. Environmental Research Letters 15:025003. DOI: https://doi.org/10.1088/1748-9326/ab5f49
Acknowledgments:
This work was supported by NASA's ABoVE grant NNH16CP09C and Western Alaska Landscape Conservation Cooperative (WALCC) award F16AC01215.
Data Characteristics
Spatial Coverage: Izaviknek and Kingaglia uplands, central Yukon-Kuskokwim Delta (YKD), Alaska
ABoVE Reference Locations:
Domain: Core ABoVE
State/territory: Alaska
Above Grid cell(s): Ah000v000 ;
Bh001v003, Bh002v003, Bh002v004;
Ch014v019, Ch013v019, Ch011v020, Ch012v020, Ch013v020, Ch014v020,
Ch015v020, Ch011v021, Ch012v021, Ch013v021, Ch014v021, Ch015v021,
Ch012v022, Ch013v022, Ch014v022, Ch015v022, Ch016v022, Ch012v023,
Ch013v023, Ch014v023, Ch015v023, Ch016v023, Ch013v024, Ch014v024
Spatial Resolution: plot measurements various, vegetation cover maps 30m2
Temporal Coverage: plot vegetation measurements 2017-07-20 to 2018-07-16
Temporal Resolution: annual
Study Area: Latitude and longitude are given in decimal degrees.
| Site | Westernmost Longitude | Easternmost Longitude | Northernmost Latitude | Southernmost Latitude |
|---|---|---|---|---|
| Yukon-Kuskokwim Delta | -164.688 | -160.938 | 62.0883 | 60.3598 |
Data File Information
This dataset includes 10 files: 2 files in Comma Separated Value (*.csv) format, 4 files in GeoTIFF (*.tif) format, 2 shapefiles (*.zip), and 2 files in Keyhole Markup Language Zipped (*.kmz) format.
Table 1. File names and descriptions.
| File Name | Description |
|---|---|
| vegetation_cover.csv | plot-level vegetation cover |
| plot_details.csv | plot-level characterization data |
| bryophyte_any_hit_cover.tif | Continuous cover map of bryophyte PFT, percentage of points where bryophyte species occurred combined with 60 spectral predictors derived from Landsat data. Included bryophyte species: acrocarpous mosses, liverworts, mosses, pleurocarpous mosses, and Sphagnum. |
| lichen_any_hit_cover.tif | Continuous cover map of lichen PFT, percentage of points where lichen species occurred combined with 60 spectral predictors derived from Landsat data. |
| herbaceous_any_hit_cover.tif |
Continuous cover map of herbaceous PFT, percentage of points where herbaceous species occurred combined with 60 spectral predictors derived from Landsat data. Included herbaceous species: forbs, grasses, sedges, and rushes. |
| shrub_any_hit_cover.tif | Continuous cover map of shrub PFT, percentage of points where shrub species occurred combined with 60 spectral predictors derived from Landsat data, including deciduous shrubs and evergreen shrubs. |
| plot_centers.zip | locations of plots |
| bounding_rectangle.zip | bounding rectangle around all plots |
| plot_centers.kmz | locations of plots |
| bounding_rectangle.kmz | bounding rectangle around all plots |
Data File Details
For GeoTIFF files, values are the percentage of sampled points where the respective PFT occurred, missing values are represented by 255, and each file contains 4,912 rows and 4,583 columns.
For CSV files, missing values are represented by -9999 for numeric data and NA for text data.
The projection is "Canada_Albers_Equal_Area_Conic", EPSG: 102001.
Table 2. Variable names and descriptions of file vegetation_cover.csv, also included as the companion file vegetation_cover_data_dictionary.csv.
| Variable Name | Description |
|---|---|
| plot_id |
Naming syntax: region_burn status-epoch-unique plot ID_sample year, where: Examples: YKDE_B-2015-K3-01_2018 (burned), YKDE_UB-1026_2017 (unburned) |
| date | date of data collection in YYYY-MM-DD format |
| longitude | X coordinate of plot center in decimal degrees |
| latitude | Y coordinate of plot center in decimal degrees |
| species | vegetation taxon or ground cover type; vegetation nomenclature follows Viereck & Little (2010) for shrubs, Skinnner et al. (2012) for grasses, and Hulten (1969) for all other vascular taxa |
| modifier | indicates standing dead (i.e., leaves and branches projecting above surface) or dead down (i.e., dead plant forms ground surface) status of vegetation; none = no modifier (i.e., live vegetation, detached litter, water, bare ground, etc.) |
| plant_functional_type | categorical class for plant functional type; note that Equisetum spp. are treated as forbs in this classification |
| any_hit_cover | the number of sample points where the species was intercepted ("hit") by a vertically mounted laser beam, divided by the total number of sample points (0-100%) |
| multi_hit_cover | the number of times the species was intercepted ("hit") by a vertically mounted laser beam, divided by the total number of sample points (can exceed 100%) |
| top_hit_cover | the number of sample points where the species was the first element intercepted ("hit") by a vertically mounted laser beam (i.e., formed the top of the canopy), divided by the total number of sample points (0-100%) |
Table 3. Variable names and descriptions of file plot_details.csv, also included in the companion file plot_details_data_dictionary.csv.
| Variable Name | Description |
|---|---|
| plot_id |
Naming syntax: region_burn status-epoch-unique plot ID_sample year, where: |
| date | date of data collection in YYYY-MM-DD format |
| longitude | X coordinate of plot center in decimal degrees |
| latitude | Y coordinate of plot center in decimal degrees |
| fire_year | year of last fire; burn status determined from AICC database and review of satellite imagery (Landsat and/or DigitalGlobe) |
| years_since_fire | number of years elapsed between last fire and field sampling |
| plot_radius | radius of plot in meters |
| percent_burned | percent of plot area that actually burned; visually estimated from post-fire DigitalGlobe imagery (where available; 2015 burn scars only) |
| mtbs_class | dominant fire severity class in Monitoring Trends in Burn Severity (MTBS) classification for burn (where available; burns after 2005 only; data gaps exist for some burns); see Eidinshink et al. 2007 |
| slope | slope angle at plot center in degrees; measured using an inclinometer |
| aspect | slope aspect at plot center in degrees; measured using a compass |
| pH | soil pH; measured from free water in soil pit excavated near the center of each plot |
| elec_cond | soil electrical conductivity in microsiemens; measured from free water in soil pit |
| surf_org_thick | total thickness of surface organic material in soil profile in centimeters |
| water_depth | water depth at the soil pit in centimeters; negative values indicate sub-surface |
| LAI_mean | mean of leaf area index (LAI) measurements; measured at every fifth point along each transect using a LAI-2000 Plant Canopy Analyzer (LI-COR Biosciences, Lincoln NE, USA) |
| LAI_stderr | standard error of mean LAI |
| LAI_n | total number of LAI measurements at each plot; each measurement consisted of the mean of five LAI readings collected in an "X" pattern directly above each sample point and at four points 1 meter away |
| woody_ht_mean | mean maximum shrub height in centimeters; measured within a 20 centimeter radius of every fifth point along each transect |
| woody_ht_stddev | standard deviation of mean maximum shrub height in centimeters |
| woody_ht_n | total number of maximum shrub height measurements at plot |
| thaw_depth_mean | mean thaw depth in centimeters; measured at every fifth point along each transect |
| thaw_depth_stddev | standard deviation of mean thaw depth in centimeters |
| thaw_depth_n | total number of thaw depth measurements at plot |
| veg_pt_intercept_n | total number of vegetation point-intercept sample points at plot |
| veg_class_AVC | vegetation class for plot; adapted from Alaska Vegetation Classification (AVC), Level IV (Viereck et al. 1992) |
| notes | field notes |
Companion Files
This dataset includes 244 companion files: 2 files in Comma Separated Value (*.csv) format and 242 files in Joint Photographic Experts Group (*.jpg) format.
The 242 files in *.jpg format are plot photos and follow a similar naming convention as plot_ID described in the first row of Table 2.
Vegetation Transect Photos
Naming syntax: region_burn status-last burn epoch-plot ID_sample year_photo info.jpg, where:
region: YKDE = Yukon-Kuskokwim Delta
burn status: B = burned, UB = unburned
epoch (last burn): 1971, 1985, 2005, 2015 (only for plots with "B" burn status)
plot ID: KX-X or XX (burned plots), XXXX (unburned plots), where X is a digit
sample year: YYYY
photo info: transect line = 1-3, photo direction = C (from center) or E (end of transect towards center)
Example: YKDE_B-2005-02_2017_3E.JPG
Soil Pit Photos
Naming syntax: region_burn status-last burn epoch-plot ID_sample year_photo info.jpg, where:
region: YKDE = Yukon-Kuskokwim Delta
burn status: B = burned, UB = unburned
epoch (last burn): 1971, 1985, 2005, 2015 (only for plots with "B" burn status)
plot ID: KX-X or XX (burned plots), XXXX (unburned plots), where X is a digit
sample year: YYYY
photo info: XXXX (a unique ID)
Example: YKDE_B-1971-08_2017_0907.JPG
Table 4. Companion file names and descriptions.
| File Name | Description |
|---|---|
| vegetation_cover_data_dictionary.csv | column names and descriptions for file vegetation_cover.csv |
| plot_details_data_dictionary.csv | column names and descriptions for file plot_details.csv |
| region_burn status-last burn epoch-plot ID_sample year_photo info.jpg | 242 plot vegetation transect and soil pit photos |
Application and Derivation
The data were collected to characterize multi-decadal succession and landscape change following extensive fire events in a lichen-dominated upland tundra of central Yukon-Kuskokwim Delta, Alaska.
Quality Assessment
Measures of dispersion are provided for some quantitative measurements for which multiple measurements were taken at a plot (e.g., leaf area index). However, many measures were collected only once per site. QA/QC on the field data was obtained by reviewing plot photographs and field notes, and performing logical checks on the point-intercept data.
Data Acquisition, Materials, and Methods
Alaska’s Yukon-Kuskokwim Delta (YKD) is one of the warmest parts of the Arctic tundra biome and tundra fires are common in its upland areas. Approximately 20% (789 km2) of the IKU has experienced fire since 1953, with about half of all fire occurring in 2015 (AICC 2019).
Following is a brief synopsis of methods and analyses provided in Frost et al. (2020).
Plot Selection
Plot locations were selected across a fire gradient using a stratified-random approach, with priority given to points within ABoVE remote-sensing flight lines and points in 2015 burn scars (i.e., sampled 2–3 years post-fire).
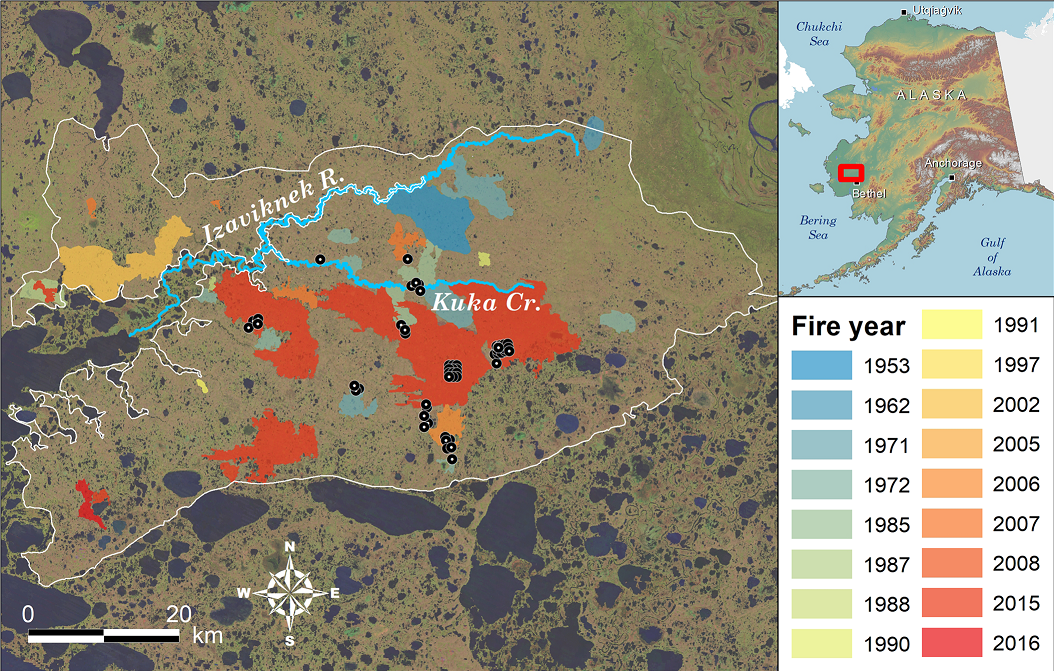
Figure 2. Map of Izaviknek-Kingaglia uplands study area, field plot locations, and perimeters of known tundra fires (1953–2016), Yukon-Kuskokwim Delta, Alaska. Fire perimeters adapted from AICC (2019). Source: Frost et al. 2020.
Sampling Design
Within plots, sampling occurred along three 30 m linear transects radiating at 120° intervals from the plot center, except for locations sampled 2-3 years post-fire, which consisted of four parallel 20 m transects oriented from east to west and spaced 5-10 m apart.
Soil Characterization
- Soil thaw depth (42 plots) was measured at 5 m intervals along transects.
- A soil pit was excavated to 40 cm depth near the center of each plot to record the thickness of the surface organic layer.
- Photos of each soil pit are included as companion files.
Vegetation Characterization
- Maximum shrub height (35 plots) was measured at 5 m intervals along transects.
- Leaf area index (LAI) was measured at every fifth point along each transect using a LAI-2000 Plant Canopy Analyzer (LI-COR Biosciences, Lincoln NE, USA). The value for each plot consisted of the mean of five LAI readings collected in an "X" pattern directly above each sample point and at four points 1 meter away.
- Vegetation cover data were collected once using a vegetation point-intercept (VPI) sampling approach within circular plots (15 or 35 m radius) from July 20-31, 2017 (24 plots) and July 8-16, 2018 (18 plots).
- Vegetation was sampled along the transects at 0.5-1 m intervals by recording all species "hit" (i.e., intercepted) by the beam from a vertically mounted laser pointer.
- Photos of vegetation transects are included as companion files.
Vegetation Cover Metrics
1. Top-hit cover (THC) is the percentage of sample points within a plot where a species was the first hit. THC represents the top-of-canopy and could be calculated at all 56 plots; the THC of all species sums to 100% per plot. THC was also calculated for litter (dead vegetation and detached leaves), water, and bare ground.
2. Any-hit cover (AHC) is the percentage of sample points within a plot where a species occurred. The total AHC for a plot can exceed 100% (i.e. in multi-layered vegetation); AHC was calculated for live vegetation at 46 plots.
3. Multi-hit cover (MHC) is the total number of hits for a species, divided by the number of sample points within a plot. MHC is a metric of canopy density and can include multiple hits of a species at a single point. MHC thus can exceed 100%; MHC was calculated for live vegetation at 38 plots.
Plant Functional Types
The vegetation cover (species and cover type) was aggregated into categorical “plant functional types” including acrocarpous mosses, bare ground, deciduous shrubs, evergreen shrubs, forbs, grasses, lichens, litter, liverworts, mosses, pleurocarpous mosses, sedges and rushes, shrubs, Sphagnum, and water.
PFT Cover Maps
Vegetation cover metrics were aggregated into four plant functional types (PFT): bryophytes (acrocarpous mosses, liverworts, mosses, pleurocarpous mosses, Sphagnum), herbs (forbs, grasses, sedges, rushes), lichen, and shrubs (deciduous shrubs, evergreen shrubs). The vegetation cover metrics were combined with 60 spectral predictors derived from Landsat data to develop continuous cover maps for the four PFTs at 30 m resolution. The spectral predictors consisted of percentile-based surface reflectance composites for 6 bands and 6 indices (e.g. Normalized Difference Vegetation Index) derived from Tier 1 Landsat 7 Enhanced Thematic Mapper and Landsat 8 Operational Land Imager data from June to September 2016–2018.
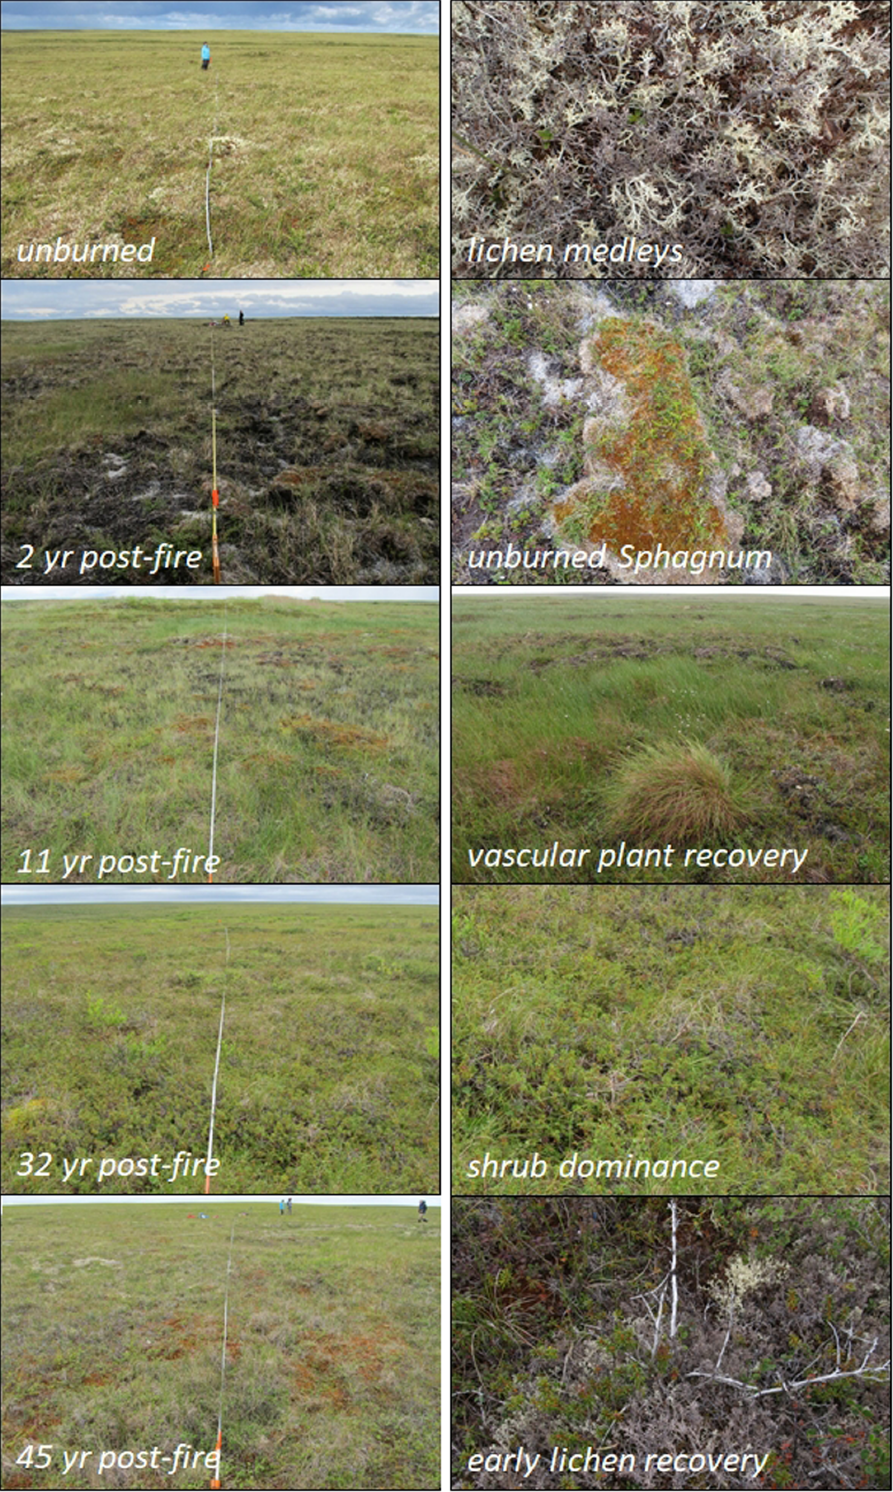
Figure 3. Field photos of transects (left) and typical vegetation (right) taken along a 45 years fire history gradient, Yukon-Kuskokwim Delta, Alaska. Source: Frost et al. 2020.
Data Access
These data are available through the Oak Ridge National Laboratory (ORNL) Distributed Active Archive Center (DAAC).
ABoVE: Vegetation Composition across Fire History Gradients on the Y-K Delta, Alaska
Contact for Data Center Access Information:
- E-mail: uso@daac.ornl.gov
- Telephone: +1 (865) 241-3952
References
AICC (Alaska Interagency CoordinationCenter) 2019 Alaska Historical Fire Information. https://afsmaps.blm.gov/imf_
firehistory/imf.jsp?site=firehistory
Eidenshink, J., Schwind, B., Brewer, K. et al. A Project for Monitoring Trends in Burn Severity. fire ecol 3, 3–21 (2007). https://doi.org/10.4996/fireecology.0301003
Frost, G.V., R.A. Loehman, L.B. Saperstein, M.J. Macander, P.R. Nelson, D.P. Paradis, and S.M. Natali. 2020. Multi-decadal patterns of vegetation succession after tundra fire on the Yukon-Kuskokwim Delta, Alaska. Environmental Research Letters 15:025003. DOI: https://doi.org/10.1088/1748-9326/ab5f49
Hultén, E. 1968. Flora of Alaska and Neighboring Territories: A manual of the vascular plants. Stanford University Press, Stanford, California. 1008 pp.
Karl, J.W., McCord, S.E., Hadley, B.C., 2017. A comparison of cover calculation techniques for relating point-intercept vegetation sampling to remote sensing imagery. Ecological Indicators 73, 156–165. DOI: https://doi.org/10.1016/j.ecolind.2016.09.034
Skinner, Q.D., et al. 2012. Field Guide to Alaska Grasses. Education Resources Publishing, Cumming, Georgia. ISBN 978-0-615-64886-6.
Viereck, L.A.; Dyrness, C.T.; Batten, A.R.; Wenzlick, K.J. 1992. The Alaska vegetation classification. Gen. Tech. Rep. PNW-GTR-286. Portland, OR: U.S. Department of Agriculture, Forest Service, Pacific Northwest Research Station. 278p https://doi.org/10.2737/PNW-GTR-286
Viereck, L.A. and Little, E.L. (2010). Alaska Trees and Shrubs. Fairbanks, AK. University of Alaska Press, 2 edition.