Documentation Revision Date: 2021-07-21
Dataset Version: 1
Summary
There are two data files in text-delimited (*.txt) format; one with time series observations of growing season lake greenness for each lake for each year, and a second comprising the greenness trends and associated significance for each lake.

Figure 1. Lakes with significant (p<0.05) negative trends in "greenness" of lake surface reflectance (left) and positive trends (right) across growing seasons from 1984-2019 below 75 degrees N. Source: Kuhn and Butman, 2021
Citation
Kuhn, C., and D. Butman. 2021. ABoVE: Lake Growing Season Green Surface Reflectance Trends, AK and Canada, 1984-2019. ORNL DAAC, Oak Ridge, Tennessee, USA. https://doi.org/10.3334/ORNLDAAC/1866
Table of Contents
- Dataset Overview
- Data Characteristics
- Application and Derivation
- Quality Assessment
- Data Acquisition, Materials, and Methods
- Data Access
- References
Dataset Overview
This dataset provides an annual time series of Landsat green surface reflectance and the derived annual trend during the growing season (June and July) for 472,890 lakes across the ABoVE Extended Study Domain from 1984 to 2019. The reflectance data are from Landsat-5, Landsat-7, and Landsat-8 sensors for the green band (center wavelength 560 nm). Over 270,000 Landsat scenes were evaluated and quality assured to be cloud-free and over water. Lakes were selected from HydroLAKES, a global database of lakes of at least 10 ha. Lake surface reflectance was extracted from a 3-by-3-pixel area centered on each lake centroid from the selected Landsat scenes determined from lake polygons. This dataset demonstrates changes in lake color over time in the arctic and boreal regions of North America. Color is relevant for understanding physical, ecological, and biogeochemical processes in some of the world’s highest concentrations of lakes where climate change may have significant impacts.
Project: Arctic-Boreal Vulnerability Experiment
The Arctic-Boreal Vulnerability Experiment (ABoVE) is a NASA Terrestrial Ecology Program field campaign based in Alaska and western Canada between 2016 and 2021. Research for ABoVE links field-based, process-level studies with geospatial data products derived from airborne and satellite sensors, providing a foundation for improving the analysis and modeling capabilities needed to understand and predict ecosystem responses and societal implications.
Related Publication
Kuhn, C., and D. Butman. 2021. Declining greenness in Arctic-boreal lakes. Proceedings of the National Academy of Sciences 118:e2021219118. https://doi.org/10.1073/pnas.2021219118
Related Datasets
Messager, M.L., B. Lehner, G. Grill, I. Nedeva, and O. Schmitt. 2016. Estimating the volume and age of water stored in global lakes using a geo-statistical approach. Nature Communications 7. https://doi.org/10.1038/ncomms13603.
- HydroLAKES is a database aiming to provide the shoreline polygons of all global lakes with a surface area of at least 10 ha. Data are available at www.hydrosheds.org.
Loboda, T.V., E.E. Hoy, and M.L. Carroll. 2019. ABoVE: Study Domain and Standard Reference Grids, Version 2. ORNL DAAC, Oak Ridge, Tennessee, USA. https://doi.org/10.3334/ORNLDAAC/1527
Acknowledgments
This study was funded by a NASA Earth and Space Science Fellowship in conjunction with the NASA Arctic and Boreal Vulnerability Experiment (ABoVE) project (grants NNH16AC03I, NNX15AU14A).
Data Characteristics
Spatial Coverage: Alaska, U.S., and Alberta, British Columbia, Northwest Territories, Nunavut, Saskatchewan, and Yukon, Canada
ABoVE Reference Locations
Domain: Extended ABoVE (Laboda et al., 2019)
State/Territory: Alaska and Canada
Grid cells: Ah000v000, Ah000v001, Ah001v000, Ah001v001 Ah001v002, Ah002v000, Ah002v001, Ah002v002, Ah003v000, Ah003v001, Ah003v002, Ah003v003.
Spatial Resolution: Point locations
Temporal Coverage: 1984-07-01 to 2019-09-01
Temporal Resolution: Growing season (June-July) annual composites
Study Area: All latitudes and longitudes given in decimal degrees
| Sites | Westernmost Longitude | Easternmost Longitude | Northernmost Latitude | Southernmost Latitude |
|---|---|---|---|---|
| Alaska and Canada | -168.103 | -81.2261 | 74.99945 | 49.54499 |
Data File Information
There are two data files in text-delimited (*.txt) format; one with time series observations of growing season lake greenness for each lake for each year, and a second showing the trends and associated significance for each lake. Each lake is identified by its HydroLAKES ID (Hylak_id).
User Note: The *.txt files are rather large. The time series data file has 14,130,886 observations and is 770 MB in size. The trends file has 472,889 observations and is 45 MB in size.
Table 1. File names and descriptions.
| File Name | Description |
|---|---|
| trends_1984_2019_landsat_ABoVE_lake_greenness.txt | Annual trend and significance in lake growing season greenness from 1984-2019 |
| time_series_landsat_ABoVE_lake_greenness_harmonised.txt | Annual average lake growing season greenness from 1984-2019 |
Data File Details
Table 2. Variables in the data file trends_1984_2019_landsat_ABoVE_lake_greenness.txt.
| Column Name | Units | Description |
|---|---|---|
| continent | Continent where lake is located. | |
| country | Country where lake is located | |
| hylak_id | Unique lake identifier from the HydroLAKES dataset | |
| latitude | Decimal Degrees | Latitude in decimal degrees of the lake centroid |
| longitude | Decimal Degrees | Longitude in decimal degrees of the lake centroid |
| sen_slope | Rs per year | The Sen slope is the change in unit of reflectance per year calculated by taking the median slope of all observations compared pairwise |
| mann_kendall_trend | Indicates whether the trend is significant at a p-value <0.05 and either increasing or decreasing. (no sig. trend, sig. decreasing, sig. increasing) | |
| trend_significance | Significance (p-value) of slope | |
| b2_mean | Mean Landsat growing season surface reflectance (Rs) in the green wavelengths averaged over the entire study period (1984-2019) | |
| b2_std_dev | Standard deviation of Landsat growing season surface reflectance in the green wavelengths averaged over the entire study period (1984-2019) |
Table 3. Variables in the data file time_series_landsat_ABoVE_lake_greenness_harmonised.txt.
| Column Name | Units | Description |
|---|---|---|
| hylak_id | Unique lake identifier from the HydroLAKES dataset | |
| date | YYYY-MM-DD | Growing season date. Set to July 1 of each year. |
| latitude | Decimal Degrees | Latitude in decimal degrees of the lake centroid |
| longitude | Decimal Degrees | Longitude in decimal degrees of the lake centroid |
| b2_mean | Mean Landsat growing season surface reflectance (Rs) in the green wavelengths averaged over that year's growing season | |
| b2_std_dev | Standard deviation of Landsat growing season surface reflectance in the green wavelengths averaged over that year's growing season |
Application and Derivation
This dataset is intended for evaluating changes in satellite lake color throughout the ABoVE domain. Satellite color is relevant for understanding physical, ecological, and biogeochemical processes in lakes.
Quality Assessment
This dataset was carefully quality controlled using a series of conservative filters to ensure only cloud-free pixels were used. At each lake centroid, the median, mean and standard deviation of the growing season surface reflectance in the green wavelengths (~560 nm) was calculated. The mean and standard deviation of green reflectance for each lake and the growing season mean and standard deviation per lake per year are provided in the data files (Kuhn and Butman, 2021).
Data Acquisition, Materials, and Methods
Overview
A time series and the annual trend in growing season (June-July) surface reflectance in the green wavelengths (~560 nm) was calculated for 472,890 lakes across the ABoVE domain from 1984 to 2019.
Landsat Data
Lake color was derived from Landsat observations from the Landsat-5, Landsat-7, and Landsat-8 sensors across the ABoVE domain (Fig. 2.). Landsat scenes acquired over the study domain (278,284 total scenes) were accessed through Google Earth Engine.
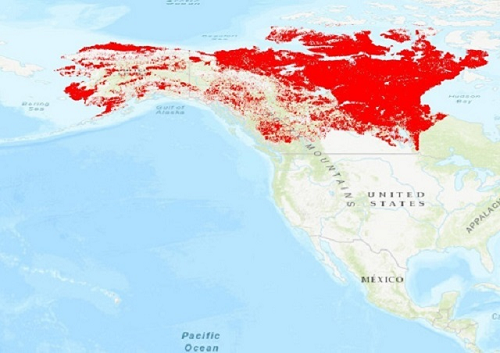
Figure 2. Study area (indicated in red) across the ABoVE domain.
Lake Greenness
Growing-season greenness for each lake was identified by sampling a 3-by-3 pixel area centered on each lake centroid calculated from HydroLAKES polygons within the study domain. HydroLAKES (Messager et al., 2016) is a dataset that includes lakes of at least 10 ha. The median, mean, SD, and pixel count of the green band inside each 3-by-3 pixel box were calculated for each lake at the native scale of the Landsat green band (30 m). Growing season greenness for each lake for each year was then exported for visualization and statistical analysis.
The dataset was further screened to exclude negative pixels (<1% of the dataset) and lakes with less than 10 years of data (2% of the dataset). To conservatively ensure that each observation was cloud-free and over water, a final filter using the Pixel QA ("pixel_qa") band was imposed to identify only lakes identified as cloud-free and water. Lake centroids were further intersected with the Global Surface Water Dataset (Pekel et al., 2016), and only those identified as having only permanent surface water ("transition_class"=1) inside the 3 × 3 grid were maintained in the dataset.
Time Series Analysis
To assess changes in lake surface reflectance over time, the final time series was created taking the average growing season reflectance, calculated as the average of Landsat scenes acquired during June-July based on precedent in the literature (Sulla-Menashe et al., 2018; Miles et al., 2019) and to avoid high cloud cover in August. Trends were calculated using Theil-Sen’s Slope Estimator from the SciPy package (Jones et al., 2001), and slopes were tested for significance using a Mann–Kendall test, which is designed to identify monotonic trends and is been widely used to identify terrestrial greening and browning trends (de Jong et al., 2011). This nonparametric approach accounts for gaps in observation years.
Refer to Kuhn and Butman (2021) for details.
Data Access
These data are available through the Oak Ridge National Laboratory (ORNL) Distributed Active Archive Center (DAAC).
ABoVE: Lake Growing Season Green Surface Reflectance Trends, AK and Canada, 1984-2019
Contact for Data Center Access Information:
- E-mail: uso@daac.ornl.gov
- Telephone: +1 (865) 241-3952
References
de Jong, R., S. de Bruin, A. de Wit, M. E. Schaepman, and D. L. Dent. 2011. Analysis of monotonic greening and browning trends from global NDVI time-series. Remote Sensing of Environment 115:692–702. https://doi.org/10.1016/j.rse.2010.10.011
E. Jones, E., T. Oliphant, and P. Peterson. 2001. SciPy: Open source scientific tools for Python. https://www.scipy.org/scipylib/download.html. Accessed 5 January 2017.
Kuhn, C., and D. Butman. 2021. Declining greenness in Arctic-boreal lakes. Proceedings of the National Academy of Sciences 118:e2021219118. https://doi.org/10.1073/pnas.2021219118
Kuhn, C., M. Bogard, S.E. Johnston, A. John, E. Vermote, R. Spencer, M. Dornblaser, K. Wickland, R. Striegl, and D. Butman. 2020. Satellite and airborne remote sensing of gross primary productivity in boreal Alaskan lakes. Environmental Research Letters 15:105001. https://doi.org/10.1088/1748-9326/aba46f
Kuhn, C., A. de Matos Valerio, N. Ward, L. Loken, H. O. Sawakuchi, M. Kampel, J. Richey, P. Stadler, J. Crawford, R. Striegl, E. Vermote, N. Pahlevan, and D. Butman. 2019. Performance of Landsat-8 and Sentinel-2 surface reflectance products for river remote sensing retrievals of chlorophyll-a and turbidity. Remote Sensing of Environment 224:104–118. https://doi.org/10.1016/j.rse.2019.01.023
Loboda, T.V., E.E. Hoy, and M.L. Carroll. 2019. ABoVE: Study Domain and Standard Reference Grids, Version 2. ORNL DAAC, Oak Ridge, Tennessee, USA. https://doi.org/10.3334/ORNLDAAC/1527
Messager, M.L., B. Lehner, G. Grill, I. Nedeva, and O. Schmitt. 2016. Estimating the volume and age of water stored in global lakes using a geo-statistical approach. Nature Communications 7. https://doi.org/10.1038/ncomms13603. Data are available at www.hydrosheds.org
Miles, M.W., V.V. Miles, and I. Esau. 2019. Varying climate response across the tundra, forest-tundra and boreal forest biomes in northern West Siberia. Environmental Research Letters 14:075008. https://doi.org/10.1088/1748-9326/ab2364
Pekel, J.-F., A. Cottam, N. Gorelick, and A.S. Belward. 2016. High-resolution mapping of global surface water and its long-term changes. Nature 540:418–422. https://doi.org/10.1038/nature20584
Sulla-Menashe, D., C.E. Woodcock, and M.A. Friedl. 2018. Canadian boreal forest greening and browning trends: an analysis of biogeographic patterns and the relative roles of disturbance versus climate drivers. Environmental Research Letters 13:014007. https://doi.org/10.1088/1748-9326/aa9b88