Documentation Revision Date: 2022-03-03
Dataset Version: 1
Summary
The mapped disturbance agents were derived from Thematic Mapper (TM) and Enhanced Thematic Mapper (ETM+) observations across 164 ABoVE tiles. The product uses the Land Cover product for differentiating disturbances to forest or non-forest land covers (Wang et al., 2019a). The dTC images for deriving causal agents of disturbance are provided at an annual step from 1985–2012.
There are 328 data files included in this dataset, two for each ABoVE tile: 164 files in GeoTIFF (*.tif) and 164 files in netCDF (*.nc) formats. Also included is one companion file in comma-separated text (*.csv) format.
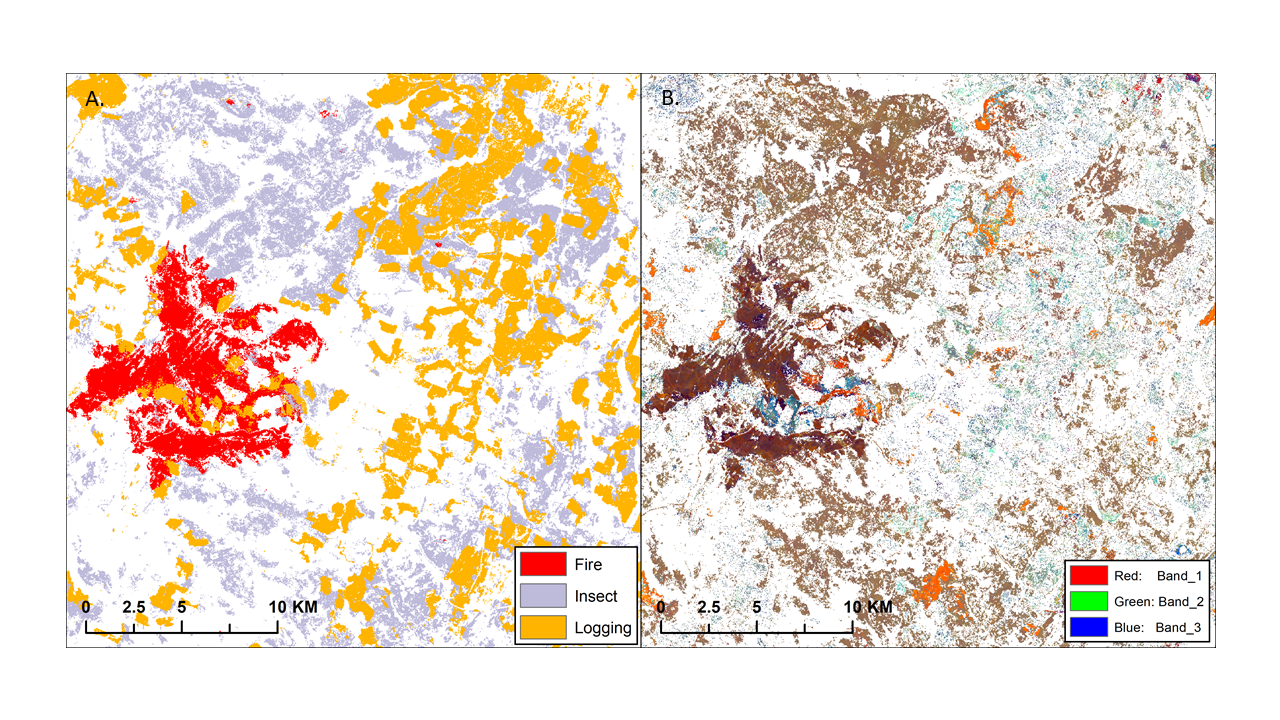
Figure 1. Casual agents of disturbance for the year 2006 in the ABoVE domain for tile BH19V15 (A) with the Tasseled Cap change (dTC) image in the same year for the same region (B). In the dTC image, Band_1 is change in brightness; Band_2 is change in greenness; Band_3 is change in wetness. The pixel resolution is 30 meters. Source: Bh09v15_ABoVE_disturbance_agents.tif; Bh09v15_dTC.nc
Citation
Zhang, Y., C.E. Woodcock, S. Chen, J. Wang, D. Sulla-Menashe, Z. Zuo, P. Olofsson, Y. Wang, and M.A. Friedl. 2022. ABoVE: Landsat-derived Annual Disturbance Agents Across ABoVE Core Domain, 1987-2012. ORNL DAAC, Oak Ridge, Tennessee, USA. https://doi.org/10.3334/ORNLDAAC/1924
Table of Contents
- Dataset Overview
- Data Characteristics
- Application and Derivation
- Quality Assessment
- Data Acquisition, Materials, and Methods
- Data Access
- References
Dataset Overview
This dataset provides spatial data on disturbance agents of fire, insects, and logging in the Arctic Boreal Vulnerability Experiment (ABoVE) core domain at an annual time step from 1987–2012 at 30 m resolution. Using a time-series of Landsat data, the three disturbance types were identified by abrupt changes in Tasseled Cap (dTC) indices of brightness, greenness, and wetness. Disturbances were detected by a Continuous Change Detection and Classification (CCDC) harmonic regression model applied to the time series.
The mapped disturbance agents were derived from Thematic Mapper (TM) and Enhanced Thematic Mapper (ETM+) observations across 164 ABoVE tiles. The product uses the Land Cover product for differentiating disturbances to forest or non-forest land covers (Wang et al., 2019a). The dTC images for deriving causal agents of disturbance are provided at an annual step from 1985–2012.
Project: Arctic-Boreal Vulnerability Experiment
The Arctic-Boreal Vulnerability Experiment (ABoVE) is a NASA Terrestrial Ecology Program field campaign being conducted in Alaska and western Canada, for 8 to 10 years, starting in 2015. Research for ABoVE links field-based, process-level studies with geospatial data products derived from airborne and satellite sensors, providing a foundation for improving the analysis, and modeling capabilities needed to understand and predict ecosystem responses to, and societal implications of, climate change in the Arctic and Boreal regions.
Related Publication
Zhang, Y., C.E. Woodcock, S. Chen, D. Sulla-Menashe, J.A. Wang, Y. Wang, Z. Zuo, P. Olofsson, and M.A. Friedl. 2022. Mapping causal agents of disturbance in boreal and arctic ecosystems of North America using time series of Landsat data. Remote Sensing of Environment, 272, 112935. https://doi.org/10.1016/j.rse.2022.112935
Related Datasets
Loboda, T.V., D. Chen, J.V. Hall, and J. He. 2018. ABoVE: Landsat-derived Burn Scar dNBR across Alaska and Canada, 1985-2015. ORNL DAAC, Oak Ridge, Tennessee, USA. https://doi.org/10.3334/ORNLDAAC/1564
Wang, J.A., D. Sulla-Menashe, C.E. Woodcock, O. Sonnentag, R.F. Keeling, and M.A. Friedl. 2019. ABoVE: Landsat-derived Annual Dominant Land Cover Across ABoVE Core Domain, 1984-2014. ORNL DAAC, Oak Ridge, Tennessee, USA. https://doi.org/10.3334/ORNLDAAC/1691
Acknowledgments
This research was funded by NASA's Arctic-Boreal Vulnerability Experiment (grant NNX15AU63A).
Data Characteristics
Spatial Coverage: Alaska and western Canada
ABoVE Reference Locations
Domain: Core
State/Territory: Alaska and western Canada
Grid cells (164): Bh01v03, Bh01v04, Bh01v05, Bh02v02, Bh02v03, Bh02v04, Bh02v05, Bh02v06, Bh03v01, Bh03v02, Bh03v03, Bh03v04, Bh03v05, Bh03v06, Bh04v01, Bh04v02, Bh04v03, Bh04v04, Bh04v05, Bh05v00, Bh05v01, Bh05v02, Bh05v03, Bh05v04, Bh05v05, Bh05v06, Bh06v00, Bh06v01, Bh06v02, Bh06v03, Bh06v04, Bh06v05, Bh06v06, Bh06v07, Bh06v08, Bh06v09, Bh07v00, Bh07v01, Bh07v02, Bh07v03, Bh07v04, Bh07v05, Bh07v06, Bh07v07, Bh07v08, Bh07v09, Bh07v10, Bh08v01, Bh08v02, Bh08v03, Bh08v04, Bh08v05, Bh08v06, Bh08v07, Bh08v08, Bh08v09, Bh08v10, Bh08v11, Bh08v12, Bh08v13, Bh08v14, Bh09v03, Bh09v04, Bh09v05, Bh09v06, Bh09v07, Bh09v08, Bh09v09, Bh09v10, Bh09v11, Bh09v12, Bh09v13, Bh09v14, Bh09v15, Bh10v04, Bh10v05, Bh10v06, Bh10v07, Bh10v08, Bh10v09, Bh10v10, Bh10v11, Bh10v12, Bh10v13, Bh10v14, Bh10v15, Bh10v16, Bh10v17, Bh11v05, Bh11v06, Bh11v07, Bh11v08, Bh11v09, Bh11v10, Bh11v11, Bh11v12, Bh11v13, Bh11v14, Bh11v15, Bh11v16, Bh12v05, Bh12v06, Bh12v07, Bh12v08, Bh12v09, Bh12v10, Bh12v11, Bh12v12, Bh12v13, Bh12v14, Bh12v15, Bh12v16, Bh13v04, Bh13v06, Bh13v07, Bh13v08, Bh13v09, Bh13v10, Bh13v11, Bh13v12, Bh13v13, Bh13v14, Bh13v15, Bh13v16, Bh14v03, Bh14v04, Bh14v05, Bh14v07, Bh14v08, Bh14v09, Bh14v10, Bh14v11, Bh14v12, Bh14v13, Bh14v14, Bh14v15, Bh15v05, Bh15v06, Bh15v07, Bh15v08, Bh15v09, Bh15v10, Bh15v11, Bh15v12, Bh15v13, Bh15v14, Bh15v15, Bh16v05, Bh16v06, Bh16v07, Bh16v08, Bh16v09, Bh16v10, Bh16v11, Bh16v12, Bh16v13, Bh16v14, Bh17v06, Bh17v07, Bh17v08, Bh17v09, Bh17v10, Bh17v11, Bh17v12
Spatial Resolution: 30 m
Temporal Coverage: 1985-01-01 to 2013-12-31
Temporal Resolution: Annual estimates
Site Boundaries: Latitude and longitude are given in decimal degrees.
| Site | Westernmost Longitude | Easternmost Longitude | Northernmost Latitude | Southernmost Latitude |
|---|---|---|---|---|
| western Canada and Alaska | -169.960 | -98.974 | 75.686 | 50.259 |
Data File Information
There are 328 data files included in this dataset, two for each ABoVE tile: 164 files in GeoTIFF (*.tif) and 164 files in netCDF (*.nc) formats. Also included is one companion file in comma-separated text (*.csv) format. The files are named BhXXvZZ_variable.ext, where
XX is the horizontal tile location on the ABoVE moderate resolution (B cell) reference grid,
ZZ is the vertical tile location on the ABoVE moderate resolution (B cell) reference grid,
variable is the type of data collected ("ABoVE_disturbance_agents" or "dTC"), and
ext is the file extension ("tif" or "nc").
Table 1. File names and descriptions.
| File Name | Description |
|---|---|
| Data Files | |
| BhXXvZZ_ABoVE_disturbance_agents.tif | Annual maps of causal agents of disturbance for tile BhXXvZZ. One band for each year from 1987 to 2012; 26 bands. See Table 2 for definitions of cell values. |
| BhXXvZZ _dTC.nc | Annual images of the difference of Tasseled Cap indices before and after the break. See Table 3 for variables included in these images. |
| Companion Files | |
| Accuracy_results.csv | Provides confusion matrices and summary information for two versions of the accuracy assessment: one that separates causal agents (fire, insect, logging) of disturbance and another assessment in which causal agents are aggregated into a single "disturbance" category. |
Data File Details
All data have a 30 m resolution assembled in 6000 rows x 6000 columns and mapped in the standard ABoVE projection "Canada Albers Equal Area Conic" (EPSG:102001).
The GeoTiff files contain the disturbance data. Each file holds 26 bands that correspond to a year for the period 1987–2012, where band 1 is for 1987, band 2 is for 1988, etc. The cell values are classes of disturbance agents (Table 2). The no data value is 255 and the datatype is Byte.
The netCDF files contain rasters of the Tasseled Cap metrics used to detect disturbance. Each netCDF holds six variables (Table 3) with annual values for the years 1985 to 2013. The no data value is -32767.
Table 2. Cell values for files named BhXXvZZ_ABoVE_disturbance_agents.tif.
| Cell Value | Agent | Description |
|---|---|---|
| 1 | Fire | Disturbance due to fire |
| 2 | Insect | Forest loss due to insect damage |
| 3 | Logging | Forest loss due to timber harvesting and associated infrastructure |
| NoData | None | No disturbance detected |
Table 3. Variables in files named BhXXvZZ _dTC.nc. "Break" refers to an abrupt change in brightness, greenness, and wetness metrics detected by CCDC harmonic regression models.
| Variable | Units | Description |
|---|---|---|
| d_brightness | 1 | Difference in the Tasseled Cap brightness between the year before and the year after the break |
| d_greenness | 1 | Difference in the Tasseled Cap greenness between the year before and the year after the break |
| d_wetness | 1 | Difference in the Tasseled Cap wetness between the year before and the year after the break |
| pre_brightness | 1 | Tasseled Cap brightness before the break |
| pre_greenness | 1 | Tasseled Cap greenness before the break |
| pre_wetness | 1 | Tasseled Cap wetness before the break |
Application and Derivation
The datasets provide information on the timing and location of different kinds of disturbances for the entire ABoVE domain at 30 m resolution over 26 years.
Quality Assessment
The accuracy of the final disturbance map (Table 4) was assessed following the recommendations of Olofsson et al. (2014). The disturbance map was compared to reference conditions using a stratified random sample of locations (Fig. 3). Reference data included Alberta forest health spatial data from 2005–2017 and British Columbia Aerial Overview Survey Data since 1999. The strata were defined using a combination of analysis criteria for undisturbed areas and disturbance types. Samples from the disturbance maps and reference data were used to calculate the error matrix and estimate areas in each class (Stehman, 2014).
In addition, disturbance agents were aggregated to “disturbance” and “no disturbance” categories. Aggregation improved the user’s and producer’s accuracies of the disturbance map to 96.6% (±0.02%) and 90.5% (±0.25%). Results indicate that 10.3% of the ABoVE core domain was disturbed between 1987–2012, with a margin of error of 0.005%. See the companion file Accuracy_results.csv for more information. See Zhang et al. (2022) for details of this assessment.
Table 4. Results of the accuracy assessment.
| Accuracy | Fire | Insect | Logging | No Disturbance |
|---|---|---|---|---|
| User | 0.980 | 0.633 | 0.880 | 0.970 |
| Producer | 0.777 | 0.222 | 0.550 | 1.000 |
| Overall | 96.7%±0.86% | |||
Data Acquisition, Materials, and Methods
The Landsat 5 Thematic Mapper and Landsat 7 Enhanced Thematic Mapper data from 1984 to 2014 were reprojected into the ABoVE standard Alber’s Equal-Area projection (30 m grid, EPSG 102001) and were gridded into 180 km x 180 km ABoVE standard B grid tiles (Loboda et al., 2017). This work processed 164 B grid tiles over the ABoVE core domain to create a time series of 30 years (Zhu et al., 2015). Tasseled cap indices for brightness, greenness, and wetness (Table 3) were computed for between year changes in this time series and are provided in the netCDF files in this dataset for the years 1985–2013. The time series was analyzed to identify disturbances, recognized by abrupt changes in spectral metrics, that occurred in the years 1987–2012.
Harmonic regression models in Continuous Change Detection and Classification (CCDC; Zhu and Woodcock, 2014) were fit to the cloud-free and snow-free time series data. This analysis utilized the approach and parameters for land cover classification described by Wang et al. (2019a; 2019b); however, disturbances were identified by “breaks” between harmonic regression models rather than “segments” (time between breaks). A break is an abrupt temporal change in spectral characteristics of a pixel, which is indicative of land-cover change (Fig. 2).
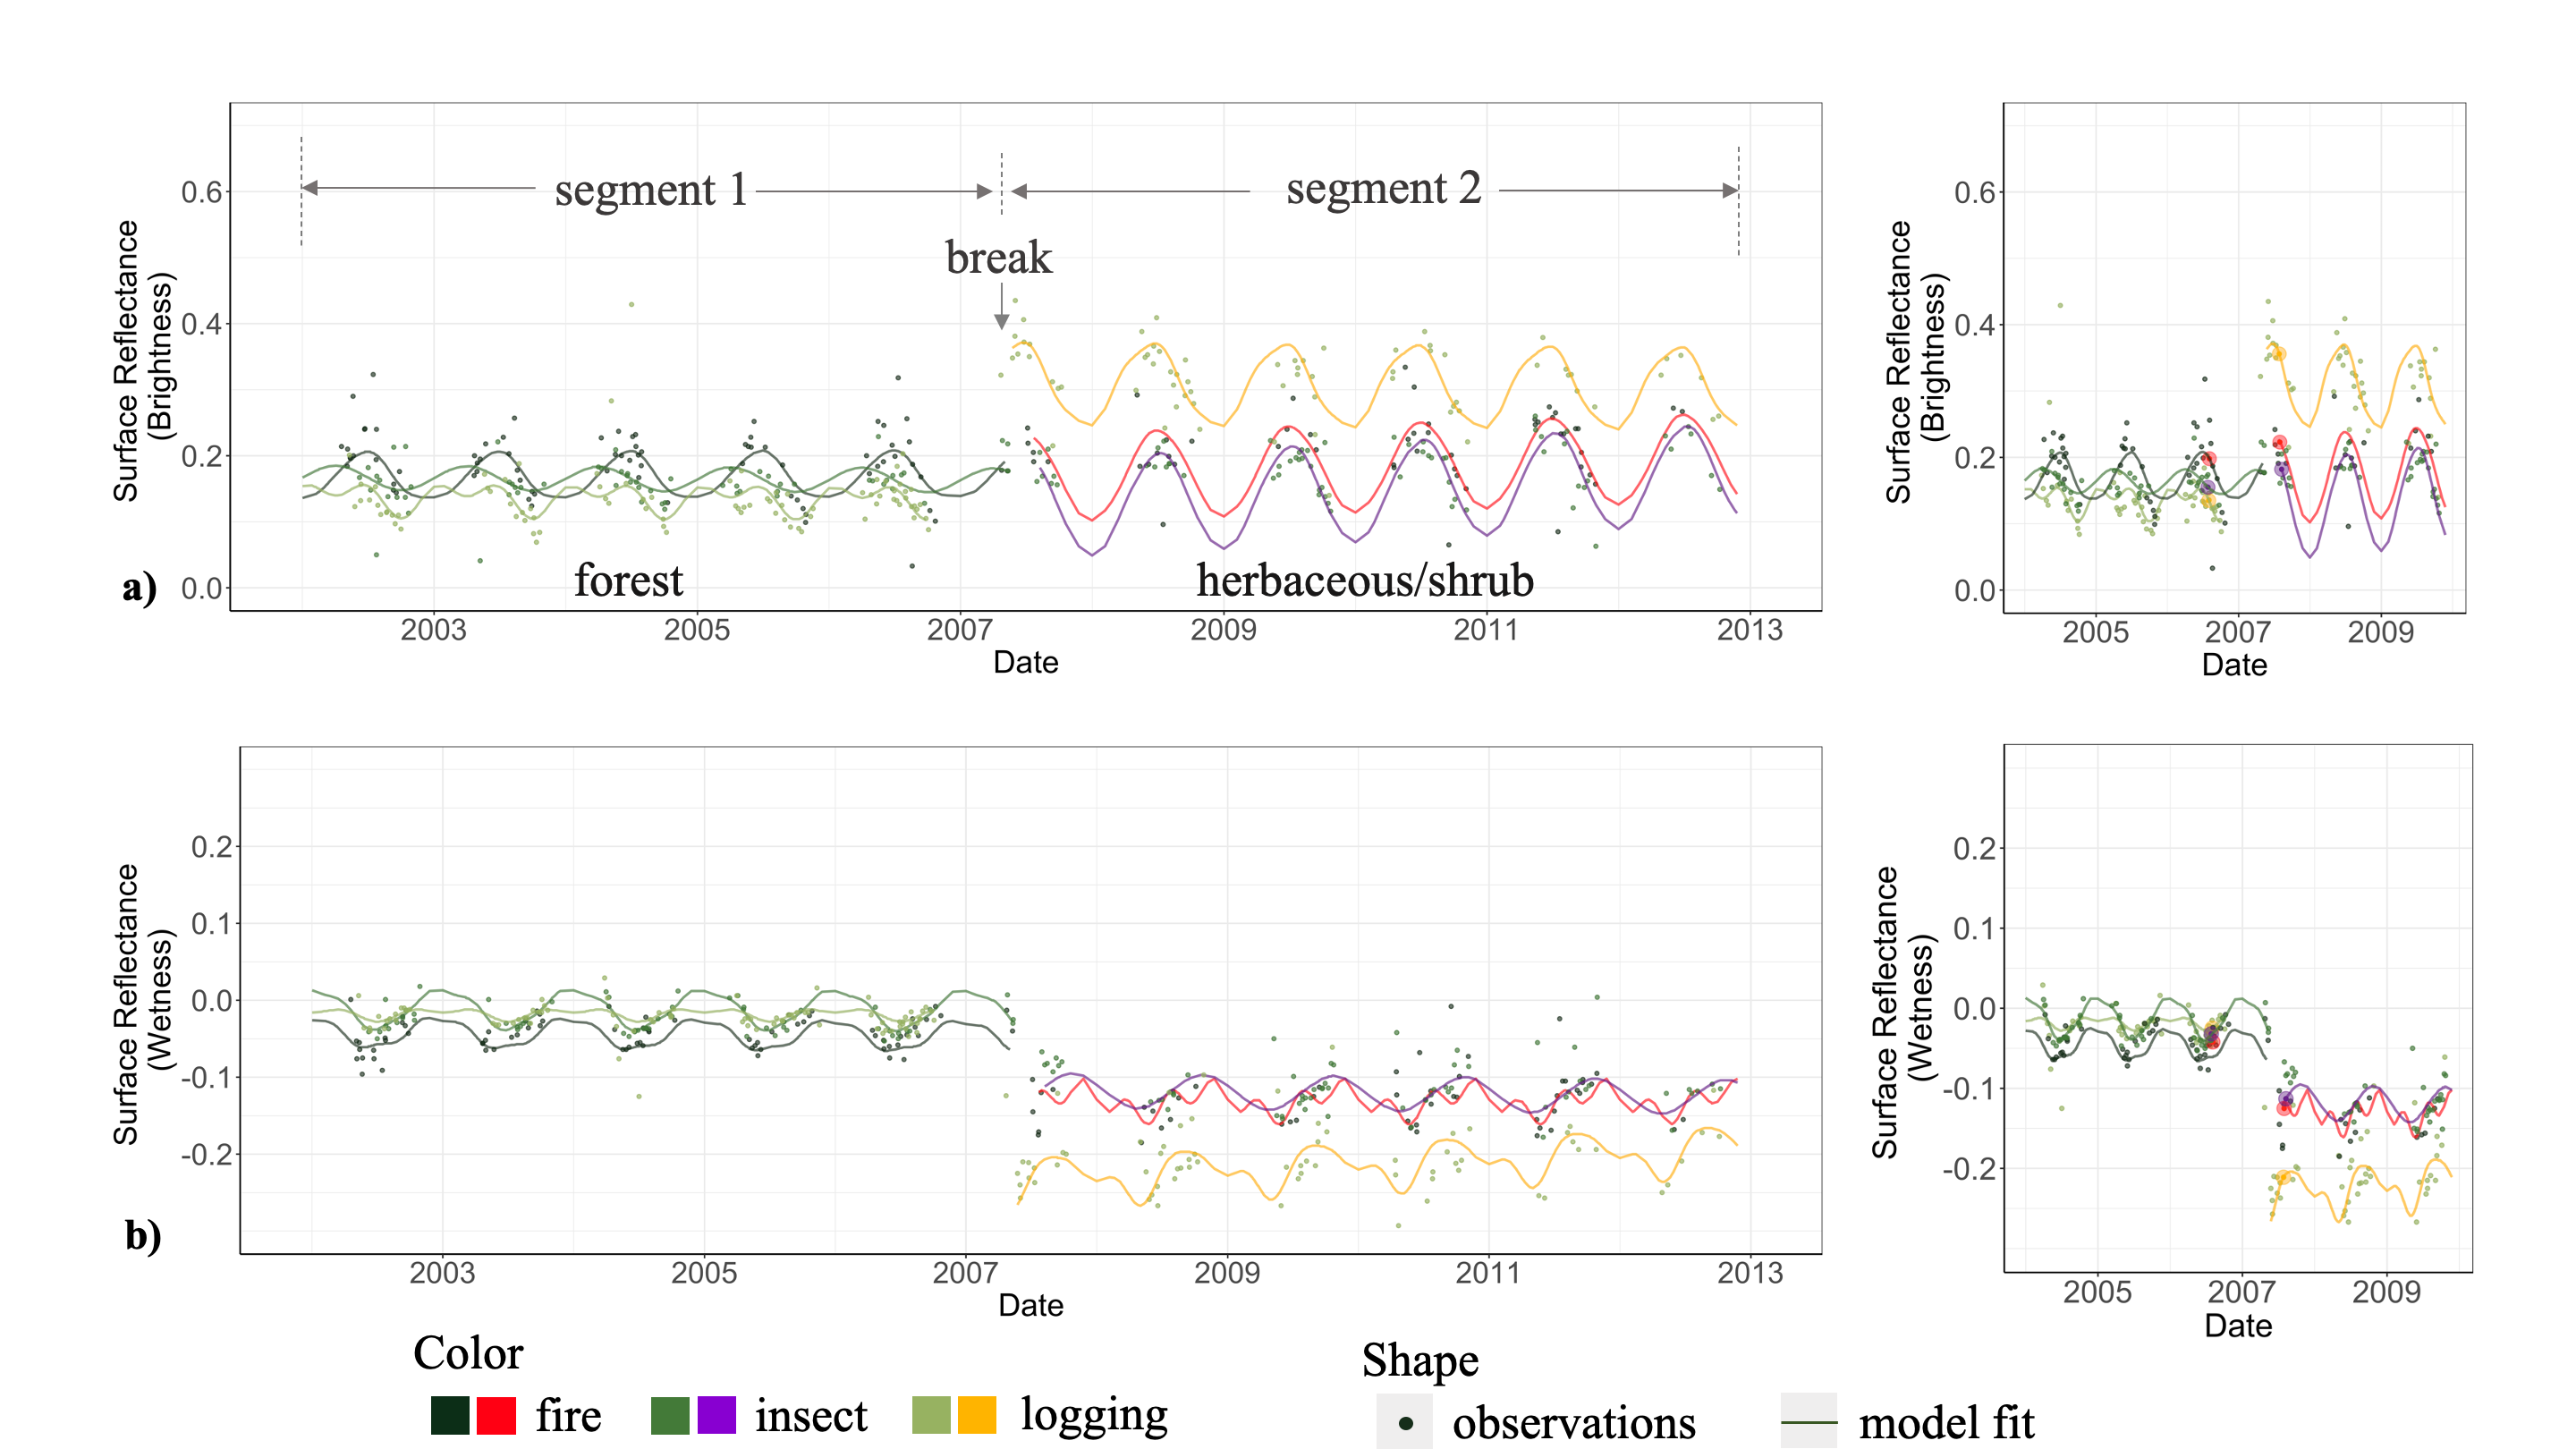
Figure 2. Landsat time series for three pixels from 1985 to 2020. The left panel includes the entire time series and the right panel is an enlargement around the breakpoints ranging from 2004 to 2010. Curves are model fits that included two “segments” separated by a “break” detected by Continuous Change Detection and Classification (CCDC; Zhu and Woodcock, 2014) in 2007. Three disturbance causal agents are shown for areas that started as forest and ended up with herbaceous or shrubs after experiencing fire, insect damage, or logging. Source: Zhang et al. (2022)
CCDC model breaks were classified based on training data (2,058 polygons for a total of 232,725 pixels). Each model break was assigned to fire, insect, logging, or no disturbance. Ancillary datasets were used to validate the presence and causative agents of disturbances: Alberta Mountain Pine Beetle Aerial Survey, Northwest Territories pest damage inventory data, the Canadian National Fire Database (Canadian Forest Service and Natural Resources Canada, 2019), and the Alaska Fire History Perimeter Polygons (AWFCG, 2020). Reference data were collected for a stratified random sample of 1900 units (Fig. 3), using these ancillary datasets and high-resolution images on Google Earth and Landsat images. The reference data were used to assess the accuracy of disturbance results using the methods of Olofsson et al. (2014) and Stehman (2014).
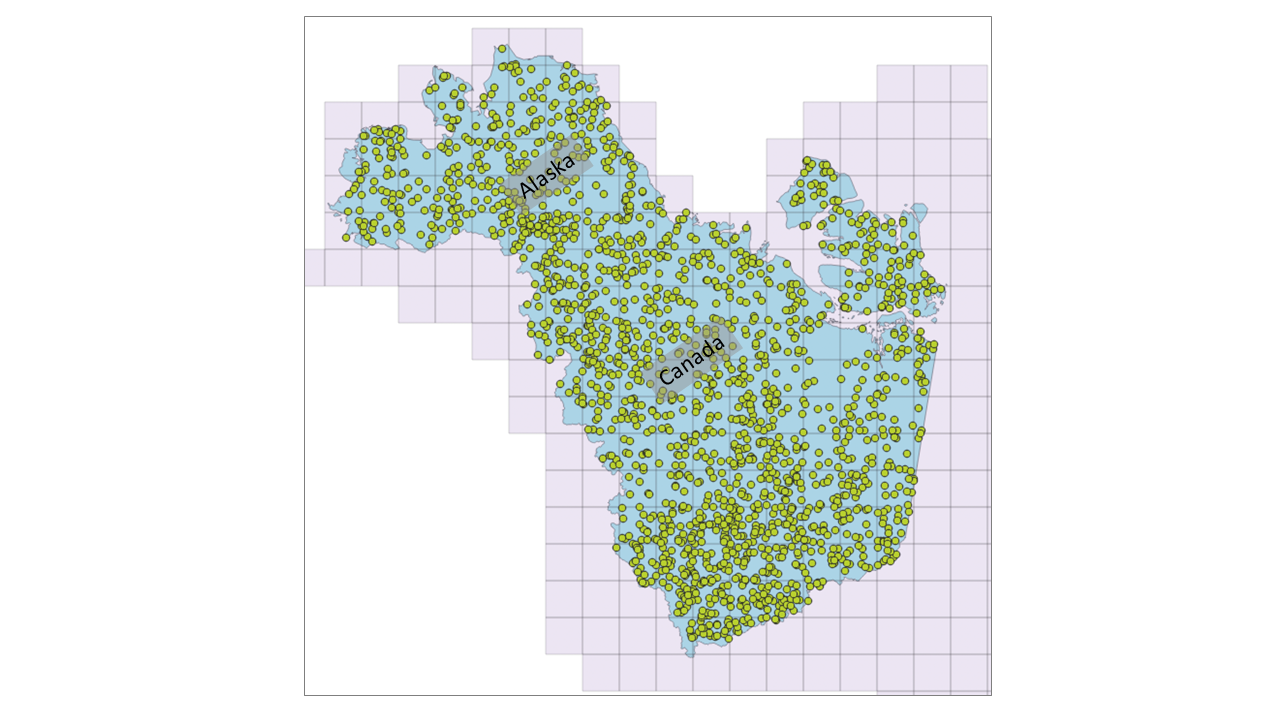
Figure 3. Locations of 1900 stratified random sample locations used in accuracy assessment. Source: authors.
See Zhang et al. (2022) for details of this project.
Data Access
These data are available through the Oak Ridge National Laboratory (ORNL) Distributed Active Archive Center (DAAC).
ABoVE: Landsat-derived Annual Disturbance Agents Across ABoVE Core Domain, 1987-2012
Contact for Data Center Access Information:
- E-mail: uso@daac.ornl.gov
- Telephone: +1 (865) 241-3952
References
AWFCG. 2020. Alaska Fire History Perimeter Polygons. Alaska Wildland Fire Coordinating Group (AWFCG) and Alaska Interagency Coordination Center (AICC). https://fire.ak.blm.gov/predsvcs/maps.php
Canadian Council Of Forest Ministers-Conseil Canadien Des Ministres Des Forêts. 2019, May 27. National Forestry Database - Base de données nationales sur les forêts - Canada. Zenodo. http://doi.org/10.5281/zenodo.3843429
Loboda, T.V., E.E. Hoy, and M.L. Carroll. 2017. ABoVE: Study Domain and Standard Reference Grids, Version 2. ORNL Distributed Active Archive Center. https://doi.org/10.3334/ORNLDAAC/1527
Olofsson, P., G.M. Foody, M. Herold, S.V. Stehman, C.E. Woodcock, and M.A. Wulder. 2014. Good practices for estimating area and assessing accuracy of land change. Remote Sensing of Environment 148:42–57. https://doi.org/10.1016/j.rse.2014.02.015
Stehman, S.V. 2014. Estimating area and map accuracy for stratified random sampling when the strata are different from the map classes. International Journal of Remote Sensing 35:4923–4939. https://doi.org/10.1080/01431161.2014.930207
Wang, J.A., D. Sulla-Menashe, C.E. Woodcock, O. Sonnentag, R.F. Keeling, and M.A. Friedl. 2019a. ABoVE: Landsat-derived Annual Dominant Land Cover Across ABoVE Core Domain, 1984-2014. ORNL Distributed Active Archive Center. https://doi.org/10.3334/ORNLDAAC/1691
Wang, J.A., D. Sulla-Menashe, C.E. Woodcock, O. Sonnentag, R.F. Keeling, and M.A. Friedl. 2019b. Extensive land cover change across Arctic–Boreal Northwestern North America from disturbance and climate forcing. Global Change Biology 26:807–822. https://doi.org/10.1111/gcb.14804
Zhang, Y., C.E. Woodcock, S. Chen, D. Sulla-Menashe, J.A. Wang, Y. Wang, Z. Zuo, P. Olofsson, and M.A. Friedl. 2022. Mapping causal agents of disturbance in boreal and arctic ecosystems of North America using time series of Landsat data. Remote Sensing of Environment, 272, 112935. https://doi.org/10.1016/j.rse.2022.112935
Zhu, Z., and C.E. Woodcock. 2014. Continuous change detection and classification of land cover using all available Landsat data. Remote Sensing of Environment 144:152–171. https://doi.org/10.1016/J.RSE.2014.01.011
Zhu, Z., C.E. Woodcock, C. Holden, and Z. Yang. 2015. Generating synthetic Landsat images based on all available Landsat data: Predicting Landsat surface reflectance at any given time. Remote Sensing of Environment 162:67–83. https://doi.org/10.1016/j.rse.2015.02.009