Documentation Revision Date: 2024-09-30
Dataset Version: 1
Summary
This dataset contains four files in NetCDF format.
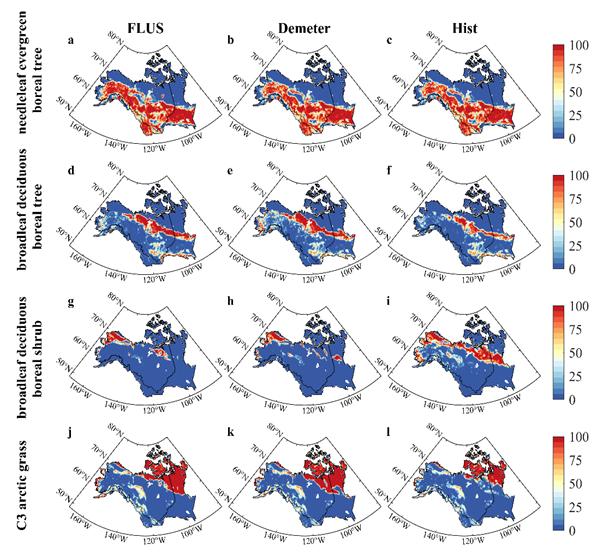
Figure 1. The spatial pattern of land use land cover (LULC) using FLUS (a, d, g, j) and Demeter (b, e, h, l) downscaling in 2100 for Shared Socioeconomic Pathway SSP126 and historical LULC in 2015 (c, f, i, l). The study area covers the ABoVE domain, and maps display the four dominant land cover types: (a-c) needleleaf evergreen boreal tree, (d-f) broadleaf deciduous boreal tree, (g-i) broadleaf deciduous boreal shrub, and (j-l) C3 arctic grass. The color blue (red) represents a small (large) area fraction of a specific land type.
Citation
Luo, M., F. Li, D. Hao, Q. Zhu, H. Dashti, and M. Chen. 2024. Land Use and Land Cover Change Projection in the ABoVE Domain. ORNL DAAC, Oak Ridge, Tennessee, USA. https://doi.org/10.3334/ORNLDAAC/2353
Table of Contents
- Dataset Overview
- Data Characteristics
- Application and Derivation
- Quality Assessment
- Data Acquisition, Materials, and Methods
- Data Access
- References
Dataset Overview
This dataset provides projections of land use and land cover (LULC) change within the Arctic Boreal Vulnerability Experiment (ABoVE) domain, spanning from 2015 to 2100 with a spatial resolution of 0.25 degrees. It includes LULC change under two Shared Socioeconomic Pathways (SSP126 and SSP585) derived from Global Change Analysis Model (GCAM) at an annual scale. The specific land types include: needleleaf evergreen tree-temperate, needleleaf evergreen tree-boreal, needleleaf deciduous tree-boreal, broadleaf evergreen tree-tropical, broadleaf evergreen tree-temperate, broadleaf deciduous tree-tropical, broadleaf deciduous tree-temperate, broadleaf deciduous tree-boreal, broadleaf evergreen shrub-temperate, broadleaf deciduous shrub-temperate, broadleaf deciduous shrub-boreal, C3 arctic grass, C3 grass, C4 grass, and C3 unmanaged rainfed crop. The data were generated by integrating regional LULC projections from GCAM with high-resolution MODIS land cover data and applying two alternative spatial downscaling models: FLUS and Demeter.
Project: Arctic-Boreal Vulnerability Experiment
The Arctic-Boreal Vulnerability Experiment (ABoVE) is a NASA Terrestrial Ecology Program field campaign being conducted in Alaska and western Canada, for 8 to 10 years, starting in 2015. Research for ABoVE links field-based, process-level studies with geospatial data products derived from airborne and satellite sensors, providing a foundation for improving the analysis, and modeling capabilities needed to understand and predict ecosystem responses to, and societal implications of, climate change in the Arctic and Boreal regions.
Related Publication
Luo, M., F. Li, D. Hao, Q. Zhu, H. Dashti, and M. Chen. 2023. Uncertain spatial pattern of future land use and land cover change and its impacts on terrestrial carbon cycle over the Arctic–Boreal region of North America. Earth’s Future 11:e2023EF003648. https://doi.org/10.1029/2023EF003648
Acknowledgments
This research was supported by NASA's Terrestrial Ecology: Arctic Boreal Vulnerability Experiment (ABoVE) program (grant 80HQTR19T0055). This research used resources of the Center for High Throughput Computing at the University of Wisconsin-Madison.
Data Characteristics
Spatial Coverage: ABoVE domain: Alaska and Canada
ABoVE Reference Locations
Domain: Core and Extended ABoVE Regions
Grid cells: Ah000v000, Ah000v001, Ah001v000, Ah001v001, Ah001v002, Ah002v000, Ah002v001, Ah002v002,
Ah003v000, Ah003v001, Ah003v002, Ah003v003, Ah004v002, Ah004v003
Spatial Resolution: 0.25 degree
Temporal Coverage: 2015-01-01 to 2100-12-31
Temporal Resolution: Annual
Data File Information
There are four data files in NetCDF format:
- landuse.timeseries_ABOVE_025_SSP126_Demeter.nc
- landuse.timeseries_ABOVE_025_SSP585_Demeter.nc
- landuse.timeseries_ABOVE_025_SSP126_FLUS.nc
- landuse.timeseries_ABOVE_025_SSP585_FLUS.nc
In the file names, "SSP126" and "SSP585" refer to two Shared Socioeconomic Pathways. "Demeter" and "FLUS" refer to two methods of downscaling MODIS land cover data.
The coordinate reference system is geographic coordinate using WGS84 datum.
The spatial resolution is 0.25 degrees.
Table 1. Variables the data files.
| Variable | Units | Description | Dimensions (length) |
|---|---|---|---|
| lat | degrees north | Latitude of grid cell | lat (124) |
| lon | degrees east | Longitude of grid cell | lon (352) |
| land_mask | 1 | Binary mask to indicate which grid cells are on land (1) vs. water | lat (124), lon (352) |
| natpft | 1 | Indices of natural plant functional types (PFT); Table 2 indices 0-14 | natpft (15) |
| PCT_CROP | percent | Percent cover of crop portion of grid cell. The crop cover type is 'C3 unmanaged rainfed crop'. |
time (86), lat (124), lon (352) |
| PCT_NAT_PFT | percent | Percent cover of plant functional type (PFT) for natural vegetation portion of grid cell; see Table 2 for PFT descriptions | time (86), natpft (15), lat (124), lon (352) |
| time | d | Annual time step in days since 2015-01-01 00:00:00 | time (86) |
| time_bnds | d | Start and end day of each annual time step | time (86), nv (2) |
Table 2. Vegetation types in PCT_NAT_PFT variable and indexed by the natpft dimension.
| Index value | Vegetation / Plant Functional Type (PFT) |
|---|---|
| 0 | Bare Ground |
| 1 | Needleleaf evergreen tree-temperate |
| 2 | Needleleaf evergreen tree-boreal |
| 3 | Needleleaf deciduous tree-boreal |
| 4 | Broadleaf evergreen tree-tropical |
| 5 | Broadleaf evergreen tree-temperate |
| 6 | Broadleaf deciduous tree-tropical |
| 7 | Broadleaf deciduous tree-temperate |
| 8 | Broadleaf deciduous tree-boreal |
| 9 | Broadleaf evergreen shrub-temperate |
| 10 | Broadleaf deciduous shrub-temperate |
| 11 | Broadleaf deciduous shrub-boreal |
| 12 | C3 arctic grass |
| 13 | C3 grass |
| 14 | C4 grass |
Application and Derivation
This dataset provides projections of future LULC change over ABoVE domain using two spatial downscaling models. This dataset can be used as the input of Earth system models for future climate projections. Luo et al. (2023) demonstrate that using different spatial downscaling models can contribute to a large portion of the uncertainty in future projections of LULC and carbon cycle over the Arctic-Boreal region.
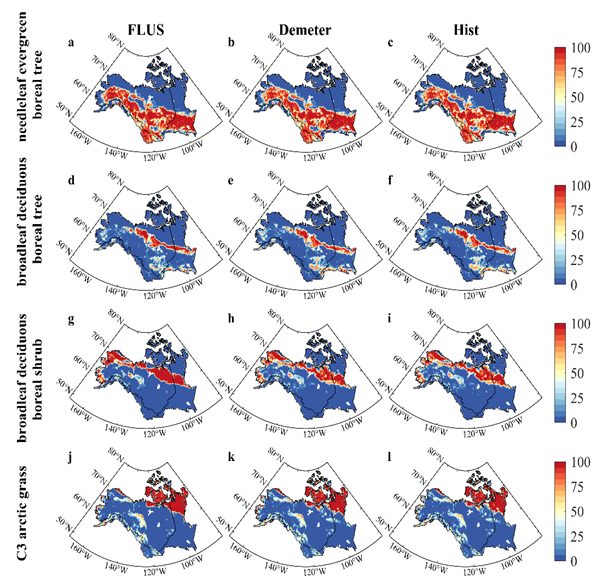
Figure 2. The spatial pattern of land use and land cover (LULC) using FLUS (a, d, g, j) and Demeter (b, e, h, l) downscaling in 2100 for Shared Socioeconomic Pathway SSP585 and historical LULC in 2015 (c, f, i, l). The study area covers the ABoVE domain, and maps display the four dominant land cover types: (a-c) needleleaf evergreen boreal tree, (d-f) broadleaf deciduous boreal tree, (g-i) broadleaf deciduous boreal shrub, and (j-l) C3 arctic grass. The color blue (red) represents a small (large) area fraction of a specific land type.
Quality Assessment
None provided.
Data Acquisition, Materials, and Methods
This dataset used the Global Change Analysis Model (GCAM)-derived land use land cover (LULC) projections at regional scales (Chen et al., 2020b) under both the low (i.e., SSP126) and high (i.e., SSP585) emissions as inputs (cf. Figures 1 and 2).
The base LULC data was from the 2015 MODerate resolution Imaging Spectroradiometer (MODIS) land cover map at a 500 m resolution (MCD12Q1 V6), with the Plant Functional Types (PFTs) classification (MODIS_PFT). However, the LULC type classification schemes differed between MODIS_PFT, GCAM's land use types, and that in the Community Land Model 5.0 (CLM5) (Lawrence et al., 2019). Therefore, LULC types were reclassified to harmonize the differences and for consistency with existing studies (Chen et al., 2020b; Luo et al., 2022).
Two different downscaling methods were used to produce LULC projections: Demeter model and Future Land Use Simulation model (FLUS). Demeter is a LULC spatial disaggregation model developed as part of the GCAM software ecosystem and could be extended to other Integrated Assessment Models (Vernon et al., 2018). FLUS is a cellular automata-based model that can be used to consider nonlinear relationships between complex spatial factors and multiple land types (Liao et al., 2020; Liu et al., 2017).
For Demeter, the 11-category, 500-m MODIS land cover map was transformed into 17 CLM5_PFT categories using the methods from Bonan et al. (2002) and climatological temperature and precipitation data from WorldClim V2 (Fick & Hijmans, 2017). The reclassified MODIS data was then upscaled to a coarser 0.25 degree resolution, serving as the base map for the downscaling process. Then, Demeter is used to downscale the GCAM projections into 0.25-degree LULC data.
For FLUS, the GCAM and MODIS_PFT classifications were consolidated into seven broad types and harmonized (see Luo et al., 2023) while maintaining consistency across geographical areas and spatial downscaling process. The MODIS land cover map was reclassified with seven broad types at 500-m resolution. The FLUS was then used to produce downscaled LULC data with the broad types at 500-m resolution. Following the approach detailed in Chen et al. (2020a), these broad categories were mapped onto the 18 CLM5 PFTs and aggregated to the desired 0.25-degree resolution.
Further details are available in Luo et al. (2023).
Data Access
These data are available through the Oak Ridge National Laboratory (ORNL) Distributed Active Archive Center (DAAC).
Land Use and Land Cover Change Projection in the ABoVE Domain
Contact for Data Center Access Information:
- E-mail: uso@daac.ornl.gov
- Telephone: +1 (865) 241-3952
References
Bonan, G.B., S. Levis, L. Kergoat, and K.W. Oleson. 2002. Landscapes as patches of plant functional types: An integrating concept for climate and ecosystem models. Global Biogeochemical Cycles 16:1021. https://doi.org/10.1029/2000gb001360
Chen, G., X. Li, X. Liu, Y. Chen, X. Liang, J. Leng, X. Xu, W. Liao, Y. Qiu, Q. Wu, and K. Huang. 2020a. Global projections of future urban land expansion under shared socioeconomic pathways. Nature Communications 11:537. https://doi.org/10.1038/s41467-020-14386-x
Chen, M., C.R. Vernon, N.T. Graham, M. Hejazi, M. Huang, Y. Cheng, and K. Calvin. 2020b. Global land use for 2015–2100 at 0.05° resolution under diverse socioeconomic and climate scenarios. Scientific Data 7:320. https://doi.org/10.1038/s41597-020-00669-x
Chen, G., X. Li, and X. Liu. 2022. Global land projection based on plant functional types with a 1-km resolution under socio-climatic scenarios. Scientific Data 9:125. https://doi.org/10.1038/s41597-022-01208-6
Fick, S.E., and R.J. Hijmans. 2017. WorldClim 2: new 1-km spatial resolution climate surfaces for global land areas. International Journal of Climatology 37:4302–4315. https://doi.org/10.1002/joc.5086
Friedl, M.A., D. Sulla-Menashe, B. Tan, A. Schneider, N. Ramankutty, A. Sibley, and X. Huang. 2010. MODIS Collection 5 global land cover: Algorithm refinements and characterization of new datasets. Remote Sensing of Environment 114:168–182. https://doi.org/10.1016/j.rse.2009.08.016
Lawrence, D.M., R.A. Fisher, C.D. Koven, K.W. Oleson, S.C. Swenson, G. Bonan, N. Collier, B. Ghimire, L. van Kampenhout, D. Kennedy, E. Kluzek, P. J. Lawrence, F. Li, H. Li, D. Lombardozzi, W.J. Riley, W. J. Sacks, M. Shi, M. Vertenstein, W.R. Wieder, C. Xu, A.A. Ali, A.M. Badger, G. Bisht, M. van den Broeke, M.A. Brunke, S.P. Burns, J. Buzan, M. Clark, A. Craig, K. Dahlin, B. Drewniak, J. B. Fisher, M. Flanner, A. M. Fox, P. Gentine, F. Hoffman, G. Keppel-Aleks, R. Knox, S. Kumar, J. Lenaerts, L.R. Leung, W.H. Lipscomb, Y. Lu, A. Pandey, J.D. Pelletier, J. Perket, J.T. Randerson, D.M. Ricciuto, B.M. Sanderson, A. Slater, Z.M. Subin, J. Tang, R.Q. Thomas, M. Val Martin, and X. Zeng. 2019. The Community Land Model Version 5: description of new features, benchmarking, and impact of forcing uncertainty. Journal of Advances in Modeling Earth Systems 11:4245–4287. https://doi.org/10.1029/2018MS001583
Liao, W., X. Liu, X. Xu, G. Chen, X. Liang, H. Zhang, and X. Li. 2020. Projections of land use changes under the plant functional type classification in different SSP-RCP scenarios in China. Science Bulletin 65:1935–1947. https://doi.org/10.1016/j.scib.2020.07.014
Liu, X., X. Liang, X. Li, X. Xu, J. Ou, Y. Chen, S. Li, S. Wang, and F. Pei. 2017. A future land use simulation model (FLUS) for simulating multiple land use scenarios by coupling human and natural effects. Landscape and Urban Planning 168:94–116. https://doi.org/10.1016/j.landurbplan.2017.09.019
Luo, M., G. Hu, G. Chen, X. Liu, H. Hou, and X. Li. 2022. 1 km land use/land cover change of China under comprehensive socioeconomic and climate scenarios for 2020–2100. Scientific Data 9:110. https://doi.org/10.1038/s41597-022-01204-w
Luo, M., F. Li, D. Hao, Q. Zhu, H. Dashti, and M. Chen. 2023. Uncertain spatial pattern of future land use and land cover change and its impacts on terrestrial carbon cycle over the Arctic–Boreal region of North America. Earth’s Future 11:e2023EF003648. https://doi.org/10.1029/2023EF003648
Vernon, C.R., Y. Le Page, M. Chen, M. Huang, K.V. Calvin, I.P. Kraucunas, and C.J. Braun. 2018. Demeter – A Land Use and Land Cover Change Disaggregation Model. Journal of Open Research Software 6:15. https://doi.org/10.5334/jors.208