Documentation Revision Date: 2019-05-01
Dataset Version: 1
Summary
The data were collected for the Arctic-CAP project to capture the spatial and temporal dynamics of the northern high latitude carbon cycle as part of ABoVE.
There is one data file in NetCDF (.nc) format with this dataset.
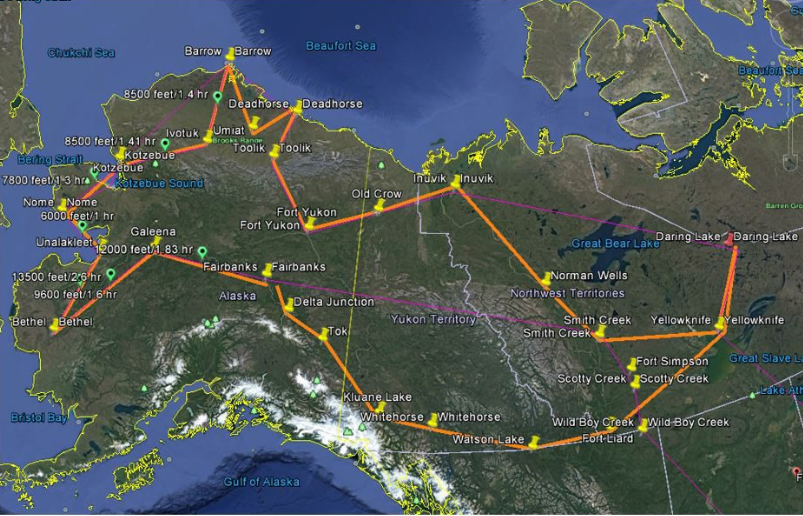
Figure 1. Arctic-CAP flight lines (orange) sample Arctic and boreal regions of Alaska and the Yukon and the Northwest Territories of Canada. Monthly campaigns extended from April through November, capturing the carbon dynamics of the 2017 growing season. Pins mark the locations of the 25 vertical profiles acquired during each monthly campaign. Source: Scientific Aviation, 2019.
Citation
Sweeney, C., and K. McKain. 2019. ABoVE: Atmospheric Profiles of CO, CO2 and CH4 Concentrations from Arctic-CAP, 2017. ORNL DAAC, Oak Ridge, Tennessee, USA. https://doi.org/10.3334/ORNLDAAC/1658
Table of Contents
- Dataset Overview
- Data Characteristics
- Application and Derivation
- Quality Assessment
- Data Acquisition, Materials, and Methods
- Data Access
- References
Dataset Overview
This dataset provides in situ airborne measurements of atmospheric carbon monoxide (CO), carbon dioxide (CO2), methane (CH4), and water vapor concentrations, plus air temperature, pressure, relative humidity, and wind speed values over Alaska and the Yukon and Northwest Territories of Canada during the Arctic Carbon Aircraft Profile (Arctic-CAP) monthly sampling campaigns from April-November 2017. Observations have been averaged to a 10-second interval and are reported with the number of samples (N) and standard deviation. During each of the six monthly campaigns, flights over the Arctic-Boreal Vulnerability Experiment (ABoVE) domain included 25 vertical profiles, from the surface up to 6 km altitude, at locations selected to complement regular long-term vertical profiles, remote sensing data, and ground-based flux tower measurements.
The data were collected in order to capture the spatial and temporal dynamics of the northern high latitude carbon cycle as part of ABoVE.
Project: Arctic-Boreal Vulnerability Experiment
The Arctic-Boreal Vulnerability Experiment (ABoVE) is a NASA Terrestrial Ecology Program field campaign based in Alaska and western Canada between 2016 and 2021. Research for ABoVE links field-based, process-level studies with geospatial data products derived from airborne and satellite sensors, providing a foundation for improving the analysis and modeling capabilities needed to understand and predict ecosystem responses and societal implications.
Related Data Set:
Oechel, W., and A. Kalhori. 2018. ABoVE: CO2 and CH4 Fluxes and Meteorology at Flux Tower Sites, Alaska, 2015-2017. ORNL DAAC, Oak Ridge, Tennessee, USA. https://doi.org/10.3334/ORNLDAAC/1562
Wofsy, S.C., et al. 2018. ATom: Merged Atmospheric Chemistry, Trace Gases, and Aerosols. ORNL DAAC, Oak Ridge, Tennessee, USA. https://doi.org/10.3334/ORNLDAAC/1581
Acknowledgement:
This research received funding from the NASA Terrestrial Ecology Program, grant number NNX17AC61A.
Data Characteristics
Spatial Coverage: Alaska and Canada
ABoVE Reference Locations:
Domain: Core and extended
State/territory: Alaska and Yukon and Northwest Territories of Canada
Grid cells: Ah000v000, Ah000v001, Ah001v001, Ah002v001
Spatial Resolution: Point locations. At aircraft speed of 170 knots (87.5 m/s), one 10-s averaging interval covers a distance of ~875 m. Profiles cover a vertical range from the surface up to 6 km altitude.
Temporal Coverage: 2017-04-26 to 2017-11-05
Temporal Resolution: Data were collected in approximately monthly campaigns with 7-8 flight days for each campaign. Measurement data have been averaged to 10-second intervals.
Study Areas (All latitude and longitude given in decimal degrees)
| Site | Westernmost Longitude | Easternmost Longitude | Northernmost Latitude | Southernmost Latitude |
|---|---|---|---|---|
| Alaska and Canada | -166.04539 | -104.1124 | 71.287399 | 40.0387 |
Data File Information
There is one data file in NetCDF (.nc) format with this dataset.
For each variable, there are 107,400 observations (10-sec averages) collected during 55 individual flights over the period 2017-04-26 to 2017-11-05.
Table 1. Summary table listing each of the 55 unique flights with their respective campaigns and beginning and ending locations. The Flight_ID format is the date (YYYYMMDD) on which the flight began. Note that the starting and ending locations don’t necessarily indicate the full flight path for that day.
| Campaign | Flight ID | lat_start | lon_start | Start_loc | lat_end | lon_end | End_loc |
|---|---|---|---|---|---|---|---|
| Transit flight | 20170426 | 40.0391 | -105.2322 | Colorado | 62.4684 | -114.4433 | Yellowknife |
| April-May | 20170427 | 62.4702 | -114.4493 | Yellowknife | 62.469 | -114.4441 | Yellowknife |
| 20170428 | 62.4707 | -114.4517 | Yellowknife | 68.3039 | -133.4776 | Inuvik | |
| 20170429 | 68.3033 | -133.5016 | Inuvik | 64.8053 | -147.8663 | Fairbanks | |
| 20170430 | 64.805 | -147.8816 | Fairbanks | 64.5093 | -165.3624 | Nome | |
| 20170501 | 64.5078 | -165.4506 | Nome | 64.8219 | -147.8505 | Fairbanks | |
| 20170503 | 64.8044 | -147.8827 | Fairbanks | 60.7129 | -135.0704 | Whitehorse | |
| 20170504 | 60.7172 | -135.0731 | Whitehorse | 62.4704 | -114.4502 | Yellowknife | |
| June | 20170606 | 62.4657 | -114.4295 | Yellowknife | 68.3039 | -133.4776 | Inuvik |
| 20170607 | 68.3033 | -133.5 | Inuvik | 64.806 | -147.8651 | Fairbanks | |
| 20170608 | 64.8032 | -147.8849 | Fairbanks | 64.5114 | -165.443 | Nome | |
| 20170609 | 64.5083 | -165.4497 | Nome | 64.8051 | -147.8667 | Fairbanks | |
| 20170613 | 64.8131 | -147.8667 | Fairbanks | 64.8064 | -147.8643 | Fairbanks | |
| 20170614 | 64.8135 | -147.866 | Fairbanks | 60.5655 | -151.2556 | Anchorage | |
| 20170618 | 59.6415 | -151.4882 | Anchorage | 60.7152 | -135.0678 | Whitehorse | |
| 20170619 | 60.7121 | -135.0692 | Whitehorse | 62.4681 | -114.4402 | Yellowknife | |
| July | 20170709 | 62.4708 | -114.4522 | Yellowknife | 62.4697 | -114.4434 | Yellowknife |
| 20170710 | 62.4704 | -114.4504 | Yellowknife | 68.3035 | -133.4927 | Inuvik | |
| 20170712 | 68.3033 | -133.4994 | Inuvik | 64.8215 | -147.8513 | Fairbanks | |
| 20170713 | 64.8035 | -147.8843 | Fairbanks | 64.5127 | -165.4405 | Nome | |
| 20170714 | 64.508 | -165.4503 | Nome | 64.8096 | -147.8584 | Fairbanks | |
| 20170717 | 64.8135 | -147.866 | Fairbanks | 64.811 | -147.8705 | Fairbanks | |
| 20170718 | 64.8266 | -147.8419 | Fairbanks | 64.8205 | -147.8531 | Fairbanks | |
| 20170719 | 64.2617 | -146.0123 | Fairbanks | 60.7157 | -135.0721 | Whitehorse | |
| 20170721 | 60.7175 | -135.0734 | Whitehorse | 62.4701 | -114.4435 | Yellowknife | |
| August | 20170817 | 56.6532 | -111.2097 | Fort McMurray | 68.3038 | -133.4824 | Inuvik |
| 20170818 | 68.3034 | -133.4991 | Inuvik | 64.8203 | -147.8535 | Fairbanks | |
| 20170821 | 64.8134 | -147.8662 | Fairbanks | 64.8082 | -147.8609 | Fairbanks | |
| 20170823 | 64.826 | -147.8429 | Fairbanks | 64.5106 | -165.444 | Nome | |
| 20170824 | 64.7501 | -164.3066 | Quartz Creek | 65.4121 | -164.6727 | Quartz Creek | |
| 20170826 | 64.5178 | -165.43 | Nome | 64.5125 | -165.441 | Nome | |
| 20170827 | 64.5085 | -165.4491 | Nome | 64.8219 | -147.8504 | Fairbanks | |
| 20170828 | 64.8121 | -147.8686 | Fairbanks | 60.7146 | -135.0712 | Whitehorse | |
| 20170829 | 60.7179 | -135.0737 | Whitehorse | 62.4699 | -114.4435 | Yellowknife | |
| 20170830 | 62.4702 | -114.4493 | Yellowknife | 62.4691 | -114.4448 | Yellowknife | |
| September | 20170908 | 62.4656 | -114.4292 | Yellowknife | 60.7135 | -135.0665 | Whitehorse |
| 20170910 | 60.7186 | -135.0742 | Whitehorse | 60.9571 | -137.4537 | Whitehorse | |
| 20170913 | 60.7178 | -135.0737 | Whitehorse | 64.8206 | -147.8529 | Fairbanks | |
| 20170915 | 64.8128 | -147.8672 | Fairbanks | 70.1957 | -148.4543 | Deadhorse | |
| 20170917 | 64.8137 | -147.8656 | Fairbanks | 64.5112 | -165.4482 | Nome | |
| 20170918 | 64.5094 | -165.4366 | Nome | 64.8093 | -147.859 | Fairbanks | |
| 20170921 | 64.8131 | -147.8667 | Fairbanks | 64.8091 | -147.8593 | Fairbanks | |
| 20170924 | 64.8134 | -147.8661 | Fairbanks | 64.8112 | -147.8702 | Fairbanks | |
| 20170927 | 64.8124 | -147.868 | Fairbanks | 62.4685 | -114.4421 | Yellowknife | |
| 20170928 | 62.471 | -114.4527 | Yellowknife | 55.1845 | -118.8811 | Grand Prairie | |
| October-November | 20171018 | 56.6532 | -111.2067 | Fort McMurray | 62.4604 | -114.442 | Yellowknife |
| 20171021 | 62.4658 | -114.4297 | Yellowknife | 68.3036 | -133.4895 | Inuvik | |
| 20171022 | 68.3042 | -133.4667 | Inuvik | 64.8215 | -147.8512 | Fairbanks | |
| 20171023 | 64.8126 | -147.8676 | Fairbanks | 64.8077 | -147.8766 | Fairbanks | |
| 20171025 | 64.8039 | -147.8836 | Fairbanks | 64.8091 | -147.874 | Fairbanks | |
| 20171031 | 64.8036 | -147.8842 | Fairbanks | 64.8082 | -147.8757 | Fairbanks | |
| 20171101 | 64.8264 | -147.8423 | Fairbanks | 64.8099 | -147.8726 | Fairbanks | |
| 20171102 | 64.8041 | -147.8832 | Fairbanks | 60.7151 | -135.0716 | Whitehorse | |
| 20171104 | 60.7029 | -135.0622 | Whitehorse | 55.1845 | -118.8797 | Grand Prairie | |
| Transit flight | 20171105 | 55.1845 | -118.874 | Grand Prairie | 40.209 | -104.9237 | Colorado |
Data Dictionary
File name: ABoVE_2017_insitu_10sec.nc
Table 2. Variables in the data file
| Variable | Units/format | Description |
|---|---|---|
| altitude | m.a.s.l. | Sample altitude (GPS altitude) in meters above sea level |
| flight_id | YYYYMMDD | A unique number identifying each flight. The format is the date in YYYYMMDD on which the flight began. See Table 1. |
| CH4 | nmol per mol | Mole fraction of methane in dry air. Average of all measurements made in the time interval. Mole fraction reported in units of nanomole per mol (1e-9 mol per mol of dry air); equivalent to ppb (parts per billion). Fill value: -9999 |
| CH4_nvalue | Number of individual measurements used to compute reported value. Fill value: -9 | |
| CH4_stdv | nmol per mol | Standard deviation of all measurements made in the time interval. A value of 0 occurs when nvalue is equal to 1. The mole fraction reported in units of nanomole per mol (1e-9 mol per mol of dry air). Fill value: -9999 |
| CH4_unc | nmol per mol | Estimated uncertainty of the reported value. May be a single average uncertainty value for the whole dataset. The mole fraction reported in units of nanomole per mol (1e-9 mol per mol of dry air). Fill value: -9999 |
| CO2 | umol per mol | Mole fraction of carbon dioxide in dry air; average of all measurements made in the time interval. Mole fraction reported in units of micromole per mole (1e-6 mol per mol of dry air); equivalent to ppm (parts per million). Fill value: -9999 |
| CO2_nvalue | Number of individual measurements used to compute reported value. Fill value: -9 | |
| CO2_stdv | umol per mol | Standard deviation of all measurements made in the time interval. A value of 0 occurs when nvalue is equal to 1. The mole fraction reported in units of micromole per mole (1e-6 mol per mol of dry air); equivalent to ppm (parts per million). Fill value: -9999 |
| CO2_unc | umol per mol | Estimated uncertainty of the reported value. May be a single average uncertainty value for the whole dataset. The mole fraction reported in units of micromole per mole (1e-6 mol per mol of dry air); equivalent to ppm (parts per million).Fill value: -9999 |
| CO | nmol per mol | Mole fraction of carbon monoxide in dry air; average of all measurements made in the time interval. Mole fraction reported in units of nanomole per mol (1e-9 mol per mol of dry air); equivalent to ppb (parts per billion). |
| CO_nvalue | Number of individual measurements used to compute reported value. Fill value: -9 | |
| CO_stdv | nmol per mol | Standard deviation of all measurements made in the time interval. A value of 0 occurs when nvalue is equal to 1. The mole fraction reported in units of nanomole per mol (1e-9 mol per mol of dry air). Fill value: -9999 |
| CO_unc | nmol per mol | Estimated uncertainty of the reported value. May be a single average uncertainty value for the whole dataset. The mole fraction reported in units of nanomole per mol (1e-9 mol per mol of dry air). Fill value: -9999 |
| H2O | % | Water vapor; Average of all measurements made in the time interval. Fill value: -9999 |
| H20_nvalue | Number of individual measurements used to compute reported value. Fill value: -9 | |
| H20_stdv | % | Standard deviation of all measurements made in the time interval. A value of 0 occurs when nvalue is equal to 1. Fill value: -9999 |
| H2O_unc | % | Estimated uncertainty of the reported value. May be a single average uncertainty value for the whole dataset |
| latitude | Decimal degrees | Latitude at which air sample was collected |
| longitude | Decimal degrees | Longitude at which air sample was collected |
| T | Degrees K | Air temperature from the Vaisala instrument; average of all measurements made in the time interval. Not calibrated |
| T_nvalue | Number of individual measurements used to compute reported value. Fill value: -9 | |
| T_stdv | Degrees K | Standard deviation of all measurements made in the time interval. A value of 0 occurs when nvalue is equal to 1 |
| T_unc | Degrees K | Estimated uncertainty of the reported value. May be a single average uncertainty value for the whole dataset. Fill value: -9999 |
| P | Pa | Air pressure; average of all measurements made in the time interval. Not calibrated. Measuring instrument: Picarro G2401 |
| P_nvalue | Pa | Number of individual measurements used to compute reported value. Fill value: -9 |
| P_stdv | Pa | Standard deviation of all measurements made in the time interval. A value of 0 occurs when nvalue is equal to 1. Fill value: -9999 |
| P_unc | Pa | Estimated uncertainty of the reported value. May be a single average uncertainty value for the whole dataset. Fill value: -9999 |
| profile_id | A unique integer greater than 0 for each profile on each flight number; a value of 0 means that those data are not part of a profile | |
| RH | % | Relative humidity; average of all measurements made in the time interval. Not calibrated |
| RH_nvalue | % | Number of individual measurements used to compute reported value. Fill value: -9 |
| RH_stdv | % | Standard deviation of all measurements made in the time interval. A value of 0 occurs when nvalue is equal to 1. Fill value: -9999 |
| RH_unc | % | Estimated uncertainty of the reported value. May be a single average uncertainty value for the whole dataset. Fill value: -9999 |
| time | seconds since 1970-01-01T00:00:00Z | Number of seconds since January 1, 1970 in UTC. Time-averaged values are reported at the beginning of the averaging interval |
| time_components | YMDHMS | Calendar time components as integers. Times and dates are UTC. Time-averaged values are reported at the beginning of the averaging interval. Provided in the order: year, month, day, hour, minute, second |
| time_decimal | Decimal year in UTC. Time-averaged values are reported at the beginning of the averaging interval | |
| u | m/s | Eastward wind (Aspen instrument); Average of all measurements made in the time interval. Aircraft calibrated. Fill value: -9999 |
| u_nvalue | m/s | Number of individual measurements used to compute reported value. Fill value: -9 |
| u_stdv | m/s | Standard deviation of all measurements made in the time interval. A value of 0 occurs when nvalue is equal to 1. Fill value: -9999 |
| u_unc | m/s | Estimated uncertainty of the reported value. May be a single average uncertainty value for the whole dataset. Fill value: -9999 |
| v | m/s | Northward wind (Aspen instrument); Average of all measurements made in the time interval. Aircraft calibrated. Fill value: -9999 |
| v_nvalue | m/s | Number of individual measurements used to compute reported value. Fill value: -9 |
| v_stdv | m/s | Standard deviation of all measurements made in the time interval. A value of 0 occurs when nvalue is equal to 1. Fill value: -9999 |
| v_unc | m/s | Estimated uncertainty of the reported value. May be a single average uncertainty value for the whole dataset. Fill value: -9999 |
User Note: The variable "profile_id" identifies the observations that are part of a vertical profile during a flight. A unique integer greater than 0 identifies each profile on each flight (flight_id). A value of 0 means that those data are not part of a vertical profile.
Application and Derivation
Large changes in surface air temperature, sea ice cover and permafrost in the Arctic Boreal Ecosystems (ABE) are likely to have significant impact on the critical ecosystem services and the human societies that are dependent on the ABE. In order to predict the outcome of continued change to the climate system in the ABE, it is necessary to understand the vulnerabilities of the underlying ABE ecosystems by understanding what processes drive both spatial variability and interannual variability.
These data contribute to our understanding and predictive capabilities for modeling the land-atmospheric exchange of CO2 and CH4 to better understand the feedbacks that these greenhouse gases will have on the ABE.
Quality Assessment
The number of samples (N) and standard deviation for each 10-second average value are included in the data file. Measurement uncertainties are also included for each variable -- may be a single average uncertainty value for the whole dataset.
Data Acquisition, Materials, and Methods
The Arctic Carbon Aircraft Profile (Arctic-CAP) project was designed to measure vertical profiles of atmospheric CO2, CH4, and CO concentrations to capture the spatial and temporal dynamics of the northern high latitude carbon cycle as part of the Arctic-Boreal Vulnerability Experiment (ABoVE) (Miller et al., 2019).
The sampling strategy involved acquiring vertical profiles of CO2, CH4, and CO concentrations from the surface to 6 km altitude around the ABoVE domain each month. The profiles were acquired from locations selected to complement regular long-term vertical profiles, remote sensing data, and ground-based flux tower measurements. These data spatially link the regular vertical profiles obtained at Poker Flats, AK and East Trout Lake, SK as part of the ESRL/GMD Aircraft Program (https://www.esrl.noaa.gov/gmd/ccgg/aircraft/). These measurements were complemented by additional vertical profiles that were acquired at altitudes up to 14 km by the NASA DC-8 in August (Active Sensing of CO2 Emissions over Nights, Days, & Seasons [ASCENDS], https://www-air.larc.nasa.gov/missions/ascends/index.html) and October (Atmospheric Tomography Mission [AToM], Wofsy et al. (2018)).
Six campaigns were flown from April to early November in 2017 with instrumentation aboard a Mooney Ovation 3 M20R (N617DH, Scientific Aviation). Airborne in situ measurements included CO2, CO, CH4, water vapor, RH, temperature and wind.
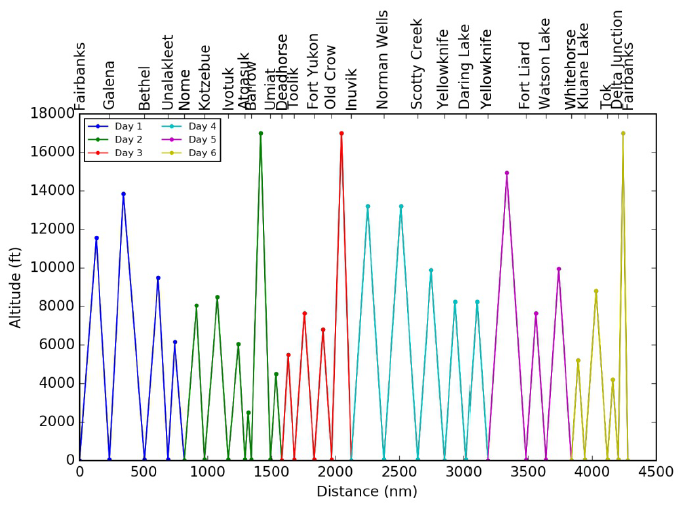
Figure 2. For each campaign, vertical profiles were flown at each of the ~25 locations listed across the top of this figure. These locations are shown on Figure 1. Nominally, the campaign would require 6 flying days to complete all of the profiles.
The profiles were acquired from locations selected to complement regular long-term vertical profiles, remote sensing data, and ground-based flux tower measurements.
The measurements are described in Table 2. Instruments utilized are provided in Table 3.
Table 3. Airborne in situ instruments
| Instrument | Measurement frequency | Measurement |
|---|---|---|
| Picarro G2401 | 2.4 seconds | CH4, CO, CO2, and water vapor (H20), Air pressure (P) |
| Vaisala | 1 Hz | Relative humidity (RH), air temperature (T) |
| Aspen | 1 Hz | Eastward wind (u) and northward wind (v) speeds |
Data Access
These data are available through the Oak Ridge National Laboratory (ORNL) Distributed Active Archive Center (DAAC).
ABoVE: Atmospheric Profiles of CO, CO2 and CH4 Concentrations from Arctic-CAP, 2017
Contact for Data Center Access Information:
- E-mail: uso@daac.ornl.gov
- Telephone: +1 (865) 241-3952
References
Scientific Aviation. 2019. Company Website (http://www.scientificaviation.com/). Arctic-CAP flight lines image: http://www.scientificaviation.com/wp-content/uploads/2019/01/cropped-Above_Loop.jpg Accessed 20190409.
Miller, C.E., P. Griffith, S. Goetz, E. Hoy, N. Pinto, I. Mccubbin, A.K. Thorpe, M.M. Hofton, D.J. Hodkinson, and C. Hansen, J. Woods, E.K. Larsen, E.S. Lasischke, and H. Margolis. 2019. An overview of above airborne campaign data acquisitions and science opportunities. Environmental Research Letters. https://doi.org/10.1088/1748-9326/ab0d44
Sweeney, C., A. Karion, S. Wolter, T. Newberger, D. Guenther, J.A. Higgs, A.E. Andrews, P.M. Lang, D. Neff, E. Dlugokencky, and J.B. Miller. 2015. Seasonal climatology of CO2 across North America from aircraft measurements in the NOAA/ESRL Global Greenhouse Gas Reference Network. Journal of Geophysical Research: Atmospheres, 120(10), pp.5155-5190. https://doi.org/10.1002/2014JD022591
Wofsy, S.C., S. Afshar, H.M. Allen, E. Apel, E.C. Asher, B. Barletta, J. Bent, H. Bian, B.C. Biggs, D.R. Blake, N. Blake, I. Bourgeois, C.A. Brock, W.H. Brune, J.W. Budney, T.P. Bui, A. Butler, P. Campuzano-Jost, C.S. Chang, M. Chin, R. Commane, G. Correa, J.D. Crounse, P. D. Cullis, B.C. Daube, D.A. Day, J.M. Dean-Day, J.E. Dibb, J.P. DiGangi, G.S. Diskin, M. Dollner, J.W. Elkins, F. Erdesz, A.M. Fiore, C.M. Flynn, K. Froyd, D.W. Gesler, S.R. Hall, T.F. Hanisco, R.A. Hannun, A.J. Hills, E.J. Hintsa, A. Hoffman, R.S. Hornbrook, L.G. Huey, S. Hughes, J.L. Jimenez, B.J. Johnson, J.M. Katich, R.F. Keeling, M.J. Kim, A. Kupc, L.R. Lait, J.-F. Lamarque, J. Liu, K. McKain, R.J. Mclaughlin, S. Meinardi, D.O. Miller, S.A. Montzka, F.L. Moore, E.J. Morgan, D.M. Murphy, L.T. Murray, B.A. Nault, J.A. Neuman, P.A. Newman, J.M. Nicely, X. Pan, W. Paplawsky, J. Peischl, M.J. Prather, D.J. Price, E. Ray, J.M. Reeves, M. Richardson, A.W. Rollins, K.H. Rosenlof, T.B. Ryerson, E. Scheuer, G.P. Schill, J.C. Schroder, J.P. Schwarz, J.M. St.Clair, S.D. Steenrod, B.B. Stephens, S.A. Strode, C. Sweeney, D. Tanner, A.P. Teng, A.B. Thames, C.R. Thompson, K. Ullmann, P.R. Veres, N. Vieznor, N.L. Wagner, A. Watt, R. Weber, B. Weinzierl, P. Wennberg, C.J. Williamson, J.C. Wilson, G.M. Wolfe, C.T. Woods, and L.H. Zeng. 2018. ATom: Merged Atmospheric Chemistry, Trace Gases, and Aerosols. ORNL DAAC, Oak Ridge, Tennessee, USA. https://doi.org/10.3334/ORNLDAAC/1581